Microgeometry Tests of ’Contradictory’
Surfaces with Various Evaluation Techniques
Gábor Fekete
Budapest University of Technology and Economics, H-1111 Budapest, Hungary E-mail: fucso01@gmail.com
Sándor Horváth, Árpád Czifra
Budapest Tech, H-1081 Budapest, Hungary, E-mail: czifra.arpad@bgk.bmf.hu
Abstract: The article deals with a special problem area of the filtering and evaluation techniques of surface roughness measurement and calls attention to the contradictions of parameters to characterize surface microgeometry. Differences in the value of parameters are presented through tests of the operating surfaces of three disparate component types.
Each chapter discusses the evaluation of measurement results according to various methods, on the basis of which it can be established that value differences are caused by the use of different filters, on the one hand, and by discrepancies between the profiles detected. From the practical point of view, it is most expedient to characterize surfaces with unfiltered parameters.
Keywords: surface roughness, filtering, motif, height difference correlation
1 Introduction
A number of measurement and evaluation techniques are known to test surface microgeometry [1]. At the same time, parameter-based characterization is used nearly exclusively in industrial practice: it has provided general roughness (Ra) and other parameters since the 1930s. This list of parameters has considerably expanded by today and the applicable standard [2] accurately defines the method and parameters of evaluation.
Filtering the measured profile, that is, the separation of roughness and waviness forms an important part of microgeometry evaluation. Its significance was formerly discussed in detail [3]. This study calls attention to a special probleam area of filtering and parameter based evaluation techniques. It was already stated by [4] that parameter-based characterization is uncertain and limited in many
respects because results depend, to a great extent, on scanning length and resolution. As recommended by the standard, scanning and evaluation length are closely correlated with filtering, which also exerts a significant impact on results [5].
Our study characterizes the profiles measured by not only parameters but also by a motif-based technique and a height-difference correlation function, thereby seeking an explanation and solution for the problems arisen.
2 Test Methods, Problem Description
2.1 Measurement Technique
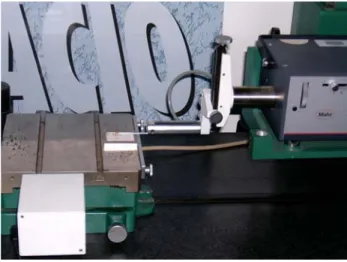
The tests presented in this article were performed using a Mahr Perthometer Concept type stylus instrument according to the measurement arrangement shown in Figure 1.
Figure 1 Measurement arrangement
The unit on the left side of the picture is the object table, on which various fitting and fixing devices can be fastened. On the right side of the picture, the unit holding and moving the stylus instrument is shown, whose main function is to drag the stylus instrument at the appropriate speed, to position it vertically and to hold it fixed. The signals detected by the stylus instrument are transmitted to a PC through the control unit, thereby data can be recorded and evaluated promptly after the measurement. Passive vibration proofing is provided by the granite table constituting the machinery unit base.
The tests to be presented in later chapters were performed using an RHT 3-50e type stylus instrument. Three different components were used as test pieces for the measurements: a turbo loading blade, a carburettor nozzle and a fuel feeder. In order to detect the problem at an appropriate level, several measurements were performed with the same setup of the measuring equipment; however, our article only presents the evaluation of each representative measurement.
2.2 Evaluation Technique
The results yielded by measurements were analyzed using three evaluation methods. The reason for this is that the more or less advantageous and disadvantageous applicability of each method is demonstrated and the measured surfaces are characterized from various aspects. The basic principle of evaluation methods is discussed below.
2.2.1 Parameter-based Evaluation Method
This procedure is the most frequently applied evaluation technique in both scientific research and industries. The reason for this is that surface topography data reveal statistical features, so the measurement points specified in an x-y-z coordinate system can be used for specifying parameters and functions by statistical means. [6]
Parameter evaluation is started from the so-called median line, which divides the profile detected by the measuring instrument in a way that the sum of the square of the profile ordinates is the smallest. The profile yielded this way is broken down into a waviness and roughness profile using a filter prescribed by the standard. Each parameter can be specified for both unfiltered and filters waviness and roughness profiles. Parameters pertaining to the roughness profile are used in practice nearly exclusively.
2.2.2 Motif Method
One of the basic ideas of the profile analysis described in the title is that the tribological behaviour of the operating surfaces of components is significantly affected only by surface asperities greatly protruding from the median plane.
Thus, in the course of evaluation, some details of the profile detected from the surface can be disregarded under certain circumstances.
The profile section between two adjacent peaks of the profile detected is termed a motif. In the course of profile analysis, motif combinations are used to study whether the common peak of two adjacent motifs can be disregarded when calculating roughness and waviness parameters, that is, whether two adjacent motifs can be substituted by a common motif. The rules of combining and quitting motifs are described in the literature. [7] After establishing the motif combination
of the profile detected, roughness parameters will result from the evaluation of the transformed profile. [7]
2.2.3 Height-Difference Correlation Function
A number of people in scientific circles urge the introduction of a function-based approach to evaluate surface microtopography. Several correlation functions have been defined in this respect. The height-difference correlation function (HDCF) is defined as follows [8]:
( )
( )
2z( ) z(x z(x)
C λ = +λ − , where:
λ wavelength,
z(x) height coordinate of measured point located in x, z(x+ λ) height coordinate of measured point located in (x+ λ),
⋅
average value over the x range,By representing the function Cz(λ) in a logarithmic coordinate system, some characteristic parameters can be read (Figure 2). Correlation length ξ⊥ is to characterize the profile in the vertical direction, while correlation length ξII is to characterize the profile in the longitudinal direction. Furthermore, D fractal dimension can also be read from the curve.
ξ⊥2
ξII m=6-2D lgCz(λ)
lg λ Figure 2
Representation of function Cz(λ)
2.3 Problems of Evaluation Techniques
In the course of parameter-based evaluations, geometrical discrepancies arising from different sources are separated, roughness and waviness are examined separately. Separation is performed on the basis of the wavelength of the two profile components, which is characterized by λc (Cut-Off). λc is identical with
the basic measurement length lr, which can be used to interpret a considerable part of roughness parameters. The entire evaluation section is a multiple of the basic length (in general: ln = 5
ּ
λc). The basic measurement and evaluation settings of the instruments are also specified by standards. The prescribed values of settings are selected depending on the fineness of the surface, according to the following table.Table 1
Cut-Off and sampling distance in function of roughness parameters
Cut-Off values according to ISO 4288-1996 Periodical profile Non-periodical profile Cut-Off
Basic length of roughness / evaluation section Spacing Distance
Sm (mm)
Rz
(µm)
Ra
(µm)
λc (mm)
lr/ln (mm)
>0.013 to 0.04 to 0.1 to 0.02 0.08 0.08/0.4
>0.04 to 0.13 >0.1 to 0.5 >0.02 to 0.1 0.25 0.25/1.25
>0.13 to 0.4 >0.5 to 10 >0.1 to 2 0.8 0.8/4
>0.4 to 1.3 >10 to 50 >2 to 10 2.5 2.5/12.5
>1.3 to 4 >50 >10 8 8/40
When performing 2D measurements – as the characteristic parameters of the surface are not known – the required measurement length is specified on the basis of the expected surface roughness values of the surface examined. If the results yielded by the measurements are not within the intervals pertaining to standard measurement lengths, then the measurement must be repeated at another standard test length.
This article intends to present contradictory cases experienced in the course of surface roughness measurements where it was a problem to specify the parameters
’really’ characterizing the surfaces. Controversial results were yielded by the examination, in the course of the measurements, of the operating surfaces – with the required surface roughness as designed – of turbo loading blades, carburettor nozzles and fuel feeders applied in diesel engines. We experienced that in case of different standard measurement lengths, different roughness values were yielded, all of which were within the value ranges prescribed by the standard for the respective measurement lengths. In the course of tests, the same part of surfaces was scanned by the stylus instrument after the adjustment of measurement lengths.
The characteristic surface of each test piece was measured several times under identical measurement conditions; dominant measurement results are summarized in Table 2.
Table 2
Values set and measured in the course of tests Parameters Turbo loading
blade
Carburettor
nozzle Fuel feeder Cut-Off (mm) 0.25 0.8 0.08 0.25 0.08 0.25 Measurement length
(mm) 1.75 5.6 0.56 1.75 0.56 1.75 Ra (µm) 0.088 0.217 0.013 0.023 0.015 0.022 Rz (µm) 0.463 1.379 0.083 0.275 0.086 0.151 When examining measurement results, conspicuous discrepancies can be seen in the case of the most frequently used indices. Average and maximum surface roughness values sometimes present discrepancies of orders of magnitude at the same test piece, while each measurement can be deemed as a standard test.
3 Results
3.1 Parameter-based Characterization
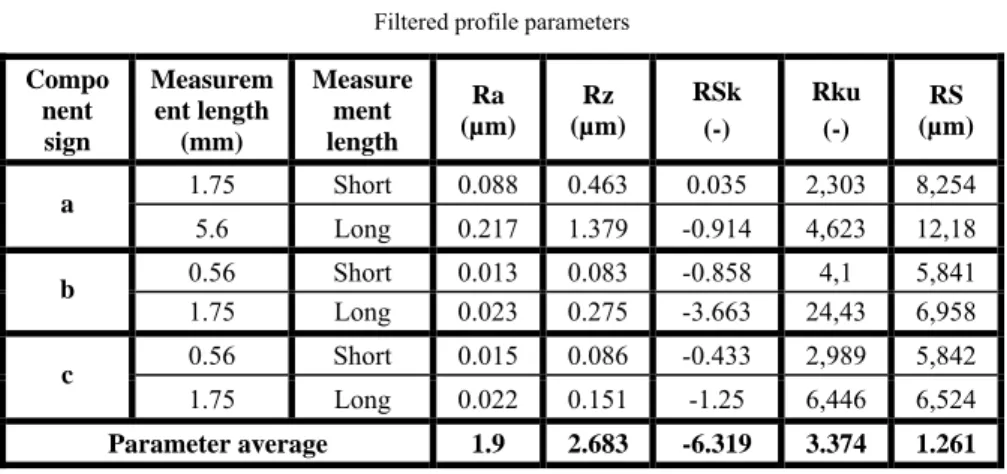
Table 3 shows filtered roughness profile parameters while Table 4 shows unfiltered profile parameters for the three different components, where the signage is the following:
c Fuelfeeder
b nozzle
r Carburetto
a ngblade Turboloadi
⇒
⇒
⇒
Table 3 Filtered profile parameters Compo
nent sign
Measurem ent length (mm)
Measure ment length
Ra (µm)
Rz (µm)
RSk (-)
Rku (-)
RS (µm) 1.75 Short 0.088 0.463 0.035 2,303 8,254 a 5.6 Long 0.217 1.379 -0.914 4,623 12,18
0.56 Short 0.013 0.083 -0.858 4,1 5,841 b 1.75 Long 0.023 0.275 -3.663 24,43 6,958
0.56 Short 0.015 0.086 -0.433 2,989 5,842 c 1.75 Long 0.022 0.151 -1.25 6,446 6,524
Parameter average 1.9 2.683 -6.319 3.374 1.261
Table 4
Unfiltered profile parameters Compon
ent sign
Measurem ent length (mm)
Measure ment length
Pa (µm)
Pt (µm)
PSk (-)
Pku (-)
PS (µm) 1.75 rövid 0.308 2.266 -1.339 5,306 12,667 a 5.6 hosszú 0.327 2.835 -0.925 4,32 14,758
0.56 rövid 0.016 0.146 -1.319 6,676 5,963 b 1.75 hosszú 0.023 0.444 -3.528 25,32 7,083
0.56 rövid 0.018 0.124 -0.607 3,136 6,059 c 1.75 hosszú 0.022 0.252 -1.357 7,030 6,599
Parameter average 1.24 2.1 -1.867 2.283 1.147 Average values serving as a basis for evaluation were provided by the following formula:
3
r h r h r h
c c b b a a verage Parametera
+ +
=
In the formula, the indices refer to measurement lengths. Out of the average values calculated, those parameters can be considered as appropriate surface characteristics where the values are in the range of 1 to 1.5. The reason for this is that such degrees of discrepancy may result from other measurement errors as well.
It can be established on the basis of the results that filtered parameters present significant differences in case of dissimilar measurement lengths, in spite of the fact that they refer to the same surface. Contradictory results can arise for two reasons: on the one hand, the difference in measurement lengths; and on the other hand, the different filters applied in the course of measurements.
As regards roughness indices, height-type characteristics presented (Ra, Rz) 2 to 2.5-fold differences. Even greater discrepancies arose in distortion characteristics (RSk, RKu). Measurement results fell in the acceptable range only for the width parameter RS.
On the whole, it can be stated that filtered parameters reflect surfaces measured in various ways to a lesser degree, therefore it is reasonable to apply unfiltered parameters.
As regards the indices in Table 4, it can be established that the value differences of measurements pertaining to identical surfaces are smaller than in the case of filtered profile parameters. These characteristics refer to identical test surfaces more specifically. Discrepancies can be explained by the various profiles detected, from which it directly follows that roughness indices react sensitively to the filters set.
In the case of the height parameters derived from unfiltered profile evaluation, discrepancies account for up to 75% of the differences experienced with filtered profiles. The smallest difference can be detected in longitudinal characteristics (RS, PS), which could also result from a measurement errors.
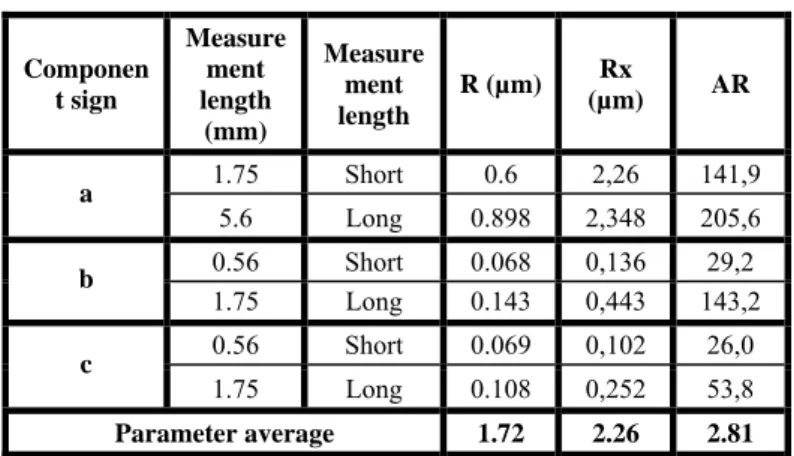
3.2 Motif Characterization
Table 5 Motif evaluation parameters
Componen t sign
Measure ment length
(mm)
Measure ment length
R (µm) Rx
(µm) AR
1.75 Short 0.6 2,26 141,9 a 5.6 Long 0.898 2,348 205,6
0.56 Short 0.068 0,136 29,2 b 1.75 Long 0.143 0,443 143,2
0.56 Short 0.069 0,102 26,0 c 1.75 Long 0.108 0,252 53,8
Parameter average 1.72 2.26 2.81
It is interesting to observe that in the Motif evaluation, maximum motif roughness values (Rx) nearly entirely correspond to the maximum roughness indices of unfiltered profile parameters (Pt). As regards the other indices, it can be observed that there are 1.5 to 3-fold value differences between the figures of the two measurement lengths, which are lower than the discrepancies in filtered profile parameters, but graeter than the differences in unfiltered parameters P. Therefore, motif-based ’filtering’ affects results to a greater extent than unfiltered evaluation does; moreover, this procedure is also sensitive to measurement length. It should be noted that parameters A and B to define motifs were identical in each measurement.
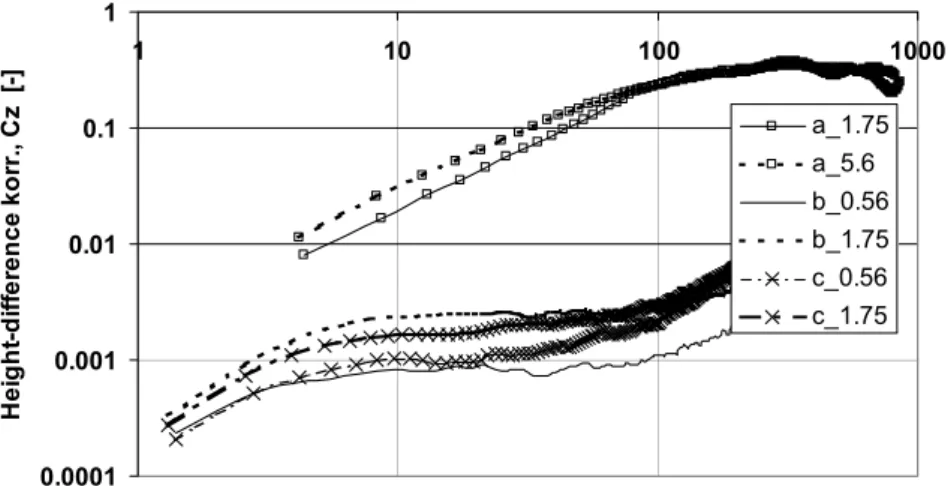
3.3 Height-difference Correlation Function
Height-difference correlation functions were also studied in case of the three different test pieces already presented in the previous chapters. Due to the extra- fine surfaces of the carburettor nozzle and the fuel feeder test pieces, the breakpoint of the curve only came about after 3 to 4 calculated points, which made it difficult to calculate the matching line. This made it particularly uncertain to specify the fractal dimension (D), therefore these results are not published.
0.0001 0.001 0.01 0.1 1
1 10 100 1000
Wavelenght, λ [μm]
Height-difference korr., Cz [-]
a_1.75 a_5.6 b_0.56 b_1.75 c_0.56 c_1.75
Figure 3
Height-difference correlation functions of 2D measured profiles
Figure 3 shows the HDCF curves, while Table 6 shows the correlation lengths to be read from each curve. It can be observed that the run-offs of the curve pairs pertaining to the two evaluation lengths of each surface are similar. In case of the turbo loading blade (a) correlation length also show good agreement, while in case of the other two components the difference is more significant, particularly as regards factor ξ⊥.
Table 6
Parameters to be read from Figure 3 workpiece Measurement length
[mm]
ξ⊥ [μm]
ξII
[μm]
1.75 0.565 117 a)
5.6 0.574 108 0.56 0.028 9,7 b)
1.75 0.049 7,8 0.56 0.031 8,33 c)
1.75 0.041 5,21
Parameter average [-] 1.356 0.784
The lowermost line in Table 6 shows the average of the ratio of corresponding value pairs. So, it can be generally stated that the dissimilar measurement lengths produced from identical surfaces present 30 to 40% differences in case of height- difference corrrelation, a technique not applying filtering, which discrepancy can be explained by surface inhomogeneity, on the one hand, and different measurement lengths, on the other hand. Assuming that the surface is
homogeneous, the difference arising from dissimilar measurement lengths can result in up to 50% discrepancy on the basis of the tests above.
Conclusions
In summary, it can be stated that the parameter-based evaluation system is very sensitive to the measurement length and the filter set. Differences between standard measurements performed at various measurement lengths can reach or even exceed 200 to 300% in case of some parameters.
In case of the parameters of unfiltered profiles, motif-based evaluation, and height-difference correlation, lesser differences of 50 to 100% arise for the different measurement lengths.
Further tests are required to find out whether the difference to be observed is characteristic of the surface in case of the same component or a consequence of the measurement length difference.
Contradictory parameter values were detected mostly at nominal roughness values near or at the borderline of a range of the filtering technology table. So it would be expedient to formulate extended rules for such limit values. These conditions can be based on unfiltered profile parameters or even on the characteristic parameters of the height-difference correlation function.
It can also be established that the differences detected are the smallest in the case of profile direction parameters.
Acknowledgements
The present study was supported by the OTKA T 043151 research program.
References
[1] Tom R. Thomas: Rough Surface, Imperial Collage Press, London (1998) [2] ISO 4288-1996
[3] Horváth, S., Czifra, Á.: The Importance of Waviness in Study of Microtopography of Cutting Surface, DMC 2005, The 5th International Scientific Conference, Development of Metal Cutting, Kosice, Slovakia, September 12-13, 2005, pp. H 1-4
[4] Thomas, T. R, Rosén, B. G.: Determination of the Sampling Interval for Rough Contact Mechanics, Tribology International 33, pp. 601-610 (2000) [5] Farkas, G., Czifra, Á.; Palásti K., B. Horváth, S.: Műszaki felületek
mikrogeometriai vizsgálatában alkalmazott 2D-s és 3D-s paraméterek összevetése, információtartalmuk elemzése, Gép, 2005/2-3, pp. 51-59 [6] Kovács K., Palásti Kovács B.: Műszaki felületek mikro-topográfiájának
jellemzése háromdimenziós paraméterekkel. I. A háromdimenziós
topográfiai paraméterek áttekintése. Gépgyártástechnológia, 1999/8, pp. 19- 24
[7] Horváth, S.: Forgácsolt felületek hullámosságának vizsgálata, Doktori értekezés, Budapest, 1990
[8] Klüppel, M., Müller, A., Le Gal, A., Heinrich, G.: Dynamic Contac Of Tires with Road Tracks, Meeting of the Rubber Division, American Chemical Society, San Francisco, April 28-30, 2003