On-Board Diagnostic-based Positioning as an Additional Information Source of Driver Assistant Systems
Tibor Busznyák
1, Gergő Pálfi
2, István Lakatos
31 Széchenyi István University, Egyetem tér 1, H-9026 Győr, Hungary busznyak.tibor@sze.hu
2 Vehicle Engineering MSc, Egyetem tér 1, H-9026 Győr, Hungary drlakatosi@ga.sze.hu
3 Széchenyi István UniversityEgyetem tér 1, H-9026 Győr, Hungary lakatos@sze.hu
Abstract: Nowadays the role of driver assistant systems is becoming more and more pertinent in the vehicle industry. The increasing automation level presents opportunity to involve the driver in any kind of network such as network among vehicles (V2X) and into vehicle and infrastructure connections. The essence of automation in case of the vehicle industry is to facilitate for the vehicle to provide services based on multi-information sources to help the driver because in modern transport systems the most cardinal criteria are environment friendly, plannable, cost efficient and safety travel. Thus, the stability of data transport plays the key role in case of connected vehicles. The following sections will present an opportunity in a detailed way to determine the vehicle’s position relying on the vehicle’s On-Board Diagnostic system based on the developed algorithm and will show how this method can help the driver assistant system’s reliable operation as well.
Keywords: vehicle; RTK-GPS; OBD; satellite; V2X
1 Introduction
Innovation can be chosen for the password of the 21st Century vehicle industry.
Increasingly severe environmental standards, safety and traffic optimization criteria encourage the automotive industry to devise more and more complex solutions.
Smart city conceptions have come to the forefront, the importance of sustainable traffic has become fundamental. Online communication systems, consumption optimization, autonomous transportation systems and transport conceptions realization are very complex and challenging tasks, which require cooperation
from more sectors such as the infocommunication industry, urban development and automotive industry [11] [12] [13]. Communication flow among the components of traffic determines the basics of automated transport [16] [17] [18].
Based on these facts it can be seen the stability of traffic data has a key-role in this complex system.
As the quality of the data is determined by the content of the information, there is a growing demand for the components involved in the transport as well. The essence of automation is that the vehicle (along with the service infrastructure) can provide a quality service based on the multiple information sources, as nowadays the main priorities are environmentally conscious, planned and safe travel.
The current traffic trend in our world is determined by the growing number of vehicles. Huge traffic can be expected near peak times in big cities. In this case, the spaces become narrower for the driver and the roads become more and more crowded. These conditions also test the drivers, as their proper handling requires a lot of routine and concentration. Driving assistant systems offer a great and effective solution to this [5] [8]. Automation provides the opportunity to involve the vehicle in a network to implement a vehicle-to-infrastructure (V2X-Vehicle to Everything) connection [9] [10].
The network brings together all the vehicles that are involved in this way of transport, providing information on the routes to be crawled, thus congestion and accidents are avoidable. Setting up such a system can greatly contribute to secure, predictable traffic. Vehicle-to-Everything (V2X) refers to the connection between the vehicle and its surrounding units. The surrounding infrastructure in collaboration with the Intelligent Transportation System (ITS) can create more optimally operating traffic [7].
Therefore, mapping potential databases that can provide information as the basis for these systems is an important task.
2 Concerning GPS, the First Basic System
GPS (Global Positioning System or american satellite system), or GNSS (Global Navigational Satellite System) based positioning is a central question of today. It is a world wide global source of information. Developments, new horizons, new possibilities are known, from military uses to weather forecasts [4]. All regions are building their own satellite systems, adding together the different systems, thus resulting in GNSS services [6]. Advanced satellite systems:
GPS – USA,
GLONASS – Russian,
Galileo – EU,
Beidou – Chinese.
We have to mention the QZSS (Quasi-Zenith Satellite System) from Japan and the Indian IRNSS (Indian Regional Navigation Satellite System) system as well. In Hungary, both of the latest are rare or not available. The most advanced is the American satellite system. In Hungary, the American and the Russian systems are frequented. For visibility, an observer point in Győr, Hungary:
Latitude: N 47°41’2”; Longitude: E 17°38’6”
Figure 1
Sky plot of different satellite systems, observer point: Győr, Hungary (source: www.gnssplanningonline.com, opened: 2019.03.17)
Figure 1 shows the availability of the different satellite systems. Observer point is in the city of Győr, Hungary. QZSS and IRNSS systems are not or rarely available, J02 is on the first qadrant sector with the only one member of QZSS.
The IRNSS satellites are downside of the second quadrant sector assuming the specific ’form 8’. Online planning of the survey is very helpful. We can estimate the best interval for measurement. The boundary conditions of our survey will be presented later, including requirements of the number of satellites.
3 RTK – Real Time Kinematic Survey
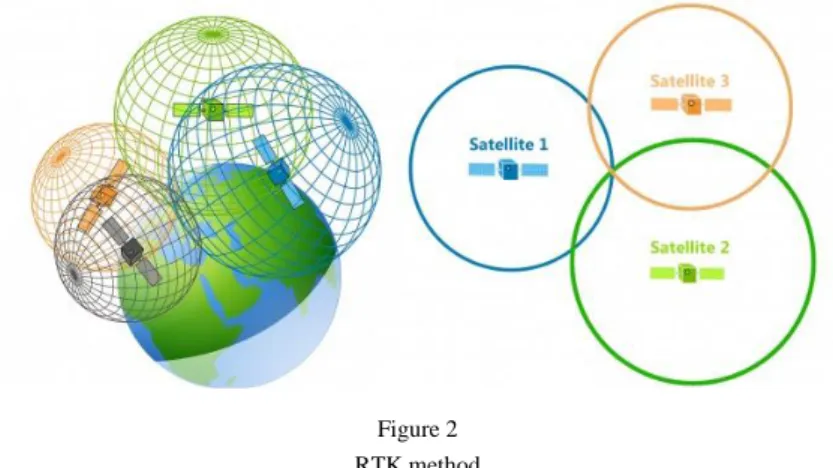
RTK is a positioning method. It provides geodesic accuracy geographic points not just with fix point surveys, but with continuous topographic survey too. During the survey moving is possible. Geodesic accuracy is 3-4 cm horizontal, 5-6 cm vertical precision. RTK survey needs 5 satellites access at the same time, and connection with the base. Base is a pre-recorded point, it helps increase accuracy during survey Figure 2 shows the constellation of satellites. It was mounted on an atomic clock. Its delay is 1 secundum in 300 000-3 000 000 year. It depends on its regulation. In this case it is possible to measure time accurately. The satellite now has an accurate time stamp, communicates with the observer on Earth. This observer has a time stamp too and the difference between the two states gives the parameter ’elapsed time’. In a given medium, radio wave velocity is known, 300.000 km/s. The covered distance can be calculated. This is the radius of the sphere around the given satellite. 2 satellites and their spheres define a circle.
Cutting a circle with another sphere gives 2 points, two further satellites increase the accuracy of the survey. To sum it all up, the RTK method works with 5 different satellites, and correction data from the base.
Figure 2 RTK method
(source: https://gisgeography.com/trilateration-triangulation-gps/, opened: 2019.03.17.) Possible use of navigation and RTK method is very varied, for example drone control systems. These ’non piloted’ or unmanned aerial vehicles (UAV) are qualified to detect non or hardly accessible surfaces and for aerial photoshooting using GPS navigation signals [14]. It is highly frequented in remote sensing and photogrammetry, in agricultural sciences for example vegetable covering of a given territory [3] [21]. NDVI, normalised difference vegetable index supplemented by RTK signal make it possible to analyze agronomic measurements [15]. RTK is capable of being used in the case of industrial facilities or monuments analyzis [19].
4 Foundation of OBD-based Positioning
There are several ways to get the databases, depending on whether you start from the vehicle or from the infrastructure. If a vehicle is almost always within an intelligent infrastructure, the number and complexity of the in-built systems can be greatly reduced as the information is provided by the surrounding infrastructure instead of the vehicle’s sensors. This is best suited for vehicles that travel on specific road sections or areas, such as public transport units. It is easier to build the infrastructure around these vehicles mostly because of the predefined routes.
On the other hand, we consider the vehicle as an independent unit. Without infrastructure, relying on vehicle’s sensors and sensor systems the vehicle can move virtually anywhere without the need for a deployed ITS server. The idea of simplifying the vehicle's own sensor system to rely on the OBD (On-Board Diagnostics) arises - which is basically a part of the vehicle - to perform auxiliary system tasks closely related to ITS.
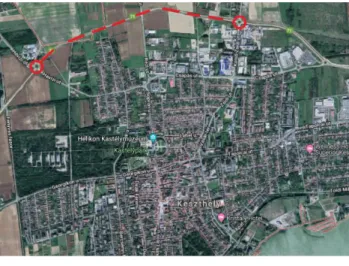
Figure 3 Route of the survey
(source of the original map: www.googlemaps.com)
Experiments - carried out in previous years [1] [2] - resulted in the mapping of digital tools that can be used in the investigation of the vehicle from the V2X point of view, focusing on the issue of fuel consumption. Figure 3 shows the map of the survey [20].
A method for defining the relationship between the fuel consumption (airflow rate) provided by the OBD system and the terrain produced by the RTK-GPS was successfully identified.
Figure 4
Real RTK elevation and modelled elevation trends
The determination coefficients given by the statistical analyzes at 3 different constant speeds are shown in the Table 1. It presents determination coefficients to describe the correlation between fuel consumption in case of different constant speeds and the elevation.
Table 1
Determination of coefficients at 3 different, standard speeds
Velocity [km/h] Determination of coefficient
30 0,9549
40 0,9160
50 0,8370
Figure 5
Connection between the measured elevation with RTK GPS and the fuel consumption provided by the vehicles OBD system in case of 30 km/h constant speed
These data show that we can deduce the fuel consumption of the vehicle on the basis of the known elevation conditions at high confederation levels (see Figure 4 and Figure 5).
5 Shortcomings of the High Precision GPS Infrastructure
Nowadays some automated vehicle functions use GPS based services. There are several shortcomings of the high precision GPS measurements in real traffic situations. A boundary condition system for GPS survey can be set up:
Adequate number of GNSS satellites;
Ensuring seamless connection with GNSS satellites;
Base station providing clarification data;
Ensure a seamless connection with a base station.
We can eliminate a high security risk if we can replace GPS with other alternatives. Such alternatives may be the combined use of the altitude database of routes and the availability of OBD data which is available for each vehicle individually to replace online connections.
6 Concept for Positioning Information Provided by On-Board Diagnostics
The close correlation between the above-mentioned relief and fuel consumption is based on the thought that the actual position of the vehicle can be determined based on the available reference database (altitude database of the route to be crawled) and fuel consumption data provided by On-Board diagnostics. The foundation of it is the monitoring of fuel consumption based on OBD data, a pre- measured and scaled database of the road section to be traversed by the vehicle and an algorithm that establishes a relationship between height coordinates and vehicle fuel consumption. The developed algorithm establishes a link between the elevation data points (MAP) and the OBD’s output fuel consumption data points (Fig. 6), with its help the fuel consumption data point sampled from the current OBD can be retrieved on the reference database.
Figure 6
The matching of the two independent databases – fuel consumption based on the incoming OBD data and the altitude database measured by the GPS
As the first step, the algorithm examines the sampling of the fuel consumption data point from the OBD (n). These data points are compared by the algorithm with the reference database (MAPj).
The LS matrix includes square differences between fuel consumption sampled from OBD and MAP database data. The first element of the LS matrix summarizes the square deviations of fuel consumption data and reference data from the OBD based on the available OBD data points (4).
The LS matrices other than the first rows continue to examine the currently available OBD data points but extend the investigation to all available elements of the map database (4) by increasing the map database index with one from row to row in the LS matrix until the maximal index of the map database data is reached in the LS matrix’s rows.
From the calculated squared deviations minimal value (contained by the LS matrix) is searched in case of each OBD data points. This minimal value will be contained by the S matrix (5). Selecting the minimum value and its location from the LS matrix (i.e. the row of the LS matrix containing the minimum value) and fixing the index of this row we can determine where the sum of the square deviations was the smallest from which the highest index value used in the map database (MAP) during the current calculation can be retrieved.
This value will coincide with the value of the instantaneous consumption data, so the altitude for the current consumption can be selected on the map. Height data have X and Y coordinates from the map database, thus the investigation can be extended to three dimensions.
When the available fuel consumption associated with the maximal MAP database index is reached, the OBD database (n) increasing is resulted.
𝑂𝐵𝐷 = (𝑂𝐵𝐷1
⋮ 𝑂𝐵𝐷𝑛
) (1)
𝑀𝐴𝑃 = ( 𝑀𝐴𝑃1
⋮ 𝑀𝐴𝑃𝑗
) (2)
𝐿𝑆𝑁𝑛= (𝐿𝑆1𝑛
⋮
𝐿𝑆𝑁𝑛) (3)
( 𝐿𝑠1
⋮ 𝐿𝑠𝑁
) = {
∑𝑛𝑖=1(𝑂𝐵𝐷𝑖− 𝑀𝐴𝑃𝑗)2
𝐽=1 , 𝐼𝑓 𝑁 = 1
∑𝑛 𝑖=1 (𝑂𝐵𝐷𝑖− 𝑀𝐴𝑃𝑗)2, 𝐼𝑓
𝑗=𝑖−1+𝑁 𝑁 ≠ 1} (4)
Where:
OBDi = The ’i.’ sampled OBD data point;
MAPj = The ’j.’ element of reference database;
n = NUmber of OBD data points sampled to the actual time;
LS = Matrix of the sum of the squared deviations;
LSN = Current row number of the LS column matrix;
N = Counts rows of the LS matrix.
𝑆 = 𝐿𝑆𝑁|𝑚𝑖𝑛 (5)
Where:
S = Minimum of the sum of the squared deviations.
7 Test Environment of the Developed Algorithm
For the test of the developed algorithm a Matlab program was created (Figure 7).
During the test of the algorithm and the evaluation of the measurement data we considered the data point in case of 30 km/h constant speed - measured by RTK GPS - as the reference database. Due to the low sampling frequency of the OBD data logger device in case of 40 and 50 km/h constant speed measurement less fuel consumption data are available than in case of the reference database. Thus, linear interpolation can be used in case of this higher speed measurements to extend the interval of the fuel consumption.
Based on the investigations beside 30 km/h the sum of stored square differences data from the LS matrix with selecting the least value in the data series the biggest index of the connected reference database can be selected. With this selected index from the reference database the actual position of the vehicle can be determined. Based on the selected indexes the convergence curve can be presented (Figure 8).
In case of the 30 km/h constant speed measurement from the 5th datapoint of the fuel consumption data coming from the vehicle’s OBD system begins to converge the data to the indexes of the reference map database indexes, thus from the 5th point of the fuel consumption the vehicle’s position is definable.
Based on the first incoming OBD consumption data, the algorithm is activated.
The above mentioned least squares method determines which of the points in the map database is the one that best matches the given consumption data. It has been previously determined that the correlation between fuel consumption and altitude change is higher than 95% in case of 30 km /h constant speed. However, as shown in Figure 9, based on the first (OBD data 1) consumption data, the algorithm is not
Figure 7
Flow chart of the developed algorithm
Figure 8
Convergence curve of the found data point indexes
Figure 9
Identification of the first consumption data
During the operation of the algorithm consumption data arrive in time series. The recorded data follow each other at fixed intervals.
When analyzing multiple points, the algorithm steps over the map database.
Suppose that we try to estimate the position based on 3 received consumption data. In this case, the algorithm overlaps the map database this means that we create data blocks with 3 points. From the 1, 2, and 3 consumption data for the first time the 1, 2 and 3 map data are analyzed after the 2, 3 and 4 data points and so on. Figure 10 shows that the estimated point is not yet good after 3 consumption data points.
Figure 10
Identification of the third consumption data
Figure 11
Identification of the fourth consumption data
Estimation based on the fourth incoming OBD consumption data brings the first adequate result. The algorithm then places the point to the beginning of the cycle to the point 4 of the map, as illustrated on Figure 11.
The algorithm then works smoothly. Building on each other guarantees the stability of the process. Since there is more data in the analysis in each iteration it
is constantly built up and does not ignore the points that have already been identified. This is the result of the continuously overlapping method with the given number of data in the reference database (Figure 12).
Figure 12
Illustration of the working of the algorithm with several points
This method allows us to decide where the vehicle is located on the map database based on 4 incoming OBD data in case of 30 km/h constant speed. The above shown problems with the high precision RTK - GPS measurement can be eliminated by using predefined map databases as a reference.
It is not necessary to get GPS signal from the vehicle in all times or the communication with the server (AGPS - Assisted GPS) as the OBD data source may be capable to supplement the local information gap on the basis of the presented principles. This method is able to replace and help the positioning GPS component at an appropriate level.
8 Possible Extension to Electric Vehicles
Feasibility of the measurement and compliance of the map data base and the power consumption of the electric motor should be investigated in case of electric vehicles as well.
The main concept in case of electric vehicle’s measurement is to measure the power consumption of the electric motor. This data can be available via the on board diagnostic system of the electric vehicle.
Previous studies were done with special regard to the electric vehicles power consumption measurement in city driving and in freeway driving. The investigations have revealed that the grade of the road has a significant impact on the electric vehicle’s consumption [22].
If the power consumption data from the electric vehicle’s OBD system and the map database are available, the statistical analyses can be done and the coefficient of determination is definable.
From the elevation database the rising resistance can be predictable and optimal operating status of self-driving vehicle can be adjustable in case of vehicles with internal combustion engines and electric vehicles as well. Hence, the fuel and power consumption and the emission can be reduced. The rising resistance can be calculated from the previously measured road database and the optimal road can be chosen with the algorithm developed for this purpose.
This algorithm can also take into consideration the length of the roads, the permitted speeds and calculates the available optimal operating states of the vehicle in the chosen road which leads to energy saving and contributes to reducing the environment pollution.
Conclusions
In this article we have shown a method to define vehicle position without constant GPS connection.
We carried out measurements with 30 km/h constant speed in order to have the reference road database. During the measurements the fuel consumption and the vertical displacement were recorded the former from the vehicle’s OBD system the latter based on the RTK GPS measurement system. According to our measurement the determination of coefficient value is 95,49% in case of 30 km/h constant speed.
We have found that the vehicle’s position can be determined from the fuel consumption and the available map database, which database contains the vertical displacement (R2 = 0,9549).
We presented an algorithm which investigates and compares the input data (fuel consumption) from the OBD system with the available reference database, so the position of the vehicle can be defined with it. The developed algorithm investigates the sum of the square differences of the fuel consumption and the available map data and selects the smallest value from it. The smallest value from the calculations and the associated maximal index of the MAP database results the actual position of the vehicle.
The algorithm was implemented into Matlab environment and the results show that the position of the vehicle can be determined exactly after 4 datapoints of fuel consumption, these four datapoints mean an interval of 10-15 seconds.
The result of this algorithm development constructs the basics of vehicle positioning without GPS, which can be very useful part of the Intelligent Transportation System if the proper GPS coverage is not existent and when keeping functionality and safety are the main priority.
Possible steps for further methods:
Development opportunity in this topic is the mapping without RTK-GPS such as 3-axis accelerometer;
The presented algorithm can be extended to 40 and 50 km/h standard speeds;
Evaluation can be done at various speeds and various routes as well;
Investigation of the application fields of the developed algorithm for driver assistant systems with the special regarding of the predictive cruise control systems;
Analyzis of electric vehicles.
Acknowledgement
The research presented in this paper was carried out as part of the EFOP-3.6.2-16- 2017-00016 project in the framework of the New Széchenyi Plan. The completion of this project is funded by the European Union and co-financed by the European Social Fund.
References
[1] Busznyák, T., Lakatos, I. (2017) “Automotive Engineering possibilities in combining Global Postioning and Vehicle Diagnostic” 5th International Scientific Conference on Advances in Mechanical Engineering (ISCAME 2017), University of Debrecen Faculty of Engineering, pp. 84-89, ISBN 978-963-473-304-1
[2] Busznyák, T., Lakatos, I. (2018) “Digitális eszközrendszerek a gépjárművekben, mint az autonomizálódó közlekedés fejlesztésének információforrásai” IFFK 2018: XII. Innováció és fenntartható felszíni közlekedés, 2018.08.29-2018.08.31, Budapest, Hungary, MMA, Paper: 13, ISBN 978-963-88875-3-5
[3] Colomina, I., Molina, P. (2014) “Unmanned aerial systems for photogrammetry and remote sensing: A review” ISPRS Journal of Photogrammetry and Remote Sensing, Volume 92, pp. 79-97, doi: https://doi.org/10.1016/j.isprsjprs.2014.02.013
[4] Dabove, P., Manzino, M. M., Gogoi, N. (2018) “Assessment of positioning performances in Italy from GPS, BDS and GLONASS constellations”
Geodesy and Geodynamics, Volume 9, Issue 6, pp. 439-448, doi: https://doi.org/10.1016/j.geog.2018.06.009
[5] Derbel, O.; Peter, T.; Zebiri, H.; Mourllion, B.; Basset, M. (2013) Modified intelligent driver model for driver safety and traffic stability improvement IFAC Proceedings Volumes 46(21): 744-749, https://doi.org/10.3182/20130904-4-JP-2042.00132
[6] Han, H., Wang, J., Du, M. (2017) “GPS/BDS/INS tightly coupled integration accuracy improvement using an improved adaptive interacting multiple model with classified measurement update” Chinese Journal of Aeronautics, Volume 30, Issue 3, pp. 556-566, doi: https://doi.org/10.1016/j.cja.2017.12.011
[7] Iordanopoulos, P., Mitsakis, E. and Chalkiadakis, C. (2018) “Prerequisites for Further Deploying ITS Systems: The Case of Greece”
Periodica Polytechnica Transportation Engineering, 46(2), pp. 108-115, doi: https://doi.org/10.3311/PPtr.11174.
[8] Omae, M., Fujioka, T., Hashimoto, N., Shimizu, H. (2006) “The application of RTK-GPS and Steer-by-wire technology to the automatic of vehicles and an evaluation driver behavior” IATSS Research, Volume 30, Issue 2, pp. 29-38, doi: https://doi.org/10.1016/S0386-1112(14)60167-9 [9] Péter, T., Bokor, J. (2010.2) “Modeling road traffic networks for control”
Annual international conference on network technologies communications:
NTC 2010. Thaiföld, 2010.11.30-2010.11.30. pp. 18-22, Paper 21, ISBN:978-981-08-7654-8
[10] Péter, T., Bokor, J. (2011) “New road traffic networks models for control”
GSTF International Journal on Computing, Vol. 1, Number 2, pp. 227-232, DOI: 10.5176_2010-2283_1.2.65 February 2011
[11] Pokorádi, L. (2018) “Graph model-based analysis of technical systems”
IOP CONFERENCE SERIES: MATERIALS SCIENCE AND ENGINEERING 393: 1, Paper: 012007, 8 p.
[12] Pokorádi, L. (2018) “Methodology of Advanced Graph Model-based Vehicle Systems Analysis” In: Szakál, Anikó (szerk.) IEEE 18th International Symposium on Computational Intelligence and Informatics (CINTI 2018) Budapest, IEEE Hungary Section (2018) pp. 325-328, 4 p.
[13] Pokorádi, L., Lázár-Fülep, T. (2017) “Jármű-irányítási rendszerek megbízhatósági és kockázatelemzési modellezése – Egy kutatási projekt beharangozója” In: Péter, Tamás (szerk.) IFFK 2017: XI. Innováció és fenntartható felszíni közlekedés Budapest, Magyarország:
Magyar Mérnökakadémia (MMA) (2017) pp. 181-186, 6 p.
[14] Rabah, M., Basiouny, M., Ghanem, E., Elhadary, A. (2018) “Using RTK and VRS in direct geo-referencing of the UAV imagery” NRIAG Journal of Astronomy and Geophysics, Volume 7, Issoue 2, pp. 220-226, doi: https://doi.org/10.1016/j.nrjag.2018.05.003
[15] Ramli, M., F., Aburas, M., M., Abdullah, S., H., Ash’aari, Z., H. (2015)
“Measuring Land Cover Change in Seremban, Malaysia Using NDVI Index” Procedia Enviromental Sciences, Volume 30, pp. 238-243, doi: https://doi.org/10.1016/j.proenv.2015.10.043
[16] Rudas, I., J., Haidegger, T., Takács, Á., Drexler, D., A., Galambos, P.
(2018) “Assessment and Standardization of Autonomous Vehicles” 2018 IEEE 22nd International Conference on Intelligent Engineering Systems (INES) 21-23 June, Las Palmas de Gran Canaria, Spain, pp. 185-192, ISSN: 1543-9259, DOI: 10.1109/INES.2018.8523899
[17] Rudas, I., J., Horváth, L. (2018) “Information Content Driven Model for Virtual Engineering Space” ACTA POLYTECHNICA HUNGARICA 15: 2, pp. 7-32, 26 p.
[18] Rudas, I., J., Haidegger, T., Takacs, Á., Bosl D., (2018) “Highly Automated Vehicles and Self-Driving Cars” IEEE ROBOTICS & AUTOMATION MAGAZINE 25: 4, pp. 106-112, 7 p.
[19] Tapete, D., Morelli, S., Fanti, R., Casagli, N. (2015) “Localising deformation along the elevation of linear structures: An experiment with space-borne InSAR and RTK GPS on the Roman Aqueducts in Rome, Italy”, Applied Geography, 58, pp. 65-83, doi:
https://doi.org/10.1016/j.apgeog.2015.01.009
[20] Xia, J., Sun, Q., Foster, J., Falkmer, T., Lee, H. (2017) „Pursuing Precise Vehicle Movement Trajectory in Urban Residential Area Using Multi- GNSS RTK Tracking” Transportation Research Procedia, Volume 25, pp. 2356-2372, doi: https://doi.org/10.1016/j.trpro.2017.05.255
[21] Xu, H. (2012) ”Application of GPS-RTK Technology in the Land Change Survey” Procedia Engineering, 29, pp. 3454-3459, doi: https://doi.org/10.1016/j.proeng.2012.01.511
[22] Wu, X., Freese, D., Cabrera, A., Kitch, W., A. (2015) „Electric vehicles’
energy consumption and estimation” Transportation Research Part D 34, pp. 52-67, doi: https://doi.org/10.1016/j.trd.2014.10.007