Medical Tourism - A Case Study for the USA and India, Germany and Hungary
Marc Piazolo
Professor of Economics
University of Applied Sciences Kaiserslautern Graduate School of Management
Zweibrücken, Germany marc.piazolo@fh-kl.de
Nurşen Albayrak Zanca
Associate Professor of Economics University of the Incarnate Word H-E-B School of Business San Antonio, Texas, USA zanca@uiwtx.edu
Abstract: The objective of this paper is to demonstrate a simple Ricardian model of international trade for health care industries of different countries. Our motivation is to illustrate that specialization and free trade result in gains from international trade. We will shed some light on the economics of outbound as well as inbound medical tourism. By adopting the model of comparative advantage to the costs of medical surgeries, we will show that trade between our two model countries – India and the USA – is beneficial to both of them. We focused on these two countries due to their prominence in worldwide medical tourism flows, as well as due to their significant difference in per capita income.
By specializing on the type of surgery they are most efficient in producing, it will enhance the well being of both nations. Numerical examples and graphical presentations help to support our arguments. Beside the global aspect of medical tourism, we also want to shed some light into regional patient flows with a focus on Germany and Hungary. In addition, we will lift some of the more restrictive assumptions. By including transportation costs as well as a larger variety of surgical services, the central message of the beneficial effect of specialization still remains, even though the general picture becomes slightly blurred.
There is evidence for support of a more multi-polar international system of trade in medical services the moment one extends the economic analysis with additional countries.
Keywords: Regional and global scope of medical tourism; Ricardian trade model;
comparative advantage; economic gains from international trade
Introduction
1With general tourism on the rise (UNWTO 2010), it is estimated that the volume of medical tourists could reach 4 million per annum by 2012 (Deloitte 2008a).
Medical tourism has become a major force for the growth of service exports worldwide, while concentrating on a selective number of recipient countries – with India and Thailand as major global markets. At the same time, medical tourism offers a financial valve for the growing burden of health care costs in mature markets like the USA. In addition, it provides an alternative for the almost 50 million uninsured adults of the USA to receive affordable and accessible medical services.2 Even though the 2010 health care reform will cover 34 million uninsured Americans by 2019,3 the driving force of the outbound medical tourism will continue to be costs. For surgical services in South Asia these costs are between 10 and 20 percent of the corresponding ones in the USA (Unti 2009). At the same time, hospitals in developed countries like Belgium, Germany and the USA are trying to attract inbound medical tourists by offering special and high quality services (Vequist / Valdez 2009). General trends in global medical tourism are briefly discussed in Section 1.
With the help of the traditional Ricardian model of international trade4, we will shed some light on the economics of outbound as well as inbound medical tourism in Section 2. By adopting the basic model of comparative advantage to the costs of medical surgeries, we will show that trade between our two model countries – India and the USA – is beneficial to both of them. We focused on these two countries due to their prominence in worldwide medical tourism flows, as well as due to their significant difference in per capita income. By specializing in the type of surgery they are most efficient in producing, it will enhance the well being of both nations. Numerical examples and graphical presentations on dental services and medical operations help to support our arguments. In Section 3, we will lift some of the more restrictive assumptions. By including transportation costs as well as a variation in medical expenditure patterns, the central message of the beneficial effect of specialization still remains, even though the general picture becomes slightly blurred. With an additional focus on Germany and Hungary in Section 4, we want to shed some light onto regional patient flows as a substantial part of medical tourism is more of regional than of global nature. In the final section, we show that there is evidence for support of a more multi-polar international system of trade in medical services.
1 This article is a substantial extension of work that we presented at the 8th International Conference on Management, Enterprise and Benchmarking in Budapest (Piazolo / Zanca 2010). We incorporated some of the valuable comments of the conference participants.
2 CBO 2010; Senate 2006 and Collins et. al 2008. In 2008, 46.3 million Americans representing 15.5% of the population were uninsured (DeNavas-Walt et al. 2009 Tabl. 7).
3 Joint estimates of the Congressional Budget Office and the Joint Committee on Taxation on the effects of the US health reform bill (CBO 2010 Table 4).
4 e.g. in Krugman / Wells 2009 or Mankiw 2009
1 General Trends in Medical Tourism
Historically, patients of developing countries often journeyed from less developed countries to medical centres in more developed countries, where they received services that were not available in their countries of origin - as medical know-how and technology were missing.5 As technology and medical know-how dissolved to emerging market countries, a new model of medical tourism – from rich to poor countries – evolved over the last two decades. Rich country tourists started to exploit the possibility of combining tourist aspects with medical ones. Today, one finds modern hospital facilities close to major tourist attractions in countries like India, Hungary, South Africa, Thailand and Turkey. Hospitals – and even dental clinics - look more like first class hotels, and they actively promote tourist packages with their medical services.6 Therefore, medical tourism is increasing in part with the growth trend of general tourism: worldwide international tourist arrivals grew annually at an average of 4% between 1996 and 2008. Due to the recent recession as well as uncertainties brought about by the influenza outbreak, tourism took a dip in 2009 by -4.2%. During the first six months of 2010, world tourism flows picked up again (+6.9% vs. a year before). 7 Should the economic recovery dampen in 2011, then the revival of tourism flows might not be that substantial. Nevertheless, the worldwide recession may have led USA insurance companies and employers to re-evaluate how to lower ever rising healthcare costs.8 Not only is the US health-care system by far the most expensive in the world – USA health spending runs at 16.2% of GDP, far above the OECD average of 9% (2007), its quality does not compare well with other OECD countries.9 Medical tourism might be one way to improve services while at the same time help to dampen the rise in overall spending on health care. Unfortunately, data on
5 See Unti (2009) 18. e.g. wealthy individuals travelled abroad to seek spas, mineral baths, innovative therapies in fairer climates in Europe.
6 E.g. Thailand: Bumrungrad (www.bumrungrad.com); India: Apollo Hospital in Kolkata (www.apollogleneagles.in); Hungary: Diamant-Dent Dental Medical Institute (www.diamantdent.hu); South Africa: individual doctors (www.surgeon-and- safari.co.za).
7 UNWTO (2010) p. 3. While tourism inflows to Central/Eastern Europe declined by more than 10% in 2009, Hungary experienced a growth of almost 3%. Only in the 1st quarter of 2010 has there been a decrease in the number of inbound visitors to Hungary (KSH 2010 p. 1).
8 Edelheit (2009) p. 2. From 1960-2006, only in six years – four of them during the Clinton boom - did GDP growth actually exceed health care spending growth. In addition, health care cost inflation exceeded core inflation in each and every year over the last 50 years (McKinsey 2008 p. 37).
9 e.g. infant mortality or death rate after haemorrhagic strokes (Economist 2008). Also, the USA spends $7, 300 per person (in Purchasing-Power Parity), more than twice as much as the average of the OECD countries (OECD Health Data 2009 in: Economist 2009 p.
27). Even when adjusting for its relative wealth, the USA spends a lot more on health care than can be expected (OECD in: McKinsey 2008 p. 36).
medical tourist flows are poor. Therefore, one has to rely on surveys to estimate the flows as well as the economic might of the medical tourism industry. In 2006, worldwide business in medical tourism grossed about $60 bn. It is expected to rise to $100 bn by 2012.10 India, Malaysia, Singapore and Thailand are some of the most attractive medical tourist destinations, and medical tourism is already making a significant impact on their economies. In 2005, approximately 500,000 Americans travelled abroad for medical treatment; by 2007 this number rose to 750,000 and it is expected to increase to more than 15 million Americans annually by 2017.11 Nevertheless, there are others that are much more cautious about the actual size of the medical tourism market: focusing on the market segment of international inpatients, three McKinsey analysts estimated a world market for the 20 most important medical-travel destinations of up to 85,000 patients annually for 2007 only. In addition to their focus on patients that were actually staying in a hospital, they also subtracted substantial numbers for emergency cases and expatriates. The latter they did not consider core medical tourists.12 Even these conservative estimates are still worth looked at, as the growth potential is immense, especially if certain barriers for medical travel – like non-coverage from the country of origin market’s payers – would be lifted.
Let us briefly take a closer look at the major characteristics of international or cross-border medical tourism. When looking at the broader health care tourism industry, we differentiate between wellness tourism and medical tourism.13 The latter can then be further broken down into cosmetic surgery and elective surgery.
Our focus will be on the non-cosmetic surgeries and medical treatments. In the near past patients from less developed countries travelled to major medical centres in industrial countries. There, they looked for sophisticated, often technologically advanced services that were typically not available in their home countries. These patients were usually wealthy individuals. On the reverse you had individuals from rich countries seeking services that were either not covered by their health insurance, there were long waiting periods for specific treatments in their home country or the services were simply not available – often due to legal restrictions like organ transplants or reproductive treatments. The majority of those services were of limited medical complexity.14
10 McKinsey & Confederation of Indian Industries 2005 in: Herrick (2007) pp. 1-2. The
$60 bn (2006) of estimated medical tourism business world wide is less than 8% of total world exports in travel (Hussain / Gori 2009 p. 1).
11 Deloitte Centre for Health Solutions in: Economist (December 22, 2008).Though, these forecasts have to be taken cautiously; they seem to be inflated (authors).
12 Based on their survey data and interviews, Ehrbeck et al. (2008 pp. 2-3) actually filtered core medical travellers down to 35%-45% of all international inpatients.
13 Caballero-Danell / Mugomba (2006) p. 11
14 Unti (2009) pp. 18-19
Table 1
Unit cost for different types of medical procedures (in USD)
Type of Procedure USA Hospital* Indian Hospital* Thai Hospital***
Hip Replacement $50,000 $7,000-$9,000 $12,000-$17,300
Knee Replacement $45,000 $6,000-$8,000 $10,700-$13,200
Heart Bypass $100,000 $6,000-$9,000 $22,800-$34,300
PTCA (Angioplasty) $70,000 $4,000-$7,500 $12,200-$19,800
Spinal Fusion $75,000 $5,000-$8,000 $5,500-$7,000
Breast Augmentation
(Cosmetic) $9,000 $3,500-$5,000** $2,750
Face & Neck Lift
(Cosmetic) $11,500 $2,500-$4,000** $3,700
PTCA – Percutaneous Transluminal Coronary Angioplasty
(*) Median costs. Data retrieved from www.indushealth.com (September 14, 2010).
(**) www.medretreat.com (September 14, 2010).
(***)
Bumrungrad Hospital, www.bumrungrad.com (December 16, 2009); range of real costs between July 2008 – June 2009; package prices are usually substantially lower.
Today, the focus is more on tourists (patients) from developed countries who travel to hospitals in emerging market countries seeking sophisticated - state of the art - medical treatments at substantially lower cost. Table 1 presents typical types of procedures and their US-costs compared to the costs in attractive medical tourist destinations. Treatments in India and Thailand refer to high quality, full service and internationally accredited hospitals with physicians that were predominantly educated at respectable universities in developed countries. These hospitals often seek affiliation with a well-known USA or UK teaching hospitals to lift standards as well as reputation.15 The potential cost savings per medical treatment is up to 90% of US-costs.16 Their cost advantage is based on significantly lower fixed costs, employee wages as well as liability insurance premiums.17 To offer internationally marketable and competitive services, the hospitals must be accredited by a third party like the Joint Commission International or must comply to ISO 9000.18 Also, hospitals offer package deals for standard procedures, thereby trying to limit the risk of exploding costs for the
15 Deloitte (2008a) p. 3
16 Examples on individual patients can be found on the websites of medical tourism agencies, or e.g. in the Senate Hearing (2006) p. 2-8; Bey (2007) pp. 176-177
17 Unti (2009) p. 20; see Herrick (2007) pp. 9-12 for examples: Indian doctors earn 40%
less than USA physicians.
18 The hospitals mention the accreditation on their own websites. But one can also check the Joint Commission International for a list of their accredited hospitals (www.jointcommissioninternational.org), or the ISO International Standards Organization as well as Health Care Tourism certified hospitals (www.healthcaretrip.org).
patient.19 Since it has become a major industry, several websites of medical tourism agencies and even non-profit organizations inform potential clients and promote international travels by linking the patients to hospitals or individual physicians.20
Ehrbeck et al. (2008) p. 5 Ehrbeck et al. (2008) p. 5
Figure 1
Globalization of medical tourism flows
Figure 1 shows that the world has become a flatter place – we see an influx and outflow of medical tourists from every continent except for Africa and Oceania.
Though the recent focus in medical tourism has been on outbound patient flows from the developed countries to hospitals in the emerging markets in Asia, Europe and Latin America. The main driving force is the cost advantage, which is regularly mentioned in the recent US health reform debate as being one of the means to keep US health spending from getting out of hand. In 2006, there was
19 Medearis (2010) p. 9 mentions the significance of the proliferation of medical lawsuits driving up the cost of medical liability insurance.
20 The following are major websites of medical tourism agencies: MedRetreat in USA (www.medretreat.com) including two case studies; Healthcare Tourism International (www.healthcaretrip.org) – non-profit organization; Plant Hospitals (www.planethospital.com); IndUShealth Inc. (www.indushealth.com) – specializing on India and USA patients (also Senate 2006 37-4); Health Tourism (www.health- tourism.com) and Treatment Abroad in the UK (www.treatmentabroad.net); Hospital Scout (www.hospitalscout.com).
already a hearing in the US Senate discussing the question “Can Medical Tourism Reduce Health Care Costs?” The answer sounded like “Yes, but we just don’t know by how much” (Senate 2006). Also, Figure 1 reveals that except for Asia the dominant part of international patient flows are inter-regional. In the following chapter we will introduce a simple model on dental tourism. Later on, we can show that this section of medical tourism – for dental services – is more likely to be of regional than of global nature.21
At the same time, USA and European hospitals – especially in the UK as well as in Germany – are able to attract foreign patients for high quality and specialized care.22 These inbound medical tourists are usually private patients and therefore often provide a financially advantageous source of income; USA hospitals with dedicated international centres generate up to 10 percent of total revenue from international patients.23 So, from a USA or developed country perspective, there are inbound as well as outbound medical tourism flows. In the next section, we will present a traditional model of international trade – this time in medical services – to shed some light on the economics behind the observed tourism flows.
2 Medical Services and a Traditional Ricardian Model of International Trade
The concept of comparative advantage and gains from trade are one of the oldest ideas in economics (Buchholz 1989). The principle of comparative advantage was introduced by David Ricardo in his 1817 book ‘On the Principles of Political Economy and Taxation’, and the theory showed how nations benefit from free trade. Within the economics literature the improvement in national welfare is known as gains from trade. Ricardo (1817) argued that access to foreign markets is crucial in specialization and wealth creation. Ricardo used a simple model to show how nations maximize their material welfare by specializing in goods and services that they have the lowest relative costs of production. In this section we will demonstrate some empirical evidence for principle of comparative advantage, specialization and wealth creation concepts for medical tourism sectors in India and the USA.
21 See Turner (2008) for arguments supporting the regional nature of dental tourism.
22 Gerl et al. (2009) list some of the specialized medical clusters in Europe – either on different fields of medicine or focused on special groups of medical tourists (e.g. for Arab customers in Bonn, Germany). Also, hospitals in Southern Germany have significant cost advantages compared to their Swiss or UK competitors, thereby attracting approximately 74,000 foreign patients to Germany in 2006 (Juszczak 2007 p. 1, 4, 12)
23 App. 400,000 international patients contribute $5 bn annually to the USA economy (Deloitte Center for Health Solutions in: Quesada 2009).
Table 2 summarizes the data on costs of production for dental services in India and the USA. The USA has absolute disadvantages in both Dental Implants (DI) and Dental Crowns (DC), measured by larger costs of production. Assuming that the dental services are homogenous in quality, can trade bring net national gains to both counties? In addition, we assume that there are only two countries, no economies of scale, only two kinds of medical services, no transportation costs and no barriers to trade. Also, it is assumed that there is perfect knowledge, so that all buyers and sellers (patients and hospital management) know where the cheapest goods or the potential patients can be found internationally.
Table 2
Unit costs for dental services in India and the USA
Unit Costs India (Capacity: 32,000)* USA (Capacity: 50,000)*
Dental Implants $1,780 $2,780
Dental Crowns $400 $1,000
(*) Number of hospitals in India (3,200) and the USA (5,000 community hospitals) in 2007 - assuming ten medical treatments per hospital and day. Data was retrieved from www.medretreat.com (September 15, 2010).
Based on the number of hospitals in each country, Table 3 summarises the maximum production capacities in medical treatments per hospital and day for India and the USA. For example, India can produce 18 units of DI if it produces no DC, or 80 units of DC if it produces no DI. Similarly, the USA can produce 18 units of DI if it produces no DC, or 50 units of DC if it produces no DI.
Table 3
Maximum Output per Day for India and the USA
Maximum Output per day India (Capacity: 32,000)* USA (Capacity: 50,000)* Dental Implants 32,000 / $1,780 = 18 50,000 / $2,780 = 18 Dental Crowns 32,000 / $400 = 80 50,000 / $1,000 = 50
(*) Number of hospitals in India (3,200) and the USA (5,000) in 2007 - assuming ten medical treatments per hospital and day. Data was retrieved from www.medretreat.com September 15, 2010).
Figure 2 illustrates the production possibility frontiers (PPF) for India and the USA. It presents the potential production of DC both India and the USA must forgo to produce DI. The PPF shows the trade-offs a country faces when it chooses its combination of DI and DC. It is a straight line because the Ricardian model assumes that opportunity costs are constant. In other words, we state that the trade-off between DI and DC does not change.
Slope of the PPF = ΔDI output / ΔDC output = opportunity cost of DC Slope of PPF in (USA) = -0.36 (opportunity cost of DC in the USA) Slope of PPF in (India) = -0.225 (opportunity cost of DC in India)
If the USA does not trade, it gives up 0.36 units of DC for an additional unit of DI.
This trade-off is called the relative price of DC or the opportunity cost of DC. The term relative price follows from the fact that it is not in monetary units, but rather in units of the other good, that is DI. By the same reasoning, 0.225 units of DC is the relative cost (opportunity cost) of one unit of DI in India. David Ricardo (1817) argued that one country has a comparative advantage in producing a good or a service if the opportunity cost of producing that good or service is less for the one country than for the other country (or countries). The data of Table 3 indicates that India has a comparative advantage in producing DC. At same instance, it means that the USA has a comparative advantage in the production of DI.24
Figure 2
Production possibilities frontier for India and the USA
PPF – Production Possibility Frontier
The complete absence of trade is called autarky, and in this situation, both India and the USA are limited in their consumption to the goods that they produce at home. Suppose autarky prevails, we have assumed both countries divide their respective production capacities equally between DI and DC production. The autarky production and consumption points for India and the USA are shown in Figure 3.
24 Similar graphical analysis for other commodities like shrimp & computers (Vietnam &
USA) or meat & potatoes (Farmer & Rancher) can be found in Krugman / Wells (2009) pp. 198-200 or Mankiw (2009) pp. 51-53
Dental Crowns (DC) Implants
(DI)
10
80 50
USA India
15
Number of medical treatments per day and hospital10 20 30 40 60 70 5
18
PPFINDIA
PPF
USA
Dental
Figure 3
Optimal production and consumption under Autarky
We assume that in autarky, India would choose to produce and consume nine units of DI and 40 units of DC. Table 4 summarises total output of DI and DC for India and the USA under autarky. The total outcome in autarky is summarized in Table 4, where the world production and consumption is the sum of India and the USA production and consumption, 18 DI and 65 DC, respectively.
Table 4
Optimal Production and Consumption under Autarky for India and the USA India
(Capacity: 32,000)
USA
(Capacity: 50,000)
Total Medical Treatments Dental Implants 16,000 / $1,780 = 9 25,000 / $2,780 = 9 18 Dental Crowns 16,000 / $400 = 40 25,000 / $1,000 = 25 65
Table 5 illustrates how both countries gain from specialization and free trade. As a result of comparative advantage and international trade, the USA produces 18 units of DI, but no DC, and India produces 80 units of DC, but no DI. By comparing Table 5 with Table 4, it is evident that specialization promotes wealth creation measured by increase in total world production. In the absence of specialization and trade (Table 4), total world production consists of 18 units of DI and 65 units of DC. After specialization and trade, total world production stands at 18 units of DI and 80 units of DC.
Dental Crowns (DC) Dental
Implants (DI)
10
80 50
USA India
15
Number of medical treatments per day and hospital
40 60 70
10 20 30
5 18
(9 DI / 40 DC) (9 DI / 25 DC)
Preferences of
patients (consumers) in India Preferences of
US-Patients
Table 5
Gain from Specialization and Free Trade for India and the USA India
(Capacity: 32,000)
USA
(Capacity: 50,000)
Total Medical Treatments
Dental Implants 0 50,000 / $2,780 = 18 18
Dental Crowns 32,000 / $400 = 80 0 80
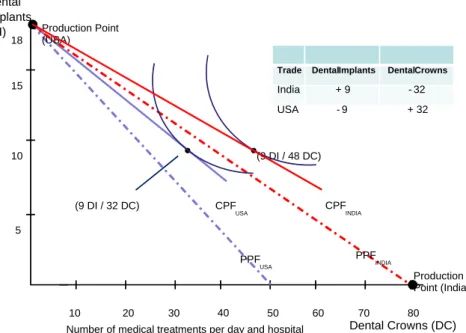
Figure 4 summarizes the graphical representation of comparative advantage, specialization, free trade and wealth creation concepts for selected dental services (DI and DC) for India as well as for the USA. Consumers in both countries are strictly better off under free trade than under autarky. As hospitals in both countries specialize, a number of Indian medical tourist (nine per day) go to the USA for Dental Implants (inbound tourism), at the same time 32 American patients seek Dental Crown treatments in Indian hospitals (outbound tourism).
Figure 4
Optimal production and consumption under free trade CPF – Consumption Possibility Frontier; PPF – Production Possibility Frontier
In the second part of our basic model section, we focus on two common, but more expensive medical services or elective surgeries – Hip Replacement (HIP) and Heart Valve Replacement (HVR). American patients can save up to 80%-90% of the respective US-costs when undertaking these procedures in an internationally accredited hospital in India. Instead of looking at the hospital capacities of the United States and India as the determinant for the production possibilities of medical services, we assume an arbitrary fixed amount of $750,000/week &
Dental Crowns (DC) Dental
Implants (DI)
10
80 50
15
Number of medical treatments per day and hospital
40 60 70
10 20 30
5 18
(9 DI / 48 DC)
(9 DI / 32 DC) CPF
INDIA
Production Point (India) Production Point
(USA)
CPFUSA
PPFUSA
PPFINDIA
Trade Dental Implants Dental Crowns
India + 9 -32
USA - 9 + 32
hospital to be spent in both countries on these two types of procedures. All other assumptions of our first model on dental services still hold, e.g. no transportation costs and homogeneous services.
Table 6
Typical Costs and Output per Week & Hospital in India and the USA Typical Cost
(per surgery)
Maximum Output (per week & hospital)
India* USA* India** USA**
Hip Replacement $7,500 $46,875 100 16
Heart Valve
Replacement $9,870 $125,000 76 6
(*) Typical Indian hospital cost and app. median USA cost.
(**) Total spending on surgeries is assumed to be $750,000 per week & hospital.
Data was retrieved from www.indushealth.com (September 14, 2010).
In Table 6, the maximum output levels (per week & hospital) are presented. Due to the substantially higher US-costs the output levels of US-hospitals are far below the ones in India. This is also reflected in the different production possibility frontiers (PPF) of the two countries in Figure 5. Hospitals in India have got absolute advantages in the production of hip as well as of Heart Valve Replacements. While the US-hospitals hold on to a comparative advantage in the production of Hip Replacements as the USA ratio of HIP / HVR is 2.7. This is higher than the one for the hospitals in India (HIP / HVR of 1.3). At the same time India has a comparative advantage in the production of Heart Valve Replacements.
Under autarky, we assume that due to the respective preferences of patients in both countries, the same amount of financial resources is allocated to each of the two types of procedures. Therefore, the American consumers will purchase and the US-hospitals will produce three Heart Valve & eight Hip Replacements per week. In India this stands at 38 HVR and 50 HIP per week (Fig. 5). The moment we allow for medical tourism flows between India and the USA, the points of production move towards the production of services that each country has a comparative advantage in. Under free trade, the US-hospitals will fully specialize in the production of Hip replacements. While the hospitals in India shift their production only slightly towards Heart Valve Replacement – instead of producing 38 HVR under autarky, they now service 42 patients per week (Fig. 6).
Why do we not see full specialization in India like we did in our previous example on dental services? Well, we want to show strict gains from international trade in services. Based on the preferences of patients in both countries, this means that the joint free trade output has to exceed the total aggregate output for both medical procedures under autarky. Due to the vast difference in the production possibility frontiers of the USA and India, full specialization is not feasible for hospitals in India. At the same time, this also implicates a substantially smaller gain from trade – the fruits of specialization are not fully in reach.
Figure 5
Production possibilities frontier for major surgeries optimal production and consumption under Autarky
However, free trade is still worthwhile pursuing as joint weekly output per hospital increases by two Hip replacements and one Heart Valve Replacement (Table 7). In Figure 6, the consumption possibility frontier (CPF) for both countries shifts outward slightly.
Table 7
Gains from Specialization and Free Trade for India and the USA
India* USA* Joint Free Trade Output
(Total Autarky Output)
Hip
Replacement $335,460 / $7,500 44
$750,000 / $46,875 16
India USA +6 60 -6 (58)
Heart Valve Replacement
$414,540 / $9,870
42 0
India USA -3 42 +3 (41)
(*)Total spending on surgeries is assumed to be $750,000 per week & hospital.
Data was retrieved from www.indushealth.com (September 14, 2010).
Our numerical model indicates that three Americans will travel for HVR to India, while six Indian patients will fly the opposite direction to be treated in US hospitals for HIP. This outcome results in outbound as well as inbound medical tourism, just like Figure 1 based on the empirical McKinsey survey shows.25 The
25 Ehrbeck et al. (2008) p. 5
Hip Replacement (HIP) Heart Valve
Replacement (HVR)
10
80 50
60
Number of medical treatments per week and hospital
40 60 70
10 20 30
50 70
PPF
INDIA
PPF
USA
90 100 40
30
20
(38 HVR / 50 HIP)
(3 HVR / 8 HIP)
number of medical tourists is moderate, less than 9% of all patients treated in both countries, but not insignificant. In the following section, we will apply some extension to this basic HIP-HVR model of international trade.
Figure 6
Optimal Production and Consumption under Free Trade No Full Specialization for India CPF – Consumption Possibility Frontier; PPF – Production Possibility Frontier
3 Extensions to the International Trade Model by Introducing Transportation Costs and Variation in Spending Patterns
Up until now, we have applied the traditional Ricardian-type trade model on the trade of specific medical services (elective surgeries). The flaws of our basic HIP- HVR model are its relatively rigorous assumptions: a two-country world, only two homogeneous services, no barriers of trade, no transportation costs, only one factor of production and the way we determined the production capacity of hospitals as well as the preferences of patients (consumers) for each country. What effect does the lifting of some of those assumptions have on the implications of our model? Due to the limited amount of room in this paper, we will concentrate on transportation costs, which are quite substantial. For Americans seeking
Hip Replacement (HIP) Heart Valve
Replacement (HVR)
10
80 50
60
Number of medical treatments per week and hospital
40 60 70
10 20 30
50 70
CPFINDIA
CPF
USA
90 100 40
30
20
(39 HVR / 50 HIP)
(3 HVR / 10 HIP)
Production Points (for India & USA)
PPFINDIA
PPFUSA
Trade Heart Valve Replacement
Hip Replacement
India - 3 + 6
USA + 3 -6
treatment in India, one has to add another $2,000-$6,000 in travel costs.26 Table 8 shows the combined travel & treatment costs for Hip and Heart Valve Replacement. Compared to our basic model, treatment costs in India have increased by 44% for HIP and 36% for HVR, while for HIP in the USA travel expenses are a minor component of total costs (7%).27 In addition, for major surgeries, patients might need an assistant or family member to accompany them;
these costs are still not accounted for.28
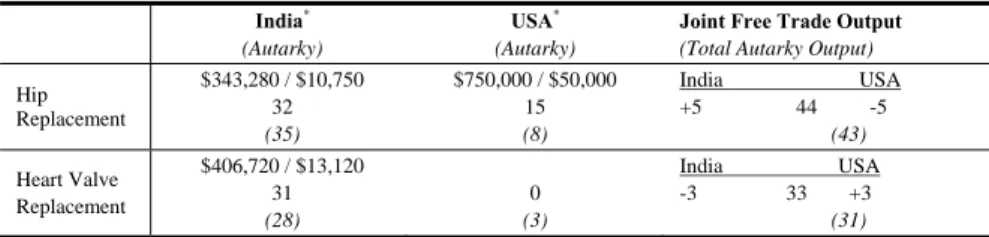
Table 8
Gains from specialization and free trade for India and the USA – including travel costs?
India* (Autarky)
USA* (Autarky)
Joint Free Trade Output (Total Autarky Output)
Hip Replacement
$343,280 / $10,750 32 (35)
$750,000 / $50,000 15 (8)
India USA +5 44 -5
(43)
Heart Valve Replacement
$406,720 / $13,120 31 (28)
0 (3)
India USA -3 33 +3
(31)
(*)Total spending on surgeries is assumed to be $750,000 per week & hospital.
Data was retrieved from www.indushealth.com (September 14, 2010).
Due to the rise in production costs in India, graphically its PPF shifts inward as the number of medical services hospitals in India can offer internationally drop substantially for both HIP (70 vs. 100) and HVR (56 vs. 76). The comparative advantage for each of the country’s hospitals remains the same. For the USA, the maximum number of Hip Replacements per week & hospital decreases by just one procedure. The gain from specialization under free trade still prevails. Though, national consumption levels are likely to fall as well as the number of international medical tourists.29 Therefore, if travel costs and other additional costs – like special insurance premiums – are substantial, taking them into account will reduce inbound as well as outbound tourism, as the gains from specialization decrease.
On the other hand, our assumptions for determining the production capacities in India and the USA were most probably too strict. As the USA per capita income ($46,000 in 2009) by far exceeds the one of India ($3,100),30 USA consumers are likely to spend more on medical services than their Indian counterparts. So, one
26 Data for travel costs for major types of procedures were retrieved from IndUSHealth (www.indushealth.com/pricing September 14, 2010)
27 As transportation costs to India, we chose $3,250; travel expenses to the USA were set at
$3,125.
28 Also, risks due to postoperative complications, which might be enhanced by immobility and long flight travel, have to be taken into account on an individual patients’ base (Unti 2009 p. 24).
29 In our numerical example the number of medical tourists dropped only slightly from 9 to 8 per week & hospital.
30 In PPP-U.S.-Dollar, estimates by the US Central Intelligence Agency (CIA 2010).
would have to adjust the financial budgets set aside for the types of procedures of interest. In addition, the demand for Hip and Heart Valve Replacement is likely to differ for each country. Making these suggested changes in our assumptions leads to the revival of the gains of trade in medical services. 31
Table 9
Gains from specialization and free trade – including travel costs and different spending patterns on surgeries for India and the USA
India* (Autarky)
USA* (Autarky)
Joint Free Trade Output
(Total Autarky Output) Hip
Replacement
$193,500 / $10,750 18 (35)
$3,000,000 / $50,000 60
(40)
India USA +18 78 -18
(75) Heart Valve
Replacement
$556,500 / $13,120 42 (28)
$750,000 / $125,000 6
(15)
India USA -11 48 +11
(43)
(*)Total spending on surgeries is assumed to be $750,000 for India and $3,750,000 for the USA per week & hospital.
Figure 7
Optimal Production and Consumption under Free Trade with Travel Costs and Higher US Expenditures
31 When relaxing some of the restrictive assumptions, a weaker Ricardian model of trade will still show the beneficial sides of free trade (Deardorff 2005 p. 23).
Hip Replacement (HIP) Heart Valve
Replacement (HVR)
10
50 60
Number of medical treatments per week and hospital
40 60 70
10 20 30
50 70
CPF
INDIA
CPF
USA
80 40
30
20
(31 HVR / 36 HIP)
(17 HVR / 42 HIP) Production
USA
PPF
INDIA
PPFUSA
Production
INDIA
In Table 9 we demonstrate the effects of higher consumer spending on medical services in the USA. We assume that US-spending is five times the amount of Indian spending – $3,750,000 vs. $750,000 – per week & hospital. Under autarky, the demand for surgeries in the USA has increased fivefold. Due to transportation costs Hip Replacements are slightly more expensive in the USA under free trade, resulting in a reduction in the maximum number of HIP surgeries (75 instead of 80). Thus, full specialization of US hospitals on hip replacements is not feasible.
The same is true for Indian hospitals and Heart Valve Replacements. Our variation in international spending patterns results in regaining economic wealth through free trade. Compared to autarky, India will gain one HR and three HIP surgeries, while for the USA HR and HIP will increase by two treatments each. Both countries specialize incompletely, and there is an increase in medical tourism flows. Figure 7 presents the graphical depiction of our numerical example.
4 Regional Aspects of Medical Tourism by Introducing Germany and Hungary
In Figure 1 we have already seen that parts of international medical tourism flows are intra-regional (within the same geographical region). Especially, dental tourism seems to be predominantly of regional nature.32 Picking up the threads of the first part of Section 2, where we introduced a restrictive Ricardian model of international trade in dental services between the USA and India, we will now extend the model by including moderate transportation costs of $1,500. As cost differentials for Dental Implants as well as for Dental Crowns are less than the cost of travel, international tourism between the North-American and Asian nation is economically not worthwhile anymore – trade falters altogether.33 Transportation costs decline as the proximity between countries increases. So, dental tourism might very well be of economic value for German and Hungarian individuals as well as on a macroeconomic level for Germany and Hungary. Their difference in income level is substantially less than for the USA and India.
Though, Germany’s per capita income of $34,100 in 2009 still exceeds the one of Hungary ($18,800).34 In 2009, more than 3.1 million Germans visited Hungary
32 Both, Turner (2008) and Gerl et al. (2009) emphasize or mention the regional nature of dental tourism in Europe, especially for Hungary.
33 Trade in dental services might be revived, the moment a patient either has to undertake several treatments at the same time or she/he is travelling to India in any case. In the latter instance, the medical treatment is just a complementary service the (business) tourist takes advantage of.
34 In PPP-U.S.-Dollar, estimates by the US Central Intelligence Agency (CIA 2010).
representing almost 8% of all foreign visitors to the country.35 During the first quarter of 2010, 31% of all foreign arrivals for long term visits were of German nationality, while Austrians were dominant in the section of same day tourist (43% of total).36 Figure 8 not only shows the influx of foreign visitors to Hungary in recent years, but also the motivation for their stay in Hungary. In 2009, more than 1.8 million visitors (an increase of 5.4% p.a.) had medical treatments, spa or wellness trips in mind. The majority of them were same-day visitors (51%). Even though these foreigners represent only 4.5% of all visitors, they are responsible for almost 12% of total spending - $710 million - by all tourists. Over the period of 2004-2009, the number of visitors motivated by medical treatment and wellness increased by 13%; their total spending in US-Dollar terms even rose by 63%.
Overall spending by all foreign visitors is substantial for the Hungarian economy as it amounted to almost $6 billion, or 4.6% of Hungary’s GDP in 2009. Out of 16.9 million Hungarians that travel abroad for tourism, only 412,000 do so for medical treatment and wellness (2.4% of total in 2009). Therefore, the balance of international tourism services has been highly positive for years for the Hungarian side.37
Source: Hungarian Central Statistical Office (2010 b) Figure 8
Number and spending of foreign visitors in Hungary (2004-2009)
35 In 2009, Germans were the fourth largest nation for foreign visitors to Hungary – after the neighbouring countries of Slovakia, Romania and Austria (Hungarian Central Statistical Office 2010a p. 56).
36 KSH (2010) pp. 1-2
37 Data was retrieved from the Hungarian Central Statistical Service (2010 b, c, d) and KSH (2010) p. 1
2 4 6 8 10 12 14
2004 2005 2006 2007 2008 2009
30 32 34 36 38 40 42
Medical treatment, wellness spending Total Number of Visitors Share of total
spending in %
Number of foreign visistors in million
Many dental clinics in Hungary are focusing on international clients; their web pages are often in English and German, and they offer transportation and lodging logistics as well as advice regarding Austrian, British and German medical insurance policies.38 Some of them are even certified by the German TÜV (association for technical inspection) and provide long-term guarantees for their medical services.39 Table 10 presents unit costs for Dental Implants and Dental Crowns for both countries. Hungarian dentists have a comparative advantage in the production of Dental Crowns, while German dentists should specialize in providing Dental Implants. Assuming a higher amount of spending for dental services in Germany, we also show maximum output per day and clinic for this numerical example. The general assumption of identical consumer (patient) preferences remains; thus under autarky patients in both countries would demand half of maximum production levels each.
Table 10
Unit Costs (in EUR) & Maximum Output per day for Dental Services Unit Costs &
Maximum Output per day
Germany* Hungary*
Dental Implants € 1,600 20 € 820 24
Dental Crowns € 1,800 18 € 250 80
(*) Spending for dental services per day and clinic: Germany (€ 32,000) and Hungary (€
20,000). Data was retrieved from www.allmedicaltourism.com (September 17, 2010).
Both countries are members of the European Union, and therefore no trade restrictions prevail. Since January 1, 2004 German medical insurance companies cover the same amount of dental expenses of its members, no matter where the provider of his/her medical service is located.40 This full-blown international competition in dental services is dampened, as we have seen before for India and the USA, by the costs of transportation. Travel expenses are assumed to be €300 per patient, which makes international trade in services between Germany and Hungary economically feasible. As German dental clinics fully specialize in Dental Implants, German patients travel to Hungary for Dental Crowns under free trade. These transportation costs are to be deducted from total daily expenditures for dental services: e.g. if eleven Germans travel to Hungarian dental clinics, transport costs amount to €3,300 – thus reducing maximum output to 18 (instead of 20) Dental Implants.41 The Hungarian side cannot fully specialize on Dental Crowns. Let us reduce their production level for Dental Implants from 12 to 6 DI.
38 E.g. VitalCenter Zahnkliniken (www.zahnklinik-ungarn.de), Denis & Focus Zahnklinik (www.denisdental.com)
39 The Bavarian association for technical inspection (TÜV Bayern) certified Gelencesér Dental Zahnklinik & Dental Labor on ISO 9001:2009 (www.gelencserdental.hu)
40 Example by www.zahnklinik-ungarn.de „Kostenerstattung Krankenkasse“ for reimbursements by German state insurance agencies.
41 The math being [€32,000 – (11 x €300) = €28,7000] / €1,600 = 18 Dental Implants per day and clinic.
To bilaterally gain from trade in international tourism services, Hungary will import seven DI per day – which amounts to €2,100 less to be spent for dental treatments. Hungarian dentists therefore will (only) produce 52 Dental Crowns – eleven of them for German tourists.42 Figure 9 graphically depicts the bilateral gains in trade for Hungary as well as Germany. Even though the points of production lie to the left of the Production Possibility Frontier for both countries (due to additional travel expenses), specialization and trade in tourism services lead to consumption levels that could not be attained under autarky. The gains of regional international dental tourism are one DI and two DC procedures for Germany as well as one procedure each in the case of Hungary.
Figure 9
Optimal Production and Consumption for Dental Services Germany vs. Hungary - Including Travel Costs
Hungary has a population of 10 million, while Germany has more than 82 million inhabitants. Due to this large difference in market size, the approximately 41,000 German dental clinics are not going to specialize fully. Therefore, in reality the gains of trade in dental services between Germany and Hungary will be less than
42 Here, the math is as follows: {[€20,000 – (7 x €300) = €17,900] – [6 x €820]} / €250 = 52 Dental Crowns.
Dental Crowns(DC) Dental
Implants (DI)
50 20
Number of medical treatments per day and clinic
40 60 70
10 20 30
25
CPFHUNGARY
CPF
GER
80 15
10
5
(13 DI / 41 DC) (11 DI / 11 DC)
Production
GER
Autarky PPF
HUNGARY
Autarky PPF
GER
Production
HUNGARY
Trade Dental
Implants
Dental Crowns
Germany - 7 +11
Hungary + 7 -11
(18 DI / 0 DC)
(6 DI / 52 DC)
we foresaw.43 If, on the other hand, dental services are just a by-product of leisure or business tourism, then specialization will be even more accentuated, as travel expenses are not taken into consideration by the tourist. This is also true for Hungarian dental clinics that operate in the border region to Austria. For Viennese, transportation costs to Hungary are negligible.
5 Implications of International Trade in Medical Services
By adapting the traditional Ricardian model of international trade to different kinds of medical services, we were able to show some of the theoretical backgrounds for the rise in worldwide medical tourism. The basic numerical and graphical presentations supported the drive for inbound as well as outbound patient flows – as is currently reflected in reality (see Figure 1). In addition, free trade in services enhances the economic wealth of open societies or countries.
However, when one takes into account substantial transportation (travel) costs, the problem of liability insurance as well as the reluctance of US insurance companies to cover these lower medical costs of hospitals in foreign countries, the drive towards specialization in medical services slows down. In addition, potential savings should amount to more than $10,000 or procedures in the USA should be above $6,000 before it is financially advantageous to travel overseas for treatment.44 It should be noted that due to mounting financial pressure on US companies and the 50 million uninsured Americans (2010), the growth prospect for future outbound medical tourism looks promising, even when taking the 2010 health reform into account. A large part of USA consumers seem to be willing to travel abroad. Their willingness increases with the rise of financial savings through foreign versus domestic medical services.45 Several US health plans have begun to cover surgeries in Thailand and Mexico46 – banking on reducing health costs – thereby further supporting outbound tourism. For less expensive medical treatments – like dental services – international trade in services becomes regional, as travel expenses drop significantly. Mexican dental clinics serve US- Americans, or Hungarian clinics offer their services to Germans, British and Austrians.
43 In 2007, Germany had exactly 40,964 dental clinics or „Zahnarztpraxen“ (Statistisches Bundesamt 2009).
44 www.medretreat.com/procedures/pricing.html (September 14, 2010). The $10,000 threshold is especially important for USA uninsured (Ehrlich et al. 2007 pp. 6-7).
45 While 3% of all USA consumers have already travelled abroad for medical services, 40%
of all surveyed would consider an “elective procedure performed in a foreign country if they could save 50% or more and be assured that the quality was equal to or better than what they can have in the U.S.” (Deloitte 2008 b, p. 13)
46 AMA (2007) p. 7
Increasing the variety of medical services will lead to a multi-polar and more complex world – with various countries specializing on the medical treatments they have a comparative advantage in. By focusing in Table 11 on the bilateral comparative advantages in producing different treatments in our four countries of consideration, one finds the following results: Germany as well as Hungary should specialize on Hip Resurfacing compared to the USA, while Hungarian dental clinics should offer Dental Crowns compared to Germany and the USA (Dental Implants). For some medical services, there is no beneficial trade in services feasible at all, e.g. between Hungary and India in dental tourism. Intriguing questions such as - What about specialization in Hip Resurfacing or Heart Valve Replacement for German and Hungarian hospitals, when both countries hospitals should jointly specialize in Hip Resurfacing vs. their American counterparts? – have to be addressed in a future research project.
Table 11
Unit Costs (in USD) for Various Medical Services in Four Countries
USA Germany Hungary India
Hip Resurfacing $ 49.830 $ 14,900 $ 6,960 $ 8,070
Heart Valve
Replacement $ 60,000* $ 39,000 $ 16,900 $ 11,800
Dental Implants $ 5,470* $ 2,100 $ 1,060 $ 500*
Dental Crowns $ 2,000 $ 2,350 $ 330 $ 150*
Data was retrieved through www.allmedicaltourism.com (September 13, 2010)
(*) some of these costs vary significantly from www.medretreat.com (September 14, 2010) References
[1] AMA Medical Travel Outside the U.S., American Medical Association, Report B (June 2007)
[2] Apollo Gleneagles at Kolkata (www.apollogleneagles.in/package) (October 16, 2009)
[3] Bey, T. Risiken und Nebenwirkungen des Medizintourismus, Deutsches Ärzteblatt, Jg. 104 Heft 4 (26. Januar 2007) 176-178
[4] Buchholz, T. G. New ideas From Dead Economists, Penguin Group 1989
[5] Bumrungrad International Bangkok, Thailand
(www.bumrungrad.com/realcost/) (December 16, 2009)
[6] Caballero-Danell, S. / Mugomba, C. Medical Tourism and its Entrepreneurial Opportunities – A Conceptual Framework for Entry into the Industry, Goteborg University Master Thesis No. 2006:91
[7] CBO Cost estimate for the amendment in the nature of a substitute for H.R.
4875, incorporating a proposed manager’s amendment made public on March 20, 2010. Washington D.C. (www.cbo.gov March 20, 2010)
[8] CIA World Factbook, Central Intelligence Agency (www.cia.gov) (September 7, 2010)
[9] Deardorff, A.V. How Robust is Comparative Advantage? RSIE Discussion Paper # 537, University of Michigan (May 16, 2005)
[10] Deloitte Medical Tourism: The Asian Chapter, Deloitte (2008a)
[11] Deloitte 2008 Survey of Health Care Consumers, Executive Summary, Deloitte Center for Health Solutions (2008b)
[12] DeNavas, C. / Proctor, B. D. / Smith, J. C. / U.S. Census Bureau Income Poverty and Health Insurance Coverage in the United States: 2008, Current Population Reports, P60-236, Washington D. C. (2009)
[13] Economist Heading for the emergency room, Reforming American health care (June 25, 2008) (www.economist.com/world/unitedstates/ September 7, 2010) [14] Economist Operation shopping, Medical tourism (December 22, 2008)
(www.economist.com September 7, 2010)
[15] Economist After the gold rush, Briefing National Health Service (December 12, 2009) pp. 27-29
[16] Edelheit, J. The Effects of the World Economic Recession on Medical Tourism, Medical Tourism Magazine (April 1, 2009)
[17] Ehrbeck, T. / Guevara, C. / Mango, P.D. Mapping the Market for Medical Travel, Health Care, The McKinsey Quarterly (May 2008)
[18] Gerl, R. / Boscher, L. / Mainil, T. / Kunhardt, H. European Competence Centres for Health & Medical Tourism, Medical Tourism Magazine (October 1, 2009)
[19] Herrick, D. M. Medical Tourism: Global Competition in Health Care, NCPA Policy Report No. 304 (November 2007) National Center for Policy Analysis [20] Hungarian Central Statistical Office (2010 a) Hungary in Figures 2009
www.ksh.hu (September 14, 2010)
[21] Hungarian Central Statistical Office (2010 b) 4.5.4. Distribution of number and spending of foreign visitors in Hungary by motivation (2004-) www.ksh.hu (September 14, 2010)
[22] Hungarian Central Statistical Office (2010 c) 4.5.4. The main indicators of foreign visitors in Hungary by main motivation of travel www.ksh.hu (September 14, 2010)
[23] Hungarian Central Statistical Office (2010 d) 4.5.8.The main indicators of Hungarians travelling abroad, by main motivation of travel www.ksh.hu (September 14, 2010)
[24] Hussain, M. / Gori, S. EU residents spent €94.2bn outside the EU for travel purposes in 2007, eurostat Statistics in focus 23/2009
[25] IndUShealth (www.indushealth.com) (September 14, 2010) [26] JCI Joint Commission International
(www.jointcommissioninternational.org/JCI-Accredited-Organizations/
September 15, 2010)
[27] Juszczak, J. Internationale Patienten in deutschen Kliniken: Ansätze zur Vermarktung von Gesundheitsdienstleistungen im Ausland, Schriftenreihe des Fachbereichs Wirtschaftswissenschaften Sankt Augustin, Bd. 8, Fachhochschule Bonn-Rhein-Sieg (Februar 2007)
[28] Krugman, P. / Wells, R. Economics, 2nd edition Worth Publishers (2009) [29] KSH International tourism demand, quarter 1, 2010, statistical reflections, Vol.
4 Issue 12 (12. July 2010) Hungarian Central Statistical Office (www.ksh.hu) [30] Mankiw, N.G. Principles of Macroeconomics, 5th edition South-Western
Cengage Learning (2009)
[31] Medearis, A. Coverage vs. cost, The US health care reform in perspective, Current Issues, Deutsche Bank Research, Frankfurt (May 20, 2010)
[32] McKinsey Accounting for the cost of US health care: A new look at why Americans spend more, McKinsey Global Institute (November 2008)
[33] MedRetreat www.medretreat.com/procedures/pricing.html (September 14, 2010)
[34] Piazolo, M. / Zanca, N.A. The Economics of Medical Tourism, A Case Study for the USA and India, Proceedings of MEB 2010, 8th International Conference on Management, Enterprise and Benchmarking, Budapest (June 4-5, 2010) pp.
123-141
[35] Planet Hospital (www.planethospital.com) (October 18, 2009)
[36] Quesada, J. Medical Tourism - An Economic Boost to the United States, Medical Tourism Magazine (online August 4, 2009)
[37] Ricardo, D. On the Principles of Political Economy and Taxation, London:
John Murray, 1817
[38] Senate The Globalization of Health Care: Can Medical Tourism Reduce Health Care Costs? Hearing before the Special Committee on Aging United States Senate, Serial No. 109-26 (June 27, 2006)
[39] Statistisches Bundesamt Kostenstruktur bei Arzt- und Zahnarztpraxen 2007, Unternehmen und Arbeitsstätten, Fachserie 4, Reihe 1.6.1., Wiesbaden 2009 [40] Turner, L. Cross-border dental care: ‘dental tourism’ and patient mobility,
British Dental Journal Vol. 204, No. 10 (May 24, 2008) pp. 553-554
[41] UNWTO World Tourism Barometer, World Tourism Organization (August 2010)
[42] Unti, J.A. Medical and surgical tourism: The new world of health care globalization and what it means for the practicing surgeon, Bulletin of the American College of Surgeons Vol. 94, No. 4 (April 2009) 18-25
[43] Vequist, D. / Valdez, E. Economic Report: Inbound Medical Tourism in the United States, Medical Tourism Magazine (online August 4, 2009)