laser exposure – A comparative study
Litauszki K., Kovács Zs., Mészáros L., Kmetty Á.
This accepted author manuscript is copyrighted and published by Elsevier. It is posted here by agreement between Elsevier and MTA. The definitive version of the text was subsequently published in [Polymer Testing, 76, 2019, DOI:
10.1016/j.polymertesting.2019.03.038]. Available under license CC-BY-NC-ND.
Powered by TCPDF (www.tcpdf.org)
Accepted Manuscript
Accelerated photodegradation of poly(lactic acid) with weathering test chamber and laser exposure – A comparative study
Katalin Litauszki, Zsolt Kovács, László Mészáros, Ákos Kmetty
PII: S0142-9418(19)30073-X
DOI: https://doi.org/10.1016/j.polymertesting.2019.03.038 Reference: POTE 5850
To appear in: Polymer Testing Received Date: 11 January 2019 Revised Date: 7 March 2019 Accepted Date: 30 March 2019
Please cite this article as: K. Litauszki, Z. Kovács, Láó. Mészáros, Á. Kmetty, Accelerated
photodegradation of poly(lactic acid) with weathering test chamber and laser exposure – A comparative study, Polymer Testing (2019), doi: https://doi.org/10.1016/j.polymertesting.2019.03.038.
This is a PDF file of an unedited manuscript that has been accepted for publication. As a service to our customers we are providing this early version of the manuscript. The manuscript will undergo copyediting, typesetting, and review of the resulting proof before it is published in its final form. Please note that during the production process errors may be discovered which could affect the content, and all legal disclaimers that apply to the journal pertain.
M A NUS
C R IP T
A C C E P TE D
Accelerated photodegradation of poly(lactic acid) with weathering test chamber and laser exposure – A
comparative study
Katalin Litauszki1, Zsolt Kovács2,3, László Mészáros1,4 and Ákos Kmetty1,4,*
1Department of Polymer Engineering, Faculty of Mechanical Engineering, Budapest University of Technology and Economics, Műegyetem rkp. 3., H-1111 Budapest, Hungary;
2Department of Experimental Physics, Faculty of Science and Informatics Institute of Physics, University of Szeged, Dóm tér 9., H-6720 Szeged, Hungary;
3Wigner Research Centre for Physics of the Hungarian Academy of Sciences,H-1121 Budapest, POB. 49, Hungary;
kovacs.zsolt@wigner.mta.hu
4MTA–BME Research Group for Composite Science and Technology, Műegyetem rkp. 3., H-1111 Budapest, Hungary;
*Correspondence: kmetty@pt.bme.hu; Tel.: +36 1-463-2004
Abstract: This study presents the comparative study of two different accelerated aging methods of poly(D-,L-lactide acid) (PLA). One is the well-known and widely used accelerated weathering chamber. The other procedure is photodegradation with a homogenized laser beam, which has not been used for the artificial aging of biopolymers so far. The film sample was artificially aged with a xenon test chamber for 200 hours, with an acceleration factor of approximately 7:1. We also performed a comparative artificial aging test using a krypton-fluoride (KrF) excimer laser in a way that the amount of energy transferred by the laser is the same as the energy transferred by the xenon lamp; the acceleration factor of the laser is higher than 42000:1. The resulting two types of photodegraded film products were compared and broadly characterized by scanning electron microscopy (SEM), differential scanning calorimetry (DSC), thermogravimetric analysis (TGA), gel permeation chromatography (GPC) and attenuated total reflectance Fourier-transform infrared spectroscopy (ATR-FTIR); the goal was to create comparison and possible conformity between the two methods to achieve higher acceleration factor for accelerated aging.
Keywords: accelerated aging, xenon test, excimer laser, poly(lactic acid)
1. Introduction
Nowadays poly(lactic acid) (PLA) is gaining in popularity because there is an increasing social and industrial need for certain polymer products to be produced from renewable sources, such as bio- based and bio-degradable polymers [1]. PLA can possibly replace polyethylene, polypropylene, polystyrene and other petroleum-based polymers in several areas, satisfying engineering requirements (processing conditions, final product properties) and costumer needs (biodegradability) [2-4]. The degradation processes of polymers are extremely important, therefore they are extensively researched. In the case of biopolymers, the investigation of biodegradation by enzymes and microbes is of paramount importance [5]. We must not forget, however, that one of the primary aspects of design by engineers is the monitoring of various thermal [6], oxidative, and photodegradation processes during the lifetime of the product, and taking their effects into account.
As a result of these processes, unfavourable mechanical and optical changes strongly affect product lifetime and usability depending on exposure. One of the most significant causes of natural aging in the case of polymers is solar radiation, since UV radiation coming from the Sun can break up the bonds in polymers [7]. Calculation with these degradation processes during the lifetime of a polymeric product is an important question not only academically but these processes also play a
M A NUS
C R IP T
A C C E P TE D
great role in the industry as well [8, 9]. Well-known and widespread testing methods include accelerated natural weathering and the use of xenon test chambers [10-12]. Their typical acceleration factor (accelerated aging: natural aging) is 2:1 or 5:1; with extreme and expensive methods it can be increased to 63:1, although it only gives reliable results in certain conditions [13- 15]. Therefore, material and production development processes require significant additional development time. There is a less researched method, which is based on irradiation with excimer laser, which has been used by several research groups [16, 17]; based on data in the literature, the acceleration factor can be up to 3200:1 or greater [16], but mostly non-oxidative types of aging can be modelled with this method [18, 19]. This procedure may be suitable for the investigation of the accelerated aging of polymers but so far researchers have not tackled the issue of how laser accelerated aging relates to accepted standard aging procedures in the industry at the micro and macromolecular level. Based on the literature, the effects of high-energy laser treatments are widely researched; in these publications the property modification of PLA is focused on from various medical technology, medical or packaging technology aspects [20]. As a result of laser treatment, the polylactide undergoes various changes. Stepak et al [21] pointed out that an unhomogenized KrF laser beam (above the ablation threshold) can cause considerable degradation in semicrystalline poly(l-lactic acid) (PLLA), which shows in the reduction of molecular weight measured with a GPC test, and the increase of polydispersity. They also showed that as a result of the reduction of molecular weight, transition temperatures, such as glass transition temperature, cold crystallization temperature and crystalline melting temperature decrease. Hsu et al [22] found that a homogenized KrF laser beam decreases the crystalline fraction, just as in the case of the widely used accelerated weathering chambers [23-25]. The investigation of the accelerated laser aging of some polymers (Acrylonitrile Butadiene Styrene Terpolymer (ABS), Modified Polyphenylene oxide/Polystyrene (PPO/PS), Polypropylene (PP)) can be found [16] but these are not thorough investigations, and no literature can be found where the morphological and materials structure differences resulting from the two procedures were compared in detail. Also, our literature research showed that there are no similar comparative studies in the case of biopolymers, and as the importance of biopolymers increases, the need arises to gain more knowledge in this area. The goal of this paper is to describe chain scission as a result of artificial aging and the results of laser treatment and the widely used accelerated aging method (xenon test).
Therefore, we produced poly(lactic acid) films (flat film extruded, high D-lactide percentage, amorphous), then we tested the 200-hour exposure of poly(lactic-acid) film samples using a standard environmental chamber (xenon lamp, daylight filter, based on standard conditions: ISO 4892- 2:2013), which corresponds to nearly 2 months of exposure in Central Europe, since PLA is not weather resistant, and amorphous PLA is even less so than semicrystalline PLA [18, 23, 26]. At the same time, a special type of accelerated photo degradation procedure was applied. We irradiated the films with an excimer laser at a given wavelength, simulating a 200-hour exposure. The resulting two types of photodegraded film products were compared and broadly characterized with the use of differential scanning calorimetry (DSC), thermogravimetric analysis (TGA), attenuated total reflectance (ATR-FTIR), scanning electron microscopy (SEM) and gel permeation chromatography (GPC) to find out possible conformity between the two methods.
2. Material and Methods
2.1. Material
We used extrusion type commercially available poly(D-,L-lactide acid) (PDLLA), Ingeo Biopolymer 4060D with 12 mol% D-lactide content (producer NatureWorks© LLC, USA). This type of PLA is amorphous in the case of a conventional cooling rate, because of the 12% D-lactide content. The PLA
M A NUS
C R IP T
A C C E P TE D
has a density of 1.24 g/cm3, its glass transition temperature is between 55-60 °C, its gloss (20°) is 90%, and haze is 2% according to the material technical data sheet [17].
2.2. Preparation of film and specimens
From the 4060D type of PLA, a thin (100 µm) biopolymer film was produced with a flat film extrusion line (Labtech Engineering Co. Ltd 25-30C single screw extruder with LCR-300 flat film line, Thailand Samutprakarn). The zone temperatures were 185/190/195/200/205/210/210/210 °C, the screw rotation speed was 35 rpm and the draw ratio was 1.14. From the films specimens that we produced, 20 mm x 20 mm specimens were cut for the degradation tests.
2.3. Xenon test exposure
Some of the PLA film samples were aged in a machine to simulate weathering phenomena artificially—in a xenon test chamber Q-SUN Xe-3 Xenon Test. The equipment was set in accordance with the ISO 4892-2 standard. We used a Daylight Q filter, and TUV irradiation mode with an irradiation energy density of 46 W/m2 (in the 300-400 nm range), which corresponded to an energy density of 0.4 W/m2 at 340 nm. The air temperature in the chamber was 38 °C, black-standard temperature was 50 °C, relative humidity was 50%, and we also used the irradiation cycle without the injection of water. Exposure time was 200 hours, which corresponded to an acceleration factor of 7:1, compared to natural aging.
2.4. Excimer laser exposure
The experimental layout used for the laser treatment of the PLA samples can be seen in Figure 1. The PLA samples were irradiated with a 248 nm Lambda Physik EMG 160 MSC, twin-tube unpolarised KrF excimer laser. The laser beam first passes through a variable attenuator, and is then reflected by a 45-degree mirror. The laser beam passes through an aperture, which cuts out a 9.8 mm diameter laser beam. Since the active medium has a short lifetime, the beam is reflected in the resonator only a few times, and so its coherence is low. Alongside the high-voltage electric discharges pumping the active medium, amplification can be greater, which can cause up to twofold or threefold intensity differences in the top-hat beam profile. To avoid this, we used a microlens (Suss microoptics) 10 mm x 10 mm fused silica beam homogenizer. A circular, 8 mm diameter beam was cut from the slightly divergent homogenized laser beam with another aperture. The PLA sample was placed in the path of this laser beam, which entered an energy monitoring device (GENTECH, Maestro series) after passing through the PLA sample.
Figure 1. Layout of the laser treatment of the PLA sample
2.5. Testing methods
2.5.1. Absorption measurement of neat film
Before the aging procedures, we measured the transparency of the unaged PLA sample with a Zeiss MQ3 spectrophotometer in the 190–400 nm range and with 1 nm steps. Then, we calculated absorption with the help of Eq. (1).
Absorption = 100 − Transmittance % , (1) 2.5.2. Gel permeation chromatography
We subjected the reference (unaged) and treated film samples to gel permeation chromatography to determine their molecular weight distribution. We used tetrahydrofuran eluent, a Jetstream 2 plus thermostat, a Waters HPLC Pump 515 and Waters Styragel HR1, HR4 column. We performed the
M A NUS
C R IP T
A C C E P TE D
analysis with an Agilent Infinity 1260 differential refractometer detector. Measurement temperature was 35 °C and the flow rate was 0.3 ml/min. Evaluation was carried out by calibration based on narrow molecular weight polystyrene standards, with the PSS WinGPC software. We determined the average molecular weight by number (M̅n), average molecular weight by weight (M̅w), peak molecular weight (Mp) and the degree of polydispersity (PD, where PD= M̅w / M̅n).
2.5.3. Differential scanning calorimetry
The differential scanning calorimetry (DSC) measurements of the samples were carried out with a TA Instruments Q2000 automatic sampling device. The measurement temperature range was 0-200 °C, the heating rate was 5 °C/min, the cooling rate was 5 °C/min and two heating scans were performed.
The weight of the samples was between 3 mg and 6 mg, and the tests were performed in nitrogen protective gas (20 ml/min) and with a nitrogen measuring atmosphere (20 ml/min). The degree of crystallinity after cold crystallisation (χ ) was calculated according to Equation (2) and the degree of crystallinity before cold crystallisation (χ ′) created via the cooling rate of flat film extrusion was calculated according to Equation (3), where ∆H is the melt enthalpy and ∆H is the cold crystallization enthalpy. PLA100% is the theoretical melting enthalpy of 100% crystalline PLA, which is 93.1 J/g [27].
χ = ∆
!""%
∗ 100 % , (2)
χ $ =∆ − |∆ |
!""%
∗ 100 % , (3)
2.5.4. Thermogravimetric analysis
TGA measurements were performed with a TA Instruments Q500 device equipped with an automatic sampling device. The measurement temperature range was 50-800 °C, the heating rate was 10
°C/min, the weight of the samples was between 3 mg and 6 mg, and the tests were performed in nitrogen protective gas (40 ml/min) and with an industrial air measuring atmosphere (60 ml/min).
The registered weight reduction was characterised with different kinds of evaluated values. We assessed initial degradation with the temperature value corresponding to 5% weight reduction (T5%
[°C]), the temperature value corresponding to 50% weight reduction (T50% [°C]), and the temperature of the maximum of the weight change rate TdTGmax [°C]).
2.5.5. Scanning electron microscopy
Scanning electron micrographs were produced with a Jeol JSM-6380LA SEM with an acceleration voltage of 10 kV. Prior to the test, the samples were sputter-coated with a thin gold layer.
2.5.6. Attenuated total reflectance Fourier-transform infrared spectroscopy
We mapped and investigated the materials and chemical processes with a Bruker, Tensor 37 transmission infrared spectrometer. The equipment records the IR spectrum of the sample with a DTGS detector, 16-time sampling in the 4000 cm-1 to 600 cm-1 range. The traditional transmission measuring technique would require extensive sample preparation causing considerable structural changes in the sample, or would not work at all, therefore we used the device with a Specac ATR (multiple weakened full reflexion) IR head unit.
M A NUS
C R IP T
A C C E P TE D
3. Results
3.1. Calculation of xenon test equivalent laser exposure
Our goal was to compare xenon test aging and laser aging with the same irradiation energy. First we calculated the degree of xenon test exposure. Figure 2 a) shows the characteristic radiation intensity of the xenon lamp as a function of wavelength (blue line). Figure 2 a) shows that in the 280 nm to 400 nm spectrum, the irradiation power generated by the xenon test chamber increases practically linearly, therefore radiation can be calculated with irradiation at 340 nm (arithmetic mean of the range), which is 0.4 W/m2. With this, it can be calculated that in the 280-400 nm range, the total absorbed energy in 200 hours is approximately 28800 mJ/cm2.
(a) (b)
Figure 2. (a) Blue line: the characteristic radiation spectrum of the xenon lamp (with a filter approximating the spectrum of sunlight), yellow: the spectrum of sunlight [28], (b) The light transmittance of PLA as a function of wavelength.
Then we examined the absorbance of untreated PLA as a function of wavelength, so that we could determine the amount of energy PLA absorbs in the different procedures. To do this, we measured the transmittance of the 100 µm thick amorphous PLA sample with a spectrophotometer in 1 nm steps in the 190 nm to 400 nm wavelength spectrum (Figure 2 (b). The transmittance of the PLA film can be considered practically linear in the range of the xenon lamp aging procedure (280-400 nm) therefore it can be approximated with the value at 340 nm, which is 86%, that is, the sample absorbs 14% of incident radiation. This way, the energy absorbed by the PLA sample during the 200-hour exposure to the xenon lamp is 14% of the 28800 mJ/cm2 calculated earlier, that is, 4032 mJ/cm2. Then, we have to determine the degree of energy absorption by the PLA film at the wavelength of laser treatment (248 nm), and how many shots are necessary for the sample to absorb 4032 mJ/cm2 of energy. For this, we measured the energy density of the laser impulses of the KrF laser (248 nm).
The fluence of one laser impulse is 20.4 mJ/cm2. The central wavelength of the KrF excimer laser is 248 nm, at this wavelength transmittance is 40% based on Figure 2 (b), therefore the PLA film absorbs 60% of incident laser irradiation. This means that the PLA sample absorbs 60% of 20.4 mJ/cm2 in each shot, that is, 12.24 mJ/cm2. This way the number of necessary laser impulses can be calculated: 4032 mJ/cm2 divided by 12.24 mJ/cm2, which is 330, rounded to the nearest whole number. The designation of the samples can be found in Table 1. The duration of exposure to the laser was approximately 2 minutes at a repetition rate of 3 Hz, and the acceleration factor of the laser is approximately 42000:1.
Sample name PLA type Form Treatment Dosage
[mJ/cm2]
PLA_neat_film Ingeo 4060D film without 0
PLA_xenontest Ingeo 4060D film Q-sun, 200h 4032
PLA_laser Ingeo 4060D film 330 laser
pulses 4039
Table 1. Designation of the samples.
3.2. Scanning electron microscopy
First we wanted to compare the samples aged with the xenon test accelerated aging process (PLA_xenontest) and the samples aged with photodegradation by a homogenized laser beam (PLA_laser) using SEM images. The SEM images of the samples aged with the two methods show (Fig.
Error! Reference source not found. a), b), c), d)) that the homogenized laser beam is advantageous
M A NUS
C R IP T
A C C E P TE D
because there were no local, dot-like or intensively degraded parts on the surface of the film, therefore no difference was observed in the case of laser aging (Fig. Error! Reference source not found. c), d)) compared to the xenon test aging procedure (Error! Reference source not found. a), b)).
(a) (b)
(c) (d)
Figure 3. SEM image of a PLA film aged for 200 hours in a Xenon test chamber (PLA_xenontest) at a magnification of (a) 250x and (b) 1000x., and the SEM image of a laser-aged PLA film (PLA_laser) at a magnification of (c) 250x and (d) 1000x.
3.3. Morphological and thermal properties of the films
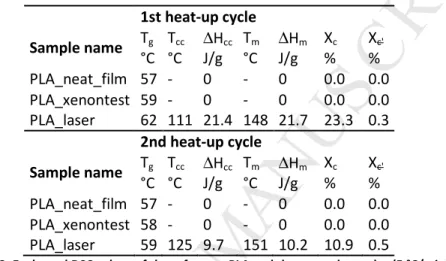
Then we examined the reference PLA film (PLA_neat_film) and the treated samples using differential scanning calorimetry (DSC) and thermogravimetric analysis (TGA). DSC allowed the examination of the thermal changes of the sample as a function of temperature, their transformations and the enthalpy changes connected to them. We performed two heat-up cycles on the samples. The first one provided information about the thermal and mechanical history of the sample, while the second heat-up curve (thermal history was erased with a controlled cooling cycle) allowed us to draw comparative conclusions about the effects the treatments had on material structure [29]. The DSC curves can be seen in Figure4 and the calculated values can be found in Table 2.
(a) (b)
Figure 4. The DSC curves of the reference PLA and the treated samples, (a) 1st heat-up, 5 °C/min, (b) 2nd heat-up, 5
°C/min.
The amorphous PLA of 12% D-lactide content that we chose has a glass transition temperature of 57 °C (determined from the second heat-up cycle), which corresponds to the technical specification, and no enthalpy change connected to cold crystallization or crystalline melting was registered; the material showed an amorphous character. An endothermic enthalpy relaxation belongs to the Tg
transition during the first heat-up cycle; this originates in the manufacturing technology. These phenomena only occur during the first heat-up (Figure4 (a)) and cannot be repeated. The Tg of the sample aged in the xenon test chamber is 59 °C and the material is amorphous. Laser aging further increased the Tg slightly, to 62 °C; this can be explained with the free volume theory, according to the literature [30, 31]. The PLA sample has extra free volume as a result of the higher degree of degradation and therefore shows a greater tendency to transform to the equilibrium state. This way, decreasing molecular weight allows a more compact structure, which inhibits the start of segment movements; this results in a higher Tg. After the thermal history is erased, the second heat-up cycle (Figure4 (b)) shows that the Tg of the sample aged in the xenon test chamber is nearly the same as that of the untreated film; we registered 58 °C and the material is amorphous in this case, too. Laser aging increased Tg slightly to 59 °C. The first transformation phenomenon of the DSC curve is the glass transition temperature (Tg); after this, in the case of amorphous polymer materials, there is no cold crystallization or crystalline melting connected to the melting of the crystalline fraction.
However, in the case of semicrystalline polymers, if the sample is capable of producing a further crystalline fraction as temperature increases, the exothermic phenomenon of cold crystallization can also be seen on the DSC curve, and after this, crystalline melting occurs. The most characteristic
M A NUS
C R IP T
A C C E P TE D
difference is that the material, which had been amorphous earlier, was able to form crystalline parts during the DSC test as a result of the laser treatment. This exothermic phenomenon is marked by Tcc
in Figure4 (a). The maximum temperature of enthalpy change is 111 °C and the change of the corresponding enthalpy is (∆Hcc) 21.4 J/g. The enthalpy change related to the melting of the crystalline fraction that formed is also 21.4 J/g and the crystalline melting peak temperature is 148
°C. The forming of a crystalline fraction in the originally amorphous PLA (at a heating rate of 5
°C/min) is probably connected to degradation, since the tendency to crystallize largely depends on molecular weight [32]. During the degradation process, average molecular weight decreases, therefore the mobility of the polymer chains increases, and so the given PLA type can show a semicrystalline character even at a heating rate of 5 °C/min. The first heat-up curve shows that the material degraded as a result of laser treatment, but no crystalline fraction formed. The second heat- up indicates that the material is capable of forming a crystalline fraction of nearly 11%.
1st heat-up cycle
Sample name Tg Tcc ∆Hcc Tm ∆Hm Xc Xc'
°C °C J/g °C J/g % % PLA_neat_film 57 - 0 - 0 0.0 0.0 PLA_xenontest 59 - 0 - 0 0.0 0.0 PLA_laser 62 111 21.4 148 21.7 23.3 0.3
2nd heat-up cycle
Sample name Tg Tcc ∆Hcc Tm ∆Hm Xc Xc'
°C °C J/g °C J/g % % PLA_neat_film 57 - 0 - 0 0.0 0.0 PLA_xenontest 58 - 0 - 0 0.0 0.0 PLA_laser 59 125 9.7 151 10.2 10.9 0.5
Table 2. Evaluated DSC values of the reference PLA and the treated samples (5 °C/min).
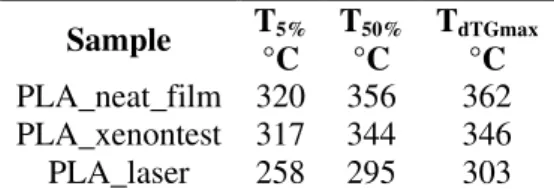
To prove degradation and examine its extent, first we performed thermogravimetric analysis. Weight reduction is measured as a function of temperature by TGA, and TGA can be used to establish the extent to which the polymer has been stabilized or aged [29]. The thermograms in
Figure 5 (a) indicate that the PLA samples degrade in one step but the beginning and run of the weight reduction of the samples differ—these values can be found in Table 3. . While weight reduction starts (T5%) at 320 °C in the case of the untreated PLA film, this temperature is lower (317 °C) for the sample aged in the xenon test chamber. The start of the degradation of the laser- aged PLA sample (T5%) can be registered at 258 °C, therefore the average molecular weight of this sample is far lower than that of the reference sample and probably also different from the molecular weight of the xenon test-aged sample. This lowered heat stability phenomenon is supported by the maximum of the decomposition rate (dTG) and the shape of the curves (
Figure 5 (b)). While xenon test aging showed a 16 °C decrease in the maximum of dTG compared to untested PLA, laser aging produced a 59 °C decrease, and weight reduction is lower than in the other two cases. The cause of the different degree of degradation is that molecular weight values probably shifted towards even lower values, and the distribution of molecular weight widened [21]. Although laser treatment probably caused more intensive degradation than xenon treatment, a single-step degradation process is a good indicator that degradation was homogeneous along the thickness of the specimen. This is indicated by the homogeneous surface of the sample in the SEM images.
Figure 5. (a) TGA and (b) dTG results of the reference PLA and the treated samples (10 °C/min)
M A NUS
C R IP T
A C C E P TE D
Sample T5% T50% TdTGmax
°C °C °C PLA_neat_film 320 356 362 PLA_xenontest 317 344 346 PLA_laser 258 295 303
Table 3. Evaluated TGA curve values of reference PLA and treated samples (10 °C/min).
3.4. Molecular weight distribution of the films
In order to determine chain scission and the molecular weight distribution of the polymer, we performed gel permeation chromatography. Changes in molecular weight distribution compared to the reference PLA film are shown in Figure 6. GPC proved our assumption that in both aging processes, degradation caused the polymer chains to shift to lower molecular weights. Values calculated by GPC can be found in Table 4. . As a result of xenon test aging, MSw decreased a little, by 5400 g/mol (3.2% decrease) and the degree of PD remained roughly the same. On the other hand, in the case of laser aging (with 330 shots), degradation was considerable, compared to xenon test aging. MSw decreased to 56970 g/mol, which is a 65.8% reduction and polydispersity grew to 2.137, which is a 19.7% increase. This significant breaking of the chains may have enabled the polymer chains of the original amorphous PLA to get ordered at an increased temperature and form a semicrystalline morphology during the cold crystallization process. It is a positive aspect that beam homogenization and aging in the entire cross section were successful, because if the sample had degraded more in the upper layers than in the lower layers, we would have got bimodal distribution in GPC [21].
Figure 6. The molecular weight distribution of reference PLA and treated samples.
Sample name Peak no. Mp M̅ n ∆∆∆∆ M̅ n M̅ w ∆∆∆∆ M̅ w PD ∆∆∆∆PD - g/mol g/mol % g/mol % M̅ w / M̅ n % PLA neat_film 1 152300 93270 - 166400 - 1.785 - PLA xenontest 1 149200 91610 98.2 161000 96.8 1.758 98.5 PLA laser 1 40610 26660 28.6 56970 34.2 2.137 119.7
Table 4. The results of the GPC test of the reference PLA, the xenon test-treated and the laser-treated samples.
3.5. Fourier-transform infrared spectroscopy
After the degree of degradation was determined, we performed infrared spectroscopy to determine the changes in the chemical composition of the material. A typical FTIR spectrum of an amorphous PLA contains intensity peaks: –CH– stretching modes (2997 and 2946 cm-1, 2877 cm-1), a –C=O stretching region (strong 1759 cm-1), –CH3– deformation (1456 cm-1), –CH– deformation and asymmetric bands 1382, and 1365 cm-1, –C–O– stretching of the ester group 1225 cm-1, –C–O–C–
asymmetric mode at 1090 cm-1, and –C–C– stretch (871 cm-1) [7]. Figure 7 shows that there is no significant difference in the FTIR spectrum, no new intensity peak, and no intensity maximum shift which would indicate a semicrystalline structure [33].
Figure 7. Infrared spectra of the reference neat PLA film (PLA_neat_film), PLA treated with xenon (PLA_xenontest) and PLA treated with laser (PLA_laser, 330 laser pulses), (a) 600-3200 cm-1, (b) 1300-1800 cm-1, (c) 800-1300 cm-1
M A NUS
C R IP T
A C C E P TE D
Since the character of the measured degradation is promising but goes beyond the 200-hour xenon test degradation of the sample, further tests were necessary to find the accurate number of laser shots, that is, the amount of irradiated energy. To do this, we chose extra measurement points.
3.6. Modification of exposure
The results show that the approximation method did not result in equivalence, therefore a correction of laser exposure is necessary. We set two measurement points between the measured values obtained by 330 shots and the untreated film: 110 shots and 220 shots. This way we were able to examine the relationship between degradation and irradiated laser energy. The designation of the samples can be found in Table 5.
Sample name PLA type Form Treatment Dosage [mJ/cm2] PLA_neat_film Ingeo 4060D film without 0
PLA_xenontest Ingeo 4060D film Q-sun, 200h 4032 PLA_laser_110 Ingeo 4060D film 110 laser pulses 1346 PLA_laser_220 Ingeo 4060D film 220 laser pulses 2692 PLA_laser_330 Ingeo 4060D film 330 laser pulses 4039
Table 5. Designation of the samples in the case of the modified exposure tests.
We treated the film samples with 110 and 220 laser pulses as well, then performed GPC on the treated samples (Figure 8, Table 6). As irradiation energy was decreased, degradation decreased, too.
When irradiation energy was decreased by one-third (2692 mJ/cm2, 220 pulses), M̅w only decreased by 54.7% compared to the untreated film (75340 g/mol). When the PLA sample was irradiated with one-third of 4039 mJ/cm2, 1346 mJ/cm2, it degraded to a lesser extent, M̅w decreased by 41.3%
compared to the untreated sample, to 97720 g/mol and the degree of PD also only increased by 11.4% compared to the reference sample.
Sample name Peak no. Mp M̅ n ∆∆∆∆ M̅ n M̅ w ∆∆∆∆ M̅ w PD ∆∆∆∆PD - g/mol g/mol % g/mol % M̅ w / M̅ n % PLA neat_film 1 152300 93270 - 166400 - 1.785 - PLA xenontest 1 149200 91610 98.2 161000 96.7 1.758 98.5 PLA laser_110 1 82770 49160 52.7 97720 58.7 1.988 111.4 PLA laser_220 1 58210 34840 37.4 75340 45.3 2.163 121.2 PLA laser_330 1 40610 26660 28.6 56970 34.2 2.137 119.7
Table 6. The results of the GPC measurement of reference PLA and the treated samples
Figure 8. The molecular weight distribution of reference PLA and the treated samples
Figure9 shows show the number of chain scissions, expressed by (Mno/Mn)-1, where Mn is the number average molecular weight after exposure, and Mno is the initial number average molecular weight. The values are presented as a function of total absorbed laser energy. The curve fitted to the measurement points is described by Eq. (4). The R2 of the fitted curve is 0.9998.
y = 0.0006x + 0.0897 (4)
It is important that while in the case of xenon test aging, at the given settings, the change in molecular weight is not considerable, laser treatment significantly reduced the average weight of the chains at the same doses. One explanation is the difference of intensities of the procedures. The average laser pulse length is 20 ns. Multiplying this with the number of shots yields a difference of 9 orders of magnitude. Excimers, and generally UV lasers are usually called a class of “cold lasers”, because when they interact with materials, they operate well over the thermal excitation levels
M A NUS
C R IP T
A C C E P TE D
(infrared, medium infrared). For this reason, thermal excitation could only be expected after the primary chemical excitation, during the relaxation phase. This way, the chains have a short time to reorder, but an accurate description of these light-matter interactions would require picosecond time scale so-called pump-probe measurements.
Figure 9. The (Mno/Mn)-1 value as a function of total absorbed laser energy (the red line is the fitted trend line)
5. Conclusions
We comprehensively examined the accelerated photodegradation of PLA via a xenon test chamber and via homogenized laser beams; the acceleration factor of the laser was approximately 42000:1.
We determined various properties of the reference sample and the samples treated with two different methods. The GPC results showed that in the laser-treated sample M̅w decreased to 56970 g/mol, which is a decrease of 65.8%, while polydispersity grew to 2.137, which is a 19.7% increase compared to the untreated PLA film sample. Although degradation was higher than degradation achieved by the xenon test, molecular weight distribution had a monomodal character in both cases, which suggests that the laser degraded not only the upper layer of the film but the whole cross section. We performed further irradiation tests (with 2/3 and 1/3 doses) and analysed chain scission, and examined the effect of absorbed laser energy on molecular weight using GPC tests. The curve fitted to the measurement points can be described with the y = 0.0006x + 0.0897 equation. The R2 of the fitted curve is 0.9998.
Funding:
„ Supported by the ÚNKP-17-3-I New National Excellence Program of the Ministry of Human Capacities”. This research was supported by The National Research, Development and Innovation Office (NVKP_16-1-2016-0012). This work was also supported by the Higher Education Excellence Program of the Ministry of Human Capacities in the framework of the Nanotechnology research area of the Budapest University of Technology and Economics (BME FIKP-NANO). This work was also funded by Hungarian Scientific Research Fund - OTKA113222.
Acknowledgments:
We wish to thank MTA TTK AKI Polymer Chemistry Research Group for the GPC test.References
[1] C. Vasile, M. Rapa, M. Stefan, M. Stan, S. Macavei, R.N. Darie-Nita, L. Barbu-Tudoran, D.C. Vodnar, E.E. Popa, R. Stefan, G. Borodi, M. Brebu, New PLA/ZnO:Cu/Ag bionanocomposites for food packaging, Express Polymer Letters, 11 (2017) 531-544.
[2] L. Avérous, Handbook of Biopolymers and Biodegradable Plastics, Plastics Design Library, Oxford, 2013.
[3] V. Jost, Packaging related properties of commercially available biopolymers – An overview of the status quo, Express Polymer Letters, 12 (2018) 429-435.
[4] R. Muthuraj, T. Mekonnen, Recent progress in carbon dioxide (CO2) as feedstock for sustainable materials development: Co-polymers and polymer blends, Polymer, 145 (2018) 348-373.
[5] R.A. Gross, R.T. MacDonald, S.P. McCarty, Enzymatic degradability of poly(lactide): Effects of chain stereochemistry and material crystallinity, American Chemical Society, Polymer Preprints, Division of Polymer Chemistry, 37 (1996) 436-437.
[6] Zink B., J.G. Kovács, Enhancing Thermal Simulations for Prototype Molds, Periodica Polytechnica Mechanical Engineering, 62 (2018) 320-325.
M A NUS
C R IP T
A C C E P TE D
[7] R. Auras, L.-T. Lim, S.E.M. Selke, H. Tsuji, Poly(Lactic Acid) Synthesis, Structures, Properties, Processing and Applications, Wiley, New Jersey, 2011.
[8] C.C. White, K.M. White, J.E. Pickett, Service Life Prediction of Polymers and Plastics Exposed to Outdoor Weathering, Plastics Design Library, Chadds Ford, PA, USA, 2018.
[9] S. Al-Malaika, P. Dubois, P. Gijsman, H. Zahalka, Polymers, environment and sustainable developments: Opportunities and recommendations for the coming decade, Polymer Degradation and Stability, 143 (2017) 104-105.
[10] N. Lucas, C. Bienaime, C. Belloy, M. Queneudec, F. Silvestre, J.-E. Nava-Saucedo, Polymer biodegradation: Mechanisms and estimation techniques, Chemosphere, 73 (2008) 429–442.
[11] A. Ammala, S. Bateman, K. Dean, E. Petinakis, P. Sangwan, S. Wong, Q. Yuan, L. Yu, C. Patrick, K.
H. Leong, An overview of degradable and biodegradable polyolefins, Progress in Polymer Science 36 (2011) 1015–1049.
[12] J. E. Pickett, D. A. Gibson, M. M. Gardner, Effects of irradiation conditions on the weathering of engineering thermoplastics, Polymer Degradation and Stability, 93 (2008) 1597–1606.
[13] D. R. Bauer, Interpreting weathering acceleration factors for automotive coatings using exposure models, Polymer Degradation and Stability, 69 (2000) 307–316.
[14] J. W. Martin, J. W. Chin, T. Nguyen, Reciprocity law experiments in polymeric photodegradation:
a critical review, Progress in Organic Coatings, 47 (2003) 292–311.
[15] J. Pospisil, J. Pilar, N. C. Billingham, A. Marek, Z. Horak, S. Nespurek, Factors affecting accelerated testing of polymer photostability, Polymer Degradation and Stability, 91 (2006) 417-422.
[16] K.G. Snowdon, S. Rolt, Accelerated Laser Ageing Of Plastics, SPIE, Excimer Lasers and Applications, 1023 (1989) 158-165.
[17] K. K. Pandey, T. Vuorinen, Comparative study of photodegradation of wood by a UV laser and a xenon light source, Polymer Degradation and Stability, 93 (2008) 2138–2146.
[18] Z. Lynda, K. Mustapha, B. Stéphane, A. Bourmaud, Y. Grohens, Effect of natural weather on the structure and properties of polylactide/Cloisite 30B nanocomposites, Polymer Degradation and Stability, 95 (2010) 1751-1758.
[19] A. V. Janorkar, A. T. Metters, D. E. Hirt, Degradation of poly(L-lactide) films under ultraviolet- induced photografting and sterilization conditions, Journal of Applied Polymer Science, 106 (2007) 1042–1047.
[20] T.S. Demina, A.B. Gilman, A.N. Zelenetskii, Application of high-energy chemistry methods to the modification of the structure and properties of polylactide (a review), High Energy Chemistry, 51 (2017) 302-314.
[21] B.D. Stępak, A.J. Antończak, K. Szustakiewicz, P.E. Kozioł, K.M. Abramski, Degradation of poly(l- lactide) under KrF excimer laser treatment, Polymer Degradation and Stability, 110 (2014) 156-164.
[22] S.-T. Hsu, H. Tan, Y.L. Ya, Effect on excimer laser irradiation of biodegradable polymer on its chemical bonding, ICALEO, 30th International Congress on Application of Lasers & Electro- OpticsOrlando, FL, USA, 2011, pp. 1168-1177.
[23] C. Kaynak, I. Kaygusuz, Consequences of accelerated weathering in polylactide nanocomposites reinforced with halloysite nanotubes, Journal of Composite Materials, 50 (2015) 365-375.
[24] C. Kaynak, B. Dogu, Effects of Accelerated Weathering in Polylactide Biocomposites Reinforced with Microcrystalline Cellulose, International Polymer Processing, 31 (2016) 410-422.
[25] W. Chávez-Montes, G. González-Sánchez, E. López-Martínez, P. de Lira-Gómez, L. Ballinas- Casarrubias, S. Flores-Gallardo, Effect of Artificial Weathering on PLA/Nanocomposite Molecular Weight Distribution, Polymers, 7 (2015) 760-776.
[26] H. Tsuji, Y. Echizen, Y. Nishimura, Photodegradation of biodegradable polyesters: A comprehensive study on poly(L-lactide) and poly(3-caprolactone), Polymer Degradation and Stability, 91 (2006) 1128-1137.
[27] T. Tábi, S. Hajba, J.G. Kovács, Effect of crystalline forms (α′ and α) of poly(lactic acid) on its mechanical, thermo-mechanical, heat deflection temperature and creep properties, European Polymer Journal, 82 (2016) 232-243.
[28] Atlas Electric Devices Company, Weathering testing guidebook, Atlas, USA, 2001, pp. 114.
M A NUS
C R IP T
A C C E P TE D
[29] G.W. Ehrenstein, G. Riedel, P. Trawiel, Thermal Analysis of Plastics - Theory and Practice, Hanser Publishers, Munich, Germany, 2004.
[30] H. Cai, V. Dave, R. A. Cross, S.P. McCarthy, Effects of Physical Aging, Crystallinity, and Orientation on the Enzymatic Degradation of Poly(Lactic acid), Journal of Polymer Science: Part B:
Polymer Physics, 34 (1996) 2701-2708.
[31] K. Liao, D. Quan, Z. Lu, Effects of physical aging on glass transition behavior of poly(DL-lactide), European Polymer Journal, 38 (2002) 157-162.
[32] S. Saeidlou, M.A. Huneault, H. Li, C.B. Park, Poly(lactic acid) crystallization, Progress in Polymer Science, 37 (2012) 1657-1677.
[33] T.-S. Lee, A.R. Rahmat, W.A.W.A. Rahman, Polylactic Acid: PLA biopolymer technology and applications, Plastics Design Library, Chadds Ford, PA, USA, 2012.
![Figure 2. (a) Blue line: the characteristic radiation spectrum of the xenon lamp (with a filter approximating the spectrum of sunlight), yellow: the spectrum of sunlight [28], (b) The light transmittance of PLA as a function of wavelength](https://thumb-eu.123doks.com/thumbv2/9dokorg/1330904.107657/7.892.155.748.874.993/characteristic-radiation-spectrum-approximating-spectrum-sunlight-transmittance-wavelength.webp)