György Matolcsy
Successful Crisis Management in the Light of the Twelve
Economic Turnarounds
Summary
In 2019, now more than a decade after the global economic crisis of 2008–2009, it is appropriate to look back on the events of the period, which was one with a major bearing on economic history. The complex challenges emerging in the aftermath of the global economic crisis and the answers given to them remain fundamental determinants of our daily lives to this day. Moreover, as on a number of occasions in the course of history, the economic crisis also challenged the dominant trends in con- nection with the development of economics as a science. The very first and perhaps the most important reference point in the debates was the way in which to manage the crisis. According to neoliberalism, the former predominant school of economic thought, short-term salvation could be found by supply-side reforms causing demand to decline, a view which was increasingly challenged over time by economists seeking a broad distribution of Keynesian economic stimulus and the burdens of reform. Hun- gary is a country where this debate and its consequences have been quite spectacular.
Due to the flawed economic policy pursued before the crisis, the global storm of 2008–2009 hit an extremely weakened Hungary. As a result of that and the flawed crisis management based on neoliberal foundations that predominated the period, Hungary suffered one of the worst crises seen in Europe up to 2010. In the after- math of the severe damage, the civic government entering office in 2010 announced a new approach to crisis management. Building on coordination between branches of economic policy, the strategy adopting a combination of innovative, conventional and unconventional measures successfully stabilised Hungary, setting the country on
Dr György Matolcsy, the Governor of the Magyar Nemzeti Bank (governor@
mnb.hu).
a new path of convergence. This paper provides an overview of the most important steps and achievements of that crisis management.
Journal of Economic Literature (JEL) codes: G01, E60, O47, E52
Keywords: economic crisis, economic policy, economic convergence, monetary policy
Hungary in the years before the crisis
The global financial crisis of 2008 hit an extremely weakened Hungary. Well before the crisis, serious funding and structural problems had emerged. As a result of the fundamentally flawed economic policy pursued after 2002, which built on external indebtedness, imbalances developed in a wide range of areas across the economy.
These imbalances contributed to Hungary’s deteriorating competitiveness, a halt in convergence, and increased vulnerability. The potential growth rate of the Hungar- ian economy increasingly fell behind rates in the EU Member States and the Visegrád Countries (Czech Republic, Poland, Slovakia), exacerbated by a low level of employ- ment, slowing productivity growth, and an inadequate level of investments. Well be- fore the crisis, starting from 2005, the investment rate had declined, showing substan- tial divergence from regional developments. Hungary’s activity and employment rates were among the lowest in the European Union. Before the crisis, excessively high taxes on labour and an overly generous system of social benefits had acted as barriers to the development of the labour market on both the demand and the supply sides, hindering economic growth.
In addition to soaring public deficits, a major current account deficit had also accumulated. In the absence of adequate internal savings, the Hungarian economy embarked on the perilous path of external indebtedness, with all economic agents accumulating significant volumes of debt, to a large extent denominated in foreign currency. The general government financed the deficit primarily from external funds, which gave rise to high levels of rollover and exchange rate risks, while also increasing external debt. The situation was exacerbated by the fact that – in the absence of ad- equate available internal savings – the domestic banking sector increasingly provided credit in foreign currency, primarily in Swiss franc (Matolcsy, 2008).
Apart from the course of fiscal policy, matters were made even worse by monetary policy decisions. Responding to the flawed economic policy measures that had led to high external debt and thus weakened the forint, in 2003 the central bank raised the base rate to 12.5 per cent, a particularly high level by historical standards. While this prevented the HUF exchange rate from depreciating further, the resulting double- digit lending rates gave rise to return requirements that manufacturing companies found difficult to meet. Moreover, the artificial strength of the exchange rate boosted foreign currency lending, driving economic agents to replace the now expensive for- int funds with foreign currency loans on an increasing scale. By the time of the crisis,
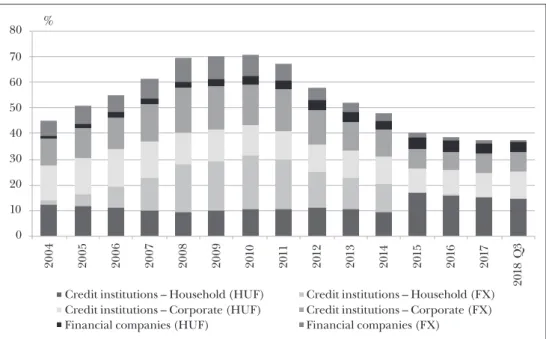
the volume of credit as a percentage of GDP exceeded 70 per cent, in which the share of foreign currency loans was steadily rising, exposing the private sector to elevated exchange rate risk (Matolcsy, 2007).
Figure 1: Credit-to-GDP ratio in Hungary
0 10
Credit institutions – Household (HUF) Credit institutions – Corporate (HUF) Financial companies (HUF)
Credit institutions – Household (FX) Credit institutions – Corporate (FX) Financial companies (FX)
20 30 40 50 60 70 80
2004 2005 2006 2007 2008 2009 2010 2011 2012 2013 2014 2015 2016 2017 2018 Q3
%
Source: MNB
First responses – conventional formula, failed crisis management
In the risk-averse market sentiment prevailing after the crisis, in the space of less than one year the forint depreciated by close to 40 per cent from the level of EUR/HUF 230. As a result of the high foreign exchange exposure, households were hit particu- larly hard by the depreciation of the domestic currency. Due to the rising exchange rate, households were faced with a drastic increase in their payment-to-income ratios, while the options for public debt financing narrowed. All of this was accompanied by the excessive deficit procedure (EDP) that had been in place against Hungary since 2004, adding to the difficulties in managing the crisis.
Clearly, budgetary consolidation was needed, but a flawed assessment of the prob- lems impeded crisis management. The measures focused exclusively on the supply side of the economy, putting an additional squeeze on the already sluggish demand through austerity. However, measures focused on the supply side could not be success- ful, because policy-makers applying fiscal austerity significantly underestimated the size of the fiscal multiplier (the growth effect of a unit of government action) and its devastating force in an environment of recession (Matolcsy, 2018). Despite the gov-
ernment’s cutbacks on fiscal expenditures, fiscal consolidation was undermined by lower tax revenues due to the accompanying contraction in internal demand, which was even accelerated by the measures. Instead of the desired restoration of equilibri- um, the results were a deeper recession, rising unemployment and steadily increasing debt ratios. Conventional crisis management based on austerity measures only paved the way for additional adjustments.
Amounting to 4 to 5 per cent of GDP, the fiscal austerity measures adopted in 2009 based on the IMF–European Commission rescue package of autumn 2008 cost house- holds the dearest. The increase in the general VAT rate, the freeze on wages in the public sector, the withdrawal of 13th-month incomes and 13th-month pensions, the changes to pension indexation, the increased retirement age, the freeze on the family allowance, and the more rigorous rules of eligibility for childcare aid and childcare allowance, all hit households, which were simultaneously faced with increased instal- ments on their foreign currency loans. On the other side of the scale, there was only a moderate reduction in contributions payable on labour, and a slight increase in the minimum wage. Owing to the spillover effects, rather than driving economic de- velopments towards equilibrium, the measures implemented resulted in major real- economy sacrifices and persistently high inflation (Matolcsy, 2015).
The austerity measures and the gradual decrease in the wage ratio led to a sub- stantial contraction in household consumption and consequently in Hungarian out- put, resulting in even poorer debt indicators for the country. Additionally, despite the availability of EU funds, investments saw an even greater fall than consumption overall, further reducing Hungary’s potential growth. On the whole, due to the high fiscal multiplier resulting from the crisis environment, the role of fiscal policy in the post-crisis decline proved to be decisive (Matolcsy, 2018).
The failure to implement comprehensive tax reforms was accompanied by unfor- tunate timing, given that the whole of Europe was functioning in crisis management, as a result of which external demand could not contribute to counterbalancing the losses incurred on the expenditure side of the budget. Indeed, conventional crisis management based on austerity measures brought new problems to the surface. The electoral mandate of the governing party was severely damaged, which led to political instability and a government crisis. Financing and growth problems evolved into a po- litical crisis, as a result of which, over time, economic policy lost its social support for the introduction of reforms of any kind. Consequently, a turnaround towards equi- librium could only be made by means of an economic policy that went beyond the conventional formula of austerity measures, the opportunity for which was created by the 2010 change in government.
Historic turnarounds in post-2010 Hungarian economic policy
In and of themselves, recessions do not only involve a fall in aggregate demand, but also provide an opportunity to renew economic thinking. New types of ideas chal-
lenging the former mainstream may also gain prominence, potentially offering new ways to reflect on the way a crisis is managed. In 2010, economic policy faced multiple problems as a result of the earlier flawed crisis management. Its task was to create fi- nancial stability and implement structural reforms at the same time. The government coming into office made a radical break with the previous crisis management prac- tices. In order to stabilise the economy, it implemented growth-friendly measures us- ing innovative and targeted means, while also improving the fiscal balance (Matolcsy and Palotai, 2014). The following sections address the most important turnarounds achieved in Hungarian economic history since 2010.
Turnarounds in fiscal matters
The change in Hungarian fiscal policy was brought about by the inauguration of the new civic government in 2010, which is now serving its third term. The task did not look easy: financing processes had to be stabilised while creating opportunities for economic growth through structural reforms.
Turnaround in the tax regime
The tax regime was reformed with a view to supporting economic growth while main- taining budgetary equilibrium. In order to achieve this dual objective, it was necessary to boost employment and investments, which could be achieved most effectively by reducing taxes on capital and labour. The tax reform launched in 2010 was under- pinned by a new philosophy. The most prominent change was the government’s shift in focus from taxes on labour and capital to indirect consumption and sales taxes. The reduction of tax and contribution burdens on labour, along with the offer of targeted benefits (Job Protection Action Plan), has had a positive effect on economic operators’
labour market decisions, increasing incentives to work (Baksay and Palotai, 2017).
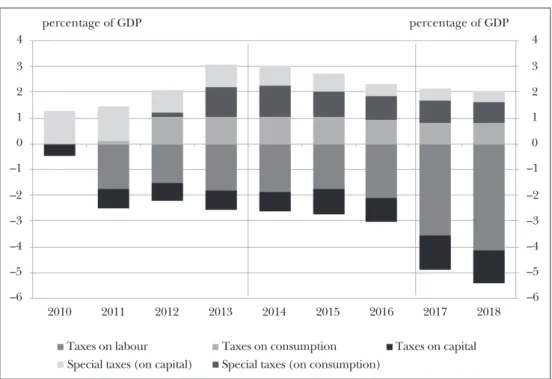
In addition to the taxes on labour, the levies on capital also significantly distort investment decisions by economic operators, and there is broad consensus that they are among the most harmful tax burdens. As early as the second half of 2010, the tax burden on capital decreased significantly as a result of raising the threshold for the higher corporate tax rate from HUF 50 million to HUF 500 million, which expanded the range of small and medium-sized companies subject to the lower tax rate. In 2017 a flat corporate tax rate was introduced, and the rate was lowered to 9 per cent. The Hungarian SME sector enjoys substantial support from the new forms of small tax- payer company forms established in 2013 (KATA, KIVA), which has been used on dynamically increasing scale due to the favourable tax conditions. The measures re- duced the tax burden on domestic companies, with tax cuts amounting to up to 2 per cent of GDP by 2018 (Baksay and Palotai, 2017).
Apart from tax cuts to stimulate growth, ensuring the balance of the general gov- ernment also required measures that provided additional resources for the imple mentation of the tax reform. Budgetary resources could not be provided through
Figure 2: Cumulative static fiscal impact of tax adjustments implemented since 2010
–6 –5 –4 –3 –2 –1 0 1 2 3 4
–6 –5 –4 –3 –2 –1 0 1 2 3 4
2010
Taxes on labour
Special taxes (on consumption) Taxes on consumption Special taxes (on capital)
Taxes on capital
2011 2012 2013 2014 2015 2016 2017 2018
percentage of GDP percentage of GDP
Source: Palotai, 2017
conventional austerity measures, as they would have in fact undermined the positive effects of tax reform on economic growth. The government thus shifted its focus towards burden sharing. The imposition of consumption and sales taxes is less det- rimental to real economic growth as these taxes do not significantly divert capital allocation and labour market decisions. In addition, sector-specific taxes can help to maintain the budgetary equilibrium while leading to a fairer and more equal distribu- tion of public burdens.
The main thrust of the tax reforms was raising the upper VAT rate from 25 per cent to 27 per cent, raising excise duty rates in several steps and reforming sector-spe- cific taxes. Apart from rate increases, the significant growth in consumption and sales tax revenues was also driven by the gradual widening of the tax bases through a variety of innovative steps for the formalisation of the economy. In the process, a prominent role was played by the introduction of online cash registers, the Electronic Trade and Transport Control System (EKÁER), and online invoicing, along with the implemen- tation of reverse VAT in some areas. As with taxes on labour, economic policy also pressed for the application of targeted allowances in the field of consumption taxes, reducing the VAT rates on certain widely uses services (Internet and restaurants) and on basic foodstuffs (milk, eggs, poultry, fish and pork) (Palotai, 2017).
The increase in the share of consumption and sales taxes was partly due to the imposition of various special taxes. A shift in the tax regime as a whole also took place
in sector-specific crisis taxes through the conversion of the special taxes levied on spe- cific sectors into consumption and sales taxes after 2013 (e.g. transaction levy, insur- ance tax, telecommunications tax, public health product tax). Service sectors with the ability to bear a greater share of the public burdens and subject to lower effective tax rates (retail, finance, insurance, energy, telecommunications) have seen their share of the public burdens gradually decrease in recent years, while the need to maintain the budgetary equilibrium has remained a priority.
Turnaround in motivation
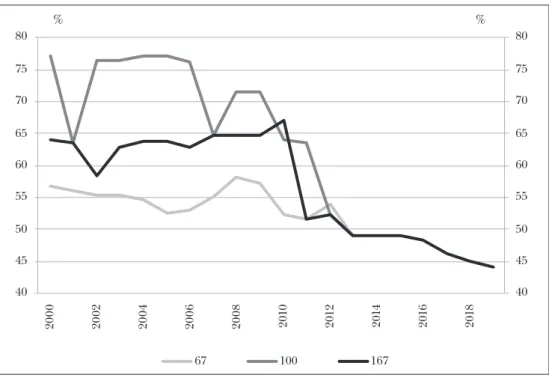
In cutting taxes on labour, one of the biggest changes was the introduction of the flat- rate personal income tax. The flat rate, first reduced to 16 per cent in 2011 and to 15 per cent in a subsequent move in 2016, was lower than both of the previous tax rates, and the abandonment of progressive taxation supported additional performance, higher labour intensity, and the accumulation of knowledge capital. The marginal tax wedge fell below its previous levels in most wage categories after the reforms in 2013 and has since decreased further as a result of subsequent cuts in taxes and contribu- tions, and due to the substantial targeted benefits available (target groups of the Job Protection Action Plan, family tax allowance) (Matolcsy and Palotai, 2016).
Figure 3: Marginal tax wedge in Hungary 67%, 100% and 167% of average earnings
40 45 50 55 60 65 70 75 80
40 45 50 55 60 65 70 75 80
2000 2002 2004 2006 2008 2010 2012 2014 2016 2018
%
%
67 100 167
Source: OECD, MNB
Turnaround in general government
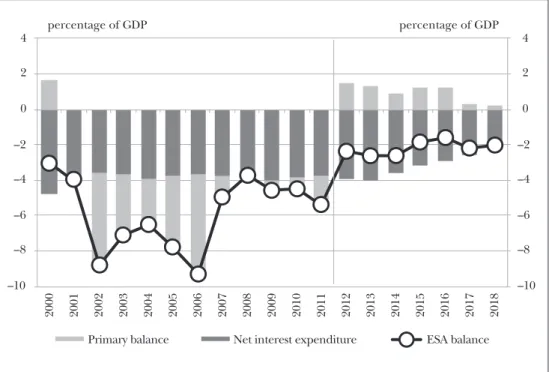
As a result of the successful fiscal turnaround, since 2012 the deficit has remained stable below the Maastricht criterion of 3 per cent. In order to assess this achievement in Hungary’s economic history, it is worth recalling that after the regime change, Hungarian economic policy was never able to bring the deficit below 3 per cent, and doing so ultimately led to the closure of the excessive deficit procedure (EDP) that had been in place against Hungary since its accession to the EU in 2004. Thanks to the fiscal turnaround, the deficit was reduced and economic growth resumed at the same time (Matolcsy and Palotai, 2016).
Figure 4: Changes in general government balance indicators
–10 –8 –6 –4 –2 0 2 4
–10
Net interest expenditure
Primary balance ESA balance
–8 –6 –4 –2 0 2 4
2000 2001 2002 2003 2004 2005 2006 2007 2008 2009 2010 2011 2012 2013 2014 2015 2016 2017 2018
percentage of GDP percentage of GDP
Note: The data do not contain the imputed interest expenditures incurred since 2012 on account of the pension system reform. The data for 2018 show the forecast in the MNB Inflation Report of December 2018.
Source: HCSO, MNB
As part of the Széll Kálmán Plan, the social benefit system, which had previ- ously been excessively lax and had in fact provided disincentives to work, was trans- formed in several stages. In addition to blocking certain fiscal expenditures, the government’s new economic policy has also curbed the indebtedness of local gov- ernments.
Closure of the excessive deficit procedure – turnaround in the EDP
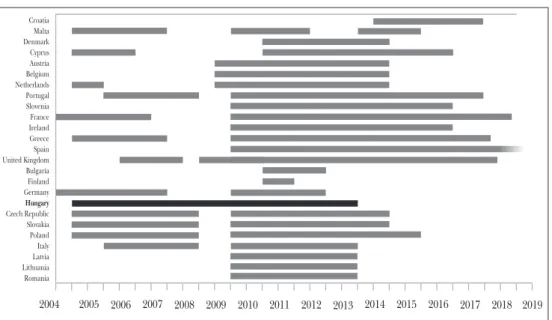
Since the year of its accession to the EU, Hungary had continuously been subject to an excessive deficit procedure. Consolidation of the fiscal balance was justified not only by an extremely high level of indebtedness, but also by the need to comply with the requirements of the European Union. Continuous violation of the rule had already compromised access to EU cohesion funds assisting convergence. Improving the gen- eral government balance and achieving the EDP closure had thus become inevitable for the reduction of vulnerability factors.
Following the successful fiscal turnaround, after 9 years the excessive deficit pro- cedure against Hungary was finally closed in 2013. The economic policy threat of the suspension of access to EU funds was eliminated, and the achievements of the successful new economic policy could no longer be questioned even internationally.
Figure 5: Excessive deficit procedures against individual countries
2004 2005 2006 2007 2008 2009 2010 2011 2012 2013 2014 2015 2016 2017 2018 2019
Croatia Malta Denmark Cyprus Austria Belgium Netherlands Portugal Slovenia France Ireland Greece Spain United Kingdom Bulgaria Finland Germany Hungary Czech Republic Slovakia Poland Italy Latvia Lithuania Romania
Source: European Commission Turnaround in public debt
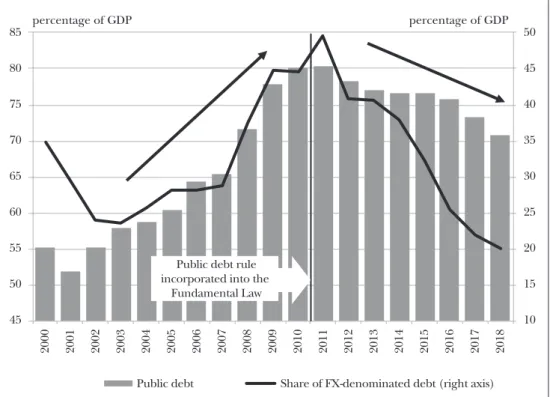
One of the objectives set for post-2010 economic policy was to break the rapidly rising trend of public debt and to set it on a downward path. The government enshrined this objective in the debt rule, elevating it to the constitutional level in the Fundamental Law adopted in 2011.
Through the sustainable consolidation of public deficit and by stimulating economic growth, the fiscal turnaround provided for the reduction of the debt
ratio, which was stabilised as a result of the measures taken by the government.
From its historic peak of over 80% in 2011, the debt ratio was reduced by over 10 percentage points by late 2018, which makes Hungary the only economy in the European Union to have recorded a steady decrease in its gross government debt as a percentage of GDP every year since 2012. This has been accompanied by a steady decrease in the foreign currency ratio of public debt, significantly re- ducing Hungary’s external vulnerability. Amounting to nearly one half of central government debt in 2011, the foreign currency ratio fell to around 20 per cent by 2018. This major reduction was partly due to full repayment of the country’s EU and IMF loans. In addition to more moderate levels of risk premiums (CDS) and sovereign market yields, Hungary’s improved standing has also been confirmed by the better ratings awarded by international credit rating agencies (Matolcsy and Palotai, 2016).
Recent years have also seen major improvements in the financing structure of public debt, partly supported, via the promotion of domestic financing, by the central bank’s Self-financing Programme launched in the summer of 2014 (see below).
Figure 6: Developments in gross public debt as a percentage of GDP and the foreign currency ratio of debt since 2000
10 15 20 25 30 35 40 45 50
45
Public debt Share of FX-denominated debt (right axis) 50
55 60 65 70 75 80 85
2000 2001 2002 2003 2004 2005 2006 2007 2008 2009 2010 2011 2012 2013 2014 2015 2016 2017 2018
percentage of GDP percentage of GDP
Public debt rule incorporated into the
Fundamental Law
Source: MNB
Turnaround in the labour market
Starting in 2008, the global crisis was accompanied by a sharp decline in corporate demand for labour, leading to a major fall in the number of persons employed. In the years following 2010, a number of government measures, mainly aimed at increasing the labour market participation rate, contributed to the recovery of the labour market from the crisis. The number of those becoming inactive was reduced by tightening the conditions of eligibility for disability pension and by gradually raising the retirement age. The reduction in the amount and duration of transfers related to the absence from employment, which may be seen as a measure to tighten the allowance system, discouraged early exit from the labour market. Facilitating the use of flexible forms of work, in particular part-time employment, supported labour market access for certain disadvantaged groups.
In parallel with the government measures to increase activity, the government also provided targeted assistance for the labour-market integration of (mostly disadvan- taged) social groups of increasing activity. Employers employing disadvantaged work- ers (e.g. the unskilled, the long-term unemployed, and people over 55) have been granted significant allowances on their contributions under the Job Protection Action Plan, the primary focus of which is to boost demand for labour. The extension of pub- lic employment programmes in 2013 facilitated access to employment for groups that had sought to enter the labour market after inactivity, but had been met with low de- mand from the primary labour market, thereby providing a major part of those groups with an adequate transition for their subsequent entry into the primary labour market.
Mainly as a result of the introduction of targeted structural measures affecting the labour market, Hungary’s activity rate has increased dynamically since 2010. The im- provement in Hungary’s relative position in terms of the activity rate is mainly attrib- utable to social groups that are at a disadvantage in the labour market: the low-skilled, young people, people over 50, and women with young children. The activity rate of these groups has increased significantly over the past nearly one decade, and the gap with the EU average has also been substantially reduced in the case of these groups.
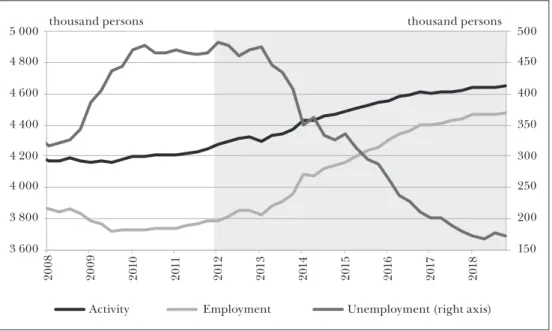
The increase in labour market participation has been accompanied by improve- ments in employment, with new active labour absorbed by the market. In 2013, em- ployment started to rise rapidly, increasing the number of persons employed by more than 750,000 compared to 2010.
As employment increased, unemployment fell to a historic low. In Hungary, the unemployment rate fell from 11 per cent in 2012 to 3.7 per cent in 2018, which is cur- rently one of the lowest rates in the European Union.
Turnarounds in monetary policy– achieving and maintaining price stability
Following the crisis of 2008–2009, successful crisis management was based on finding the right responses, as well as on coordination between key branches of economic
Figure 7: Changes in the number of active persons, persons employed and the unemployed
150 200 250 300 350 400 450 500
3 600
Activity Employment Unemployment (right axis) 3 800
4 000 4 200 4 400 4 600 4 800
5 000 thousand persons thousand persons
2008 2009 2010 2011 2012 2013 2014 2015 2016 2017 2018
Source: HCSO
policy. While the world’s major central banks helped their economies with monetary stimulus on an unprecedented scale almost immediately after the onset of the crisis, Hungarian crisis management continued against monetary headwinds up until sum- mer 2012. Monetary policy made a full turnaround with the appointment of the new central bank management in 2013. The renewal of central bank policy was also largely determined by the effective transformation of the institutional system, i.e. the integra- tion of the Financial Supervisory Authority at the end of 2013.
Cuts in the central bank base rate and their impact
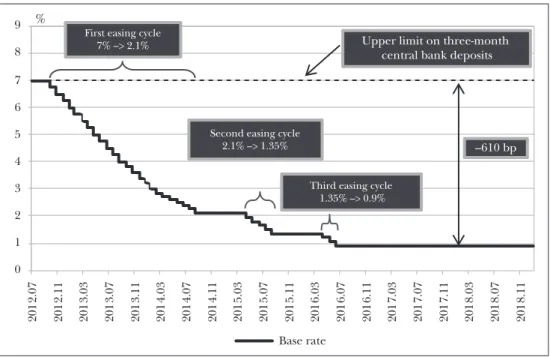
Major central banks around the world responded to adverse macroeconomic develop- ments with immediate monetary easing. The MNB launched its easing cycle in August 2012, cutting the policy rate from 7 per cent by 610 basis points to a historic low of 0.9 per cent in three steps over 4 years. Launching the easing cycle was supported by several factors. Due in part to the successful fiscal turnaround, Hungarian risk premi- ums showed a sustained improvement in investor sentiment, while a series of new eas- ing measures by leading central banks also provided for looser monetary conditions.
The central bank’s easing measures were also supported by the fiscal turnaround be- ginning in 2010, improving fiscal discipline, the declining trend of public debt, the moderation of external vulnerability, and the structural reforms aimed at stimulating long-term growth (MNB, 2017).
Figure 8: Changes in the Hungarian base rate
2012.07 2012.11 2013.03 2013.07 2013.11 2014.03 2014.07 2014.11 2015.03 2015.07 2015.11 2016.03 2016.07 2016.11 2017.03 2017.07 2017.11 2018.03 2018.07 2018.11
0
Base rate 1
2 3 4 5 6 7 8
9 %
–610 bp First easing cycle
7% –> 2.1%
Second easing cycle 2.1% –> 1.35%
Third easing cycle 1.35% –> 0.9%
Upper limit on three-month central bank deposits
Source: MNB
The policy rate was cut in a series of steps until late 2015, when the historic low of 0.9 percentage point was reached. Since then, the base rate has remained unchanged at that level. Keeping the base rate on a sustained hold was underpinned by the idea that the central bank, while easing monetary conditions, would seek to establish inter- est rate levels that were consistent with the sustainable achievement of the inflation target even over the longer term.
The central bank’s easing cycles have had significant growth effects. Substantial base rate cuts have reduced the chances of a deflationary environment emerging, and have contributed significantly to the rise in output. In addition to the positive mac- roeconomic effects of the easing cycle, the economy has remained balanced, and its external financing capacity has also been stable over time.
The easing of monetary conditions has also had an impact on financial markets.
The looser interest rate conditions have greatly reduced the interest burden on the private sector, preventing further falls in the volume of lending, consumption and investments after the crisis. It was not only the private sector that benefited from mon- etary easing; yields on short-term and long-term government securities also decreased significantly. With sovereign market yields declining, the position of general govern- ment improved as a result of falling interest expenditures. While in 2013 general government interest expenditures exceeded 4 per cent of GDP, that ratio was almost halved by 2018 as a result of the gradual repricing of HUF debt.
Transformation of the central bank toolbox, introduction of unconventional instruments In summer and autumn 2016, the Magyar Nemzeti Bank introduced a new monetary policy toolkit in whereby it carried out unconventional monetary easing while keep- ing the base rate on a sustained hold, and taking inflation developments into con- sideration. The core element of the system was the transformation of the policy in- strument by means of a quantitative restriction on the three-month deposit, through which the MNB supported lending and self-financing, and ensured a further decrease in relevant money market yields within the interest rate corridor. Implemented from 2016 Q4 onwards, the quantitative restriction was supported by the MNB cutting the O/N lending rate to the base rate, i.e. introducing a completely asymmetric inter- est rate corridor, and cutting the reserve ratio from 2% to 1%. In autumn 2016, the MNB introduced a fine-tuning foreign exchange swap (FX-swap) instrument, which provides HUF liquidity and enables the central bank to maintain a sufficient level of liquidity in the banking sector by means of weekly tenders.
As a result of introducing the quantitative restriction, the MNB’s holdings of the 3-month deposit decreased from almost HUF 2,000 billion in late September 2016 to approximately HUF 900 billion in November 2016 and to HUF 75 billion in late 2017; the instrument was then discontinued in December 2018. The banking sector’s surplus liquidity was channelled into O/N deposits, and the downward pressure on yields from crowded out liquidity was perceivable in all relevant markets. After the in- troduction of the quantitative restriction in summer 2016, yields hit the lower bound- ary of the interest rate corridor. The effective functioning of the system of quantitative restriction was supported by the fact that, at the initiative of the MNB, in May 2016 the submission system of the BUBOR (Budapest Interbank Offered Rate) was reformed, which, due to the imposition of submission requirements, brought about an increase in the volume of trading in the unsecured interbank market, along with a tangible improvement in the information content of BUBOR rates (MNB, 2017).
At its meeting in November 2017, the Monetary Council took the decision that the loose monetary conditions should have an effect on both the short and the long sections of the yield curve. To ensure this, the Council decided to introduce two un- conventional instruments from January 2018, which would constitute an integral part of the Bank’s set of monetary policy instruments. Monetary policy interest rate swaps (MIRS) were introduced as a general monetary policy instrument and the Mortgage Bond Purchase Programme (JVP) as a targeted programme, the declared purpose of which was to promote the wider use of fixed-rate mortgage loans and the develop- ment of the mortgage bond market.
Both MIRS and the Mortgage Bond Purchase Programme achieved their objec- tives. The instruments supported the extension of loose monetary conditions to long- term maturities, along with market stability, and contributed to the development of the mortgage bond market and to reducing banks’ interest rate risk and, consequent- ly, to the further spread of long-term, fixed-rate mortgage loans, where new lending increased from 61 per cent at the beginning of 2018 to about 90 per cent by the end
Figure 9: Changes in short-term yields (2016–2019)
–0.4 –0.2 0.0
3M interbank rate (BUBOR) 3M government securities yield (DTB)
Base rate
Interest rate corridor 3M FX swap implied interest rate
0.2 0.4 0.6 0.8 1.0 1.2 1.4 1.6 1.8 2.0 2.2
–0.4 –0.2 0.0 0.2 0.4 0.6 0.8 1.0 1.2 1.4 1.6 1.8 2.0 2.2
2016.01.01 2016.02.01 2016.03.01 2016.04.01 2016.05.01 2016.06.01 2016.07.01 2016.08.01 2016.09.01 2016.10.01 2016.11.01 2016.12.01 2017.01.01 2017.02.01 2017.03.01 2017.04.01 2017.05.01 2017.06.01 2017.07.01 2017.08.01 2017.09.01 2017.10.01 2017.11.01 2017.12.01 2018.01.01 2018.02.01 2018.03.01 2018.04.01 2018.05.01 2018.06.01 2018.07.01 2018.08.01 2018.09.01 2018.10.01 2018.11.01 2018.12.01 2019.01.01 2019.02.01 2019.03.01
per cent per cent
(1) BUBOR market reform
(2) Quantitative restrictions announced (3) Liquidity FX swap introduced (4) Reserve requirement ratio lowered (5) O/N deposit rate lowered
(6) Preparations for normalisation announced
Source: MNB
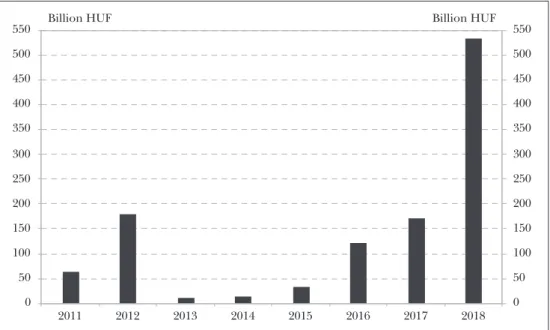
Figure 10: Gross annual market issue of fixed-rate mortgage bonds
0 50 100 150 200 250 300 350 400 450 500 550
0 50 100 150 200 250 300 350 400 450 500 550
2011 2012 2013 2014 2015 2016 2017 2018
Billion HUF Billion HUF
Source: MNB
of the year. Compared to sovereign yields, the premium on mortgage bond yields had slipped into negative territory along the yield curve until the phase-out was an- nounced, and low financing costs substantially supported new issuance. The gross issuance of fixed-rate mortgage bonds equalled the combined market volume of the previous 7 years, confirming that the programme supported the development of the mortgage bond market to a substantial extent.
Following discontinuation of the Mortgage Bond Purchase Programme, the MNB will continue to energise the mortgage bond market support banks’ access to long- term HUF funding via the use of instruments outside its monetary policy toolkit, in particular by means of regulations on the mortgage financing adequacy ratio (MFAR).1 The Self-financing Programme – towards a more stable economy
The Self-financing Programme was announced in April 2014, and during its imple- mentation the MNB transformed its monetary policy toolkit in order to channel banks’ surplus liquidity from central bank deposits to holdings of liquid securities with longer-term securities. Due to the specificities of the Hungarian securities market, this primarily translated into stronger demand for government securities. In combination, the central bank’s programme, the foreign currency repayments by the Hungarian Government Debt Management Agency, financed via HUF issues, and the coopera- tive attitude and adjustment of the banks allowed for a shift towards a healthier debt structure and a gradual decrease in external exposure (MNB, 2017).
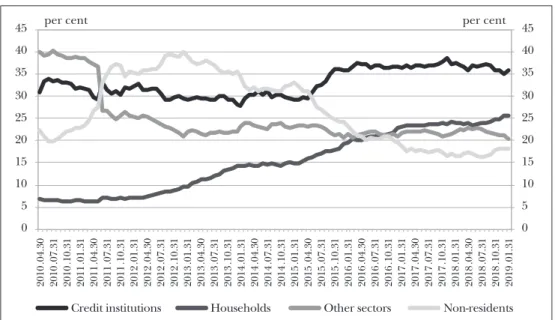
Figure 11: Holders of Hungarian public debt
0 5 10 15 20 25 30 35 40 45
0 5 10
Credit institutions Households Other sectors Non-residents 15
20 25 30 35 40 45
2010.04.30 2010.07.31 2010.10.31 2011.01.31 2011.04.30 2011.07.31 2011.10.31 2012.01.31 2012.04.30 2012.07.31 2012.10.31 2013.01.31 2013.04.30 2013.07.31 2013.10.31 2014.01.31 2014.04.30 2014.07.31 2014.10.31 2015.01.31 2015.04.30 2015.07.31 2015.10.31 2016.01.31 2016.04.30 2016.07.31 2016.10.31 2017.01.31 2017.04.30 2017.07.31 2017.10.31 2018.01.31 2018.04.30 2018.07.31 2018.10.31 2019.01.31 per cent per cent
Note: Up to December 2012, the ratio of credit institutions also includes holdings of money market funds.
Source: MNB
The central bank’s Self-financing Programme significantly reduced Hungary’s external vulnerability, strengthened its financial stability and improved its inter- national standing. Between 2014 and 2016, the year marking the end of the pro- gramme’s active phase, Hungary was able to repay nearly EUR 11 billion worth of foreign currency debt, so that sovereign market yields decreased in line with the inflation target. The foreign currency ratio of public debt shrank from 42 per cent in 2014 to 25 per cent at the end of 2016 and below 20 per cent at the end of 2018.
The Self-financing Programme played a particularly important role in the realisa- tion of finance based on domestic investors and the local currency, and its results laid the foundation for the strategic objective of bringing government debt fully under Hungarian control.
Turnaround in the central bank balance sheet – when less is more
Lower external vulnerability made possible a turnaround in the central bank bal- ance sheet, which had a positive impact on both the MNB and the national econ- omy. At the onset of the crisis, Hungary was forced to borrow from international institutions due to the unfavourable financing situation of the state, which led to an increase in the assets and liabilities of the central bank balance sheet. As a result of increased liquidity in the banking system, the bloated balance sheet generated significant interest costs for the MNB. The significant financing capacity created by the economic adjustment following the crisis, and the resulting decrease in external debt and external vulnerability, have made it possible to reduce the central bank balance through targeted programmes without compromising reserve adequacy.
This is a noteworthy development even by international standards. Indeed, after the crisis, much of the world followed the emerging trend that central banks generally increased their balance sheet totals in pursuit of their monetary policy objectives. In its monetary policy easing cycle (2008–2014) that followed the crisis, the Fed’s total assets-to-GDP ratio increased by 17 percentage points, the ECB balance sheet in- creased by 20 percentage points as a result of the asset purchases started after 2014, and that of the Czech central bank by 40 percentage points from 2013 onwards due to its bloated foreign exchange reserves. By contrast, since the start of Hungary’s turnaround in monetary policy in 2013, the MNB’s total assets-to-GDP ratio has fallen by 12 percentage points. Moreover, in parallel with the reduction of Hun- gary’s central bank balance sheet, its structure has also become more efficient due to a substantial decrease in the ratio of interest-bearing liabilities. Despite the low- yield environment, the turnaround in the central bank balance sheet has left ample room for monetary policy actions, while also improving the efficiency of monetary transmission. It is important to emphasise that, in contrast to international develop- ments, the MNB has managed to maintain loose monetary conditions even with a shrinking balance sheet (Erhart et al., 2015).
Figure 12: Changes in the main items of the MNB balance sheet as a percentage of GDP (annual averages)
–40
Sterilisation holdings (MNB bonds/deposits, O/N) Government deposits Foreign exchange reserves Reserve requirement
Cash
Other funds (e.g. foreign funds, equity) Other assets (e.g. FGS, mortgage bonds)
–30 –20 –10 0 10 20 30 40
–40 –30 –20 –10 0 10 20 30 40
2006 2007 2008 2009 2010 2011 2012 2013 2014 2015 2016 2017 2018 H1
per cent per cent
Source: MNB
Turnaround in lending – the ice breaks in a frozen credit market Corporate lending
Following the onset of the financial crisis of 2007–2008, the supply of credit in the domestic banking system dropped dramatically, with corporate lending suffering a credit crunch between 2009 and 2013 Q2 (Balog et al., 2014). In these years, as a combined result of disbursements and repayments, the volume of corporate lending contracted by an annual average of 4 to 5 per cent. Micro, small and medium-sized companies, which had only very limited access to other funding, were hardest hit by the shrinking credit volume: lending to these companies fell at an annual rate of around 4 to 8 per cent.
In SME lending, the Funding for Growth Scheme launched in 2013 broke the negative spiral and set developments on a stable growth path. With a slight lag, this trend was followed by the credit volume of the overall corporate sector; consequently, by the end of 2018 both the overall corporate credit volume and lending to the SME sector was growing at a rate above 10 per cent (MNB, 2019b).
Figure 13: Growth rate of the credit volume in the overall corporate sector and in the SME sector
–10 –8 –6 –4 –2 0 2 4 6 8 10 12 14 16
–5
Corporate sector (Quarter-on-quarter) SME sector (Year-on-year, RHS) Corporate sector (Year-on-year, RHS) SME sector including self-employed
(Year-on-year, RHS) –4
–3 –2 –1 0 1 2 3 4 5 6 7 8
2008
Q1 Q2 Q3 Q4
2009
Q1 Q2 Q3 Q4
2010
Q1 Q2 Q3 Q4
2011
Q1 Q2 Q3 Q4
2012
Q1 Q2 Q3 Q4
2013
Q1 Q2 Q3 Q4
2014
Q1 Q2 Q3 Q4
2015
Q1 Q2 Q3 Q4
2016
Q1 Q2 Q3 Q4
2017
Q1 Q2 Q3 Q4
2018
Q1 Q2 Q3 Q4 per cent per cent
Note: Transaction based, prior to 2015Q4 data for SMEs are estimated based on banking system data.
Source: MNB
Introduction of the Funding for Growth Scheme
Short of bank financing, Hungarian-owned enterprises in the SME sector were hit particularly hard by banks’ restrained willingness to lend and by rising risk premiums, which increased the risk of the credit market freezing.
In June 2013, the central bank launched the Funding for Growth Scheme (FGS) as a new targeted instrument in its monetary policy toolkit designed to mitigate the protracted disturbances in lending to SMEs, provide a stimulus to the economy and strengthen financial stability. Under the FGS, the central bank provided refinancing loans at a 0% interest rate to credit institutions, which could pass these loans on to SMEs with an interest margin capped at 2.5% and maturities of up to 10 years. This provided a very favourable and predictable financing option, without any exchange rate risk.
The FGS was launched in June 2013, and its first phase, spanning a mere three months, accomplished its short-term objectives, i.e. to ease credit market constraints and boost competition between banks. With a view to achieving a stronger growth effect, in the second phase of the scheme the focus shifted to new lending, and to in- vestment loans in particular, with only limited room for loan redemptions. In autumn 2015, the MNB decided to phase out the FGS, since the objectives set at the start of the programme had been successfully achieved. In line with the intended phase-out, the third phase was even more targeted than the previous two. On the one hand, it
enabled HUF-based funding for investment purposes only, while SMEs secured by a natural foreign currency hedge also gained access to foreign currency funding, which had not been available in the previous phases.
Figure 14: Distribution of loan purposes in the different FGS phases
177
833 685
1 695
115
390
505
129
129
409
73
482
0 500 1 000 1 500 2 000 2 500 3 000
0 500 1 000 1 500 2 000 2 500 3 000
FGS1
New investment loans
Loans for pre-financing EU funds
New working capital financing loans Loan redemptions
FGS2 FGS3 FGS total
billion billion
701 billion HUF
2,811 billion HUF
685 billion 1,425 billion HUF
Note: the data for the second phase of the FGS include the loans extended under the FGS+ scheme, worth HUF 23 billion, which ran in parallel with the FGS.
Source: MNB
Over the approximately four years until March 2017 during which the FGS was op- erational, almost 40,000 domestic businesses gained access to more than HUF 2,800 billion worth of funding in the three phases of the scheme combined. Of this, nearly HUF 1,700 billion was used to finance investments. In addition to improving access to credit for SMEs, the programme has also had a significant indirect impact by restor- ing a previously malfunctioning credit market, which has provided a further lasting contribution to economic growth (MNB, 2018a).
Introduction of the Market-Based Lending Scheme
Against the backdrop of the gradual phase-out of the FGS, in parallel with its third phase, the Market-Based Lending Scheme (MLS) was launched at the beginning of 2016 to promote market-based lending without central bank refinancing.
Figure 15: Growth rate of the credit volume in the SME sector
–10 –8 –6 –4 –2 0 2 4 6 8 10 12 14 16 18 20
–10
Actual SME lending dynamics Protracted decline in SME lending –8
–6 –4 –2 0 2 4 6 8 10 12 14 16 18 20
2008
Q1 Q2 Q3 Q4
2009
Q1 Q2 Q3 Q4
2010
Q1 Q2 Q3 Q4
2011
Q1 Q2 Q3 Q4
2012
Q1 Q2 Q3 Q4
2013
Q1 Q2 Q3 Q4
2014
Q1 Q2 Q3 Q4
2015
Q1 Q2 Q3 Q4
2016
Q1 Q2 Q3 Q4
2017
. Q1 Q2 Q3 Q4
2018
. Q1 Q2 Q3 Q4 per cent per cent
FGS
First phase
Second phase
Third phase
Source: MNB
To support lending activity, the MLS employed a combination of two central bank instruments. interest rate swaps conditional on lending (LIRS), and the preferential deposit facility. The LIRS provided banks with a means to hedge the interest rate risk on their long-term SME loans, whereas by accessing the instrument, banks undertook to step up their net lending to SMEs by at least a quarter of the transaction value during the term of the transactions, i.e. over a period of 3 years. Under the preferential deposit facil- ity, the central bank offered credit institutions concluding LIRS contracts the option to earn interest on a larger part of their liquidity at the central bank base rate (MNB, 2015).
The SME lending increment undertaken in the first phase of the MLS in 2016 amounted to approximately HUF 200 billion, corresponding, at the level of the na- tional economy, to a 5-per cent increase in the overall SME credit volume. Under the second phase of the MLS, launched in July 2017, banks continued to increase their SME lending commitments for 2017 (MNB, 2019b).
Introduction of FGS Fixed
Although by 2018 corporate lending had reached an adequate level in terms of dy- namics, its structure was still not healthy enough. The distribution of maturities of
Figure 16: Fulfilment of the lending commitments made under the Market-based Lending Scheme
0 5 10 15
Fulfilment relative to SME lending
20 25 30
0 5 10 15 20 25 30
2016
Lending commitments relative to SME lending 2017
% %
Significant overfulfilment
Overfulfilment
Source: MNB
SME loans shifted towards shorter terms, accompanied by another major fall in the ratio of fixed-rate loans.
For that reason, following its decision to reintroduce an instrument that had al- ready achieved significant results and had a positive impact on the volume and struc- ture of lending, in early 2019 the MNB launched a new version of the FGS with an allocated budget of HUF 1,000 billion. The new scheme, announced under the name of FGS Fixed, is identical with earlier phases of the FGS in terms of key parameters and the method of implementation, except that it is even more targeted. It is avail- able for investment purposes only, for maturities of at least 3 years. As a new feature, the programme is liquidity neutral given that banks’ surplus liquidity resulting from the credit volume disbursed under the FGS Fixed is sterilised through preferential deposits at the base rate (MNB, 2018a).
Household lending
Following the onset of the crisis, households’ attitudes to borrowing were determined by the pursuit of prudence and debt reduction. Accordingly, credit institutions’
household credit volume decreased steadily between 2010 and 2016, in which a major
Figure 17: Breakdown of new HUF corporate loan contracts of up to EUR 1 million by interest rate fixation period
0 20 40 60 80 100
0
Interest rate fixation for more than 5 years Interest rate fixation for 1 to 5 years
Variable interest or interest rate fixation for up to 1 year 20
40 60 80 100
2010-01-01 2010-04-01 2010-07-01 2010-10-01 2011-01-01 2011-04-01 2011-07-01 2011-10-01 2012-01-01 2012-04-01 2012-07-01 2012-10-01 2013-01-01 2013-04-01 2013-07-01 2013-10-01 2014-01-01 2014-04-01 2014-07-01 2014-10-01 2015-01-01 2015-04-01 2015-07-01 2015-10-01 2016-01-01 2016-04-01 2016-07-01 2016-10-01 2017-01-01 2017-04-01 2017-07-01 2017-10-01 2018-01-01 2018-04-01 2018-07-01 2018-10-01 2019-01-01
FGS
billion HUF billion HUF
Source: MNB
role was occupied by government programmes (preferential full early repayment, and settlement of unilateral interest rate increases and exchange rate margins).
In terms of new contracts, lending reached its low point in 2012 and 2013. In these years, the annual volume of new retail lending was just over HUF 300 billion, representing a drastic drop compared to the HUF 2,000 billion contracted in 2008.
However, from 2013 onwards, the retail credit market started to recover gradually as growth picked up in the real economy and incomes. In 2018, total new retail lending reached HUF 1,500 billion, with the overall household credit volume increasing by more than 7 per cent. In 2018, the housing loan market, which plays a particularly important role in retail lending, reached pre-crisis levels in nominal terms in terms of new contracts. In addition, current new lending is accompanied by a far greater vol- ume of maturing loans; consequently, a similar contract volume amounts to a much lower rate of debt growth across the sector.
This becomes evident when looking at household debt as a percentage of GDP:
while this indicator stood at 31 per cent after the onset of the crisis (exceeding the readings of several countries in the region), the ratio of household debt to GDP is cur- rently below 15 per cent, which is one of the lowest in the European Union.
Figure 18: Household credit-to-GDP in an international comparison
0 10 20 30 40 50 60
0
Euro area Slovakia
Czech Republic Hungary
Poland 10
20 30 40 50 60
2004 Q1 Q3 2005 Q1 Q3 2006 Q1 Q3 2007 Q1 Q3 2008 Q1 Q3 2009 Q1 Q3 2010 Q1 Q3 2011 Q1 Q3 2012 Q1 Q3 2013 Q1 Q3 2014 Q1 Q3 2015 Q1 Q3 2016 Q1 Q3 2017 Q1 Q3 2018 Q1 Q3
per cent per cent
Source: ECB, MNB
The healthy growth of household lending is ensured, among other things, by the debt brake rules applied as of 2015 to maximise payment to income and LTV ratios, and by the predominance of loans with rates fixed for longer periods in new lending (MNB, 2019a). In the latter process, an important role was occupied by the introduc- tion of the Certified Consumer-Friendly Housing Loans, which provided consumers with calculable terms of borrowing, while increasing competition through the easier comparability of bank offers. By the end of 2018, the share of CCFHL products had risen to over 60 per cent within loans with interest rates fixed for over 5 years. These rules enable household debt to grow so that debt is spread over the balances of a higher number of households, which in turn makes it less vulnerable to unexpected changes in the economic environment.
Turnaround in foreign currency debt – against the trap of foreign currency loans
Foreign currency lending to households proved to be one of the most damaging and costly episodes in the history of Hungary’s financial sector since the regime change.
Foreign currency loans carried significant macro-financial risks, which substantially increased Hungary’s vulnerability. The HUF conversion of foreign currency loans was therefore a key economic policy objective, which, however, could only be accom- plished in 2014–2015. The reason was that the conditions for a conversion that was free of any financial tensions were only in place by that time. These were: