THE STRESS TESTS OF CENTRAL COUNTERPARTIES IN THE CASE OF SEPARATE DEFAULT FUNDS
Planning the default fund and calculating its size1
Melinda Friesz – Kira Muratov-Szabó – Andrea Prepuk – Kata Váradi2
ABSTRACT
The crisis of 2008 pointed out the weaknesses of the current financial system.
Since then, the role of central counterparties (CCP) has become increasingly im- portant. CCPs provide guarantee, i.e., they take over the counterparty risk aris- ing in the course of trading on different markets and guarantee the settlement of transactions. To fulfil this role, the CCP has to maintain financial resources which, in the event of the clearing member’s default, are sufficient to cover the arising losses. For this purpose, the CCP operates a guarantee system, one el- ement of this is the clearing members’ contributions to the default fund. Our study focuses on the structure of the default fund operated by the CCP, as well as the stress test used for the calculation of the size of it. The results point out that we cannot rely solely on historical data when calculating the default fund.
It is evident that excluding the outlier results, which are so-called “extreme but plausible,” and building the default fund exclusively on historical data could be misleading, and the system could suffer unexpected and significant losses. Based on the risk mentioned above, hypothetical scenarios must be considered in the course of calculation so that the CCP can be prepared for unexpected losses.
JEL codes: G23, G28, G32
Keywords: central counterparty, default fund, EMIR, GBM, stress test
1 This study was prepared in the framework of “From a Talent into a Young Researcher” No.
EFOP-3.6.3.-VEKOP-16-2017-00007, a programme supporting research careers.
We are grateful to KELER CCP for the professional support and consultation. The study de- scribes the authors’ views, which do not necessarily reflect the point of view of KELER CCP.
2 Melinda Friesz, Ph.D. student, Department of Finance, Corvinus University of Budapest, KELER Ltd. E-mail: szodorai.melinda@keler.hu.
Kira Muratov-Szabó, MSc student, Department of Finance, Corvinus University of Budapest, KELER CCP Ltd. E-mail: muratov.kira@gmail.com.
Andrea Prepuk, Msc student, Department of Finance, Corvinus University of Budapest. E- mail: prepuk.andreaa@gmail.com.
Kata Váradi, Associate Professor, Department of Finance, Corvinus University of Budapest.
E-mail: kata.varadi@uni-corvinus.hu.
1 INTRODUCTION
The economic crisis of 2008 exposed the vulnerability of the financial system, drawing attention to the urgent need to increase the stability of the financial sys- tem. Directing the clearing of OTC (over-the-counter) derivatives under the cen- tral counterparties (CCPs) is one of the key points of the regulatory background.
The clearing activity of the central counterparty means that, in the course of trad- ing, it takes over the counterparty risk of the clients by becoming each seller’s buyer and each buyer’s seller during the transactions. Accordingly, if any of the partners fails to perform, the CCP guarantees the completion of the transaction for the non-defaulting member. To cover the losses arising from the default of one or more clearing members, the CCP has to provide sufficient financial resources, which is executed by operating the guarantee system. This system has three im- portant elements: the initial margin or margin; the so-called skin-in-the-game, which refers to the equity of the CCP allocated for this purpose; and the com- mon default fund. The default fund can be considered to be common, because the contribution of the non-defaulting members to the default fund can be used for covering losses (Murphy, 2017), while, in the case of the initial margin, it cannot.
Our study focuses on the calculation method of the default fund, exclusively con- sidering the results of stress tests. The various methodologies of the calculation of the default fund were comprehensively compared by Deák (2019), taking into account the specialties of the Hungarian market. The strong market position of CCPs, which is backed up by several studies, is inarguable (Markose et al., 2012;
Cont, 2017). Such market infrastructures reduce counterparty risk and can resist even under “extreme but plausible” market circumstances, therefore the size of the default fund is usually determined employing calculations based on stress tests. At the same time, the default of the central counterparty itself may pose a system-level risk, which might weaken the resilience of the economy or even lead to economic collapse, which would have a dramatic effect on financial stability (Duffie et al., 2015).
The study has the following structure: in the second part, the regulatory back- ground and the findings of previous research are presented. The third part pro- vides a deeper insight into the applied model. The following fourth part is dedi- cated to the description and interpretation of our findings, and then the fifth part contains the conclusion of the study.
2 LITERATURE
2.1 Central clearing
Due to a process called novation, the contractual obligation between the trad- ing parties can be substituted by two equivalent positions between the original trading parties and the clearinghouse (Capponi et al., 2018). As a result, the CCP becomes each seller’s buyer and each buyer’s seller (KELER KSZF, 2019).
Substituting certain bilateral transactions by multilateral netting, central clear- ing can reduce the clients’ exposures and isolate the participating partners (clear- ing members) regarding each other’s default, thus preventing the domino effect among market participants (Cont, 2017).
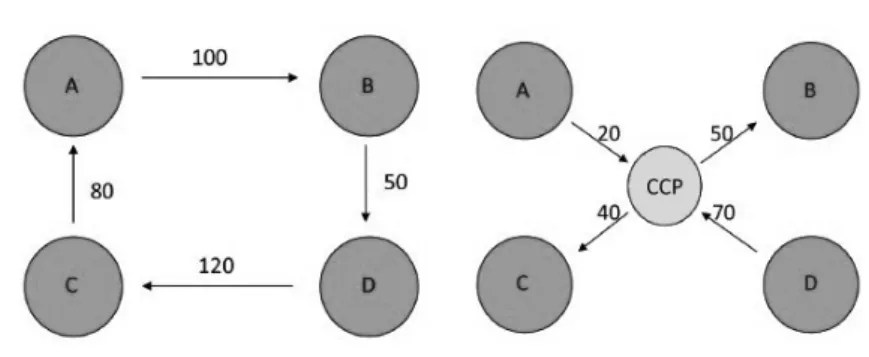
Figure 1 illustrates the interdependence of exposures and their effect in the case of contingent default. In addition, it also shows how the existence of the clear- inghouse transforms the exposures and the interdependence of the partners. For example, supposing that participant “A” cannot pay 100 units to participant “B,”
“B” will not be able to pay to “D,” and so on. If the CCP appears between the par- ticipants, on the one hand, it decreases the members’ exposures by netting their positions (e.g., participant “B” receives 50 units instead of expecting 100 units and paying 50 units), on the other hand, the CCP eliminates counterparty risks besides guaranteeing the settlement of centralised exposures.
Figure 1
Bilateral and multilateral netting
Source: Cont, 2017
2.2 Regulatory background
Risk sharing is a vital point of the central counterparty’s strategy. Several re- searchers have dealt with this topic (e.g., Murphy et al., 2016). Research shows that the risk management of banks and the central counterparties tends to influ- ence the risk of the financial system. Armenti et al. (2018) also point out that as a result of their loss, central counterparties also affect the financial system. Biais et al. (2012) explain the risk-sharing effects of the central clearing activity and examine the arising moral hazard problems. Based on this, it is confirmed that central counterparties do not provide a full guarantee against credit risk. In their article published in 2016, they prove that with central clearing, guarantee require- ments can keep risk prevention incentives by promoting the optimal level of risk monitoring and exploiting the mutual benefits of risk-sharing.
Many researchers draw attention to the risk posed by the central counterparties, as they are expanding and increasingly becoming integral parts of our everyday life. They are criticised for growing too big and may be classified as “too-big- to-fail” (Cont, 2015, Berlinger et al., 2018). Markose (2012) introduced the term
“too-interconnected-to-fail,” which means that they become dangerous due to excessive interconnection.
The authorities paid particular attention to strengthening the global framework of central clearing. As a result, the Dodd–Frank Wall Street Reform and Consum- er Protection Act was published in the United States of America in 2010, regulat- ing, inter alia, the operation of CCPs. In Europe, the EMIR (European Market Infrastructure Regulation) came into effect in 2012. Even though the EMIR pri- marily applies to the CCPs of the European Union, several CCPs outside Europe, such as ICE Clear Canada, hold an EMIR license, as well (ESMA, 2019b). Our study focuses on the European regulation; therefore, we present the requirements regarding the risk management of CCPs based on the EMIR.
Article 48 of the EMIR details the fundamental obligations of the central counter- party regarding the default management. The elements of the guarantee system are guarantees available to the central counterparty, which can be liquid assets pursuant to Article 46 of the EMIR. In the case of default(s), these guarantees can be applied in the order prescribed by Article 45 of the EMIR. Figure 2 represents the elements of the guarantee system, the so-called “default waterfall” (Article 4 of the EMIR):
Figure 2
The order of the application of the elements of the guarantee system
Source: own editing
When covering losses, the primary sources available are the initial margin and all the free guarantees of the defaulting member (e.g., in the case of KELER CCP, the basic financial collateral that the clearing members have to pay before enter- ing the market to be able to start trading (KELER CCP, 2019b). In order to limit credit risk, the CCP not only determines and manages the initial margins for the clearing members but also collects them. As Figure 2 shows, the CCP is entitled to use only the initial margins of defaulting parties to cover losses, but it does not have the right to use those of non-defaulting members. The initial margin aims to cover losses under normal market conditions. Under Article 41 of the EMIR and Chapter VI of the regulatory technical standards (RTS, 2013), the initial margins shall be sufficient to cover potential losses estimated by the CCP by the liquida- tion date of the positions. As stock exchange transactions are executed in T + 2 days, the liquidation period is two days. This should be enough to cover the losses of at least 99% of the exposures, including the stressed period estimated based on the retrospective period of 250 days. The regulator does not define this stressed period. The central counterparty shall monitor the coverage level regularly and review it if required to ensure that it reflects current market conditions, taking into account possible procyclical effects in the course of reviews. (Article 41 [1] of the EMIR, 2012). Among others, Berlinger et al. (2018; 2019) paid more attention to the methods of dealing with procyclicality.
The second available level consists of the default fund contributions by the clear- ing members. Such contributions aim to enable the CCP to cover those losses that were not covered by the initial margin. CCPs tend to grasp these market events through stress tests, by applying historical scenarios (a period in the past char- acterised by significant volatility) and hypothetical (potential future) scenarios.
Default fund contribution of the non-defaulting members Dedicated own resources of the CCP
Default fund contribution of the defaulting member(s) Initial margin of defaulting member(s)
As Figure 2 indicates, the default fund also provides cross-guarantee between the parties (clearing members). However, the non-defaulting parties’ default fund contribution can be applied by the CCP on the fourth level. The size of the default fund is determined by the max (1;2+3) principle. Based on this, the default fund should be sufficient to manage the default of the clearing member that has the largest exposure or that of the clearing members with the second and third larg- est exposures, even under extreme but plausible market conditions, if the total exposure of the latter two is larger. Payments to the default fund are proportion- ate to the exposures of the individual clearing members (Article 42 of the EMIR, Chapter VII of the RTS).
If the two sources mentioned above of the defaulting party are entirely exhaust- ed, the use of the CCP’s dedicated own resources, i.e., the junior tranch, takes precedence over the default fund contributions of non-defaulting members in the structure of the guarantee system. Therefore, the mutual sharing of losses and the default fund contributions by non-defaulting members are used only after the CCP’s own funds (Markose et al., 2017). If all of these sources have run out and additional sources are needed, the next step is the senior tranch, the CCP’s other financial resources. It is not included in Figure 2, because the law does not require it, but appears in the practice of some CCPs, such as KELER CCP (KELER CCP, 2019c). Should those mentioned above, other financial resources not be enough, the recovery and resolution tools should be used (Cont, 2015).
In addition to the structure of the guarantee system, the EMIR also prescribes that, in order to fulfil its role, the central counterparty shall maintain liquid sources which can absorb potentially arising losses in the event of default by the two clearing members with the largest exposures. In other words, the four levels in Figure 2 shall meet this criterion. The provision above is known in the literature as the “Cover 2” rule.
Our study focuses on the examination of the default funds and the fact of cross- guarantee between the clearing members, which can be calculated using stress tests. The use of the method is justified by the fact that the default fund is linked to the result of the stress tests in the risk management system of several central counterparties (KELER CCP, 2019a). The stress tests are developed and the size of the default fund is calculated according to the above-mentioned Article 49 of the EMIR and its regulatory technical standards, taking into account the manage- ment of the default by the clearing members with the largest exposures.
2.3 Stress tests
Stress tests are techniques to measure the effects of events causing rare but sig- nificant losses that are immeasurable by traditional tools on financial institutions (Madar, 2010). Typically, institutions and regulators define independent event systems, outline the changes in risk factors, then calculate the amount of losses suffered through various scenarios. The accurate process of the preparation of stress tests is detailed by Hilbers and Jones (2004). Such tests have two purposes:
on the one hand, to ensure that the appropriate sources are available at the level of the individual institutions, on the other hand, which is even more critical, to en- able the identification of system-level risks in financial markets. Stress tests have several types according to the following classification principles:
1) complexity: sensitivity analysis or scenario building (BCBS, 2009a), 2) source of scenarios: historical or hypothetical (Hull, 2015),
3) number of considered risks: one or more risk factors (Banai et al. 2013), 4) number of the examined assets,
5) time horizon of the examination: analysis of a few days or even several years, 6) bottom-up or top-down analysis (DNB, 2017; MNB, 2016),
7) analysis of individual institutions or the entire financial system (Cihák, 2007).
2.3.1 Literature on stress tests
As central counterparties were gradually expanding and becoming one of the pil- lars of the financial system, they opened a new field for researchers, as well. The regulatory framework may be vague in many respects; therefore, several stud- ies aim to expand knowledge in order to find the most appropriately applicable methods and models for CCPs and regulators. Numerous models have been de- veloped to define the appropriate methodology of stress testing.
Canabarro (2013) focuses on the execution of company-specific stress tests and the planning of stress test scenarios. The study concentrates on the macroeco- nomic, market, credit, partner, and operational risks. The interconnection of fi- nancial markets was also analysed by Battiston and al. (2016), as well as by Iori et al. (2006). They proved that the effect of a potentially adverse event spreads among financial institutions through the ownership of common assets, by direct and indirect exposures.
Poce et al. (2018) studied the adequacy of the default fund in terms of the stress test in a network framework. The network of the clearing members was analysed based on their bond market concentration, considering direct exposures to each other. Their main finding was that the calculation of the size of the default fund
for covering insolvency was not prudent enough only when the default of the two largest clearing members was taken into account, and only very conservative default funds, which cover the exposure of several clearing members, are suitable for restraining the spill-over effect of the stress.
Capponi et al. (2018) developed a central clearing model, and they proved that the current standard for collecting the default funds - the rule of members with the largest exposure - was basically vulnerable. In their model, they demonstrate that, instead of covering the default by a specific number of members, the clear- inghouse should use the entire default fund contribution to cover the specific part of the arising losses. The currently effective coverage standards are proved to be optimal only in the case of sufficiently high default funds and marginal alterna- tive costs. Otherwise, if costs are low, the rule is not strict enough, as it results in excessive risk-taking by the clearing members.
Paddrik and Young (2017) studied that the simultaneous default of two members can contaminate the network and further lead to insufficient funds at the central counterparty. Menkveld (2017) pointed out that crowded trading carried out by dealers may strengthen the losses of central counterparties in stressed scenarios.
According to Campbell and Ivanov (2016), losses may be more severe if the expo- sures of large clearing members correlate positively than if they were independent.
Ghamami and Glasserman (2017) found that the requirements of lower default funds reduce clearing costs. However, they are less flexible for central counterpar- ties. Barker et al. (2016) analysed the use of default funds, the financing liquid- ity requirements of the individual clearing members, and the negative effect of market turbulences on the clearing members. According to their main finding, liquidity is the most important element regarding risks and costs.
2.3.2 EU-level stress tests
Both banks and CCPs can be considered systematically important financial in- stitutions, therefore regulatory authorities conduct regular EU-wide stress tests in case of both institution types. Regarding the comparison of stress tests, the
“specialties” of CCPs are important in comparison with banks, which, according to Berlinger et al. (2016) affect their risk management models:
1) high-level specialisation, 2) symmetric exposures, 3) balanced position, 4) cross-guarantee system, 5) deposit dependency, 6) dynamic risk management.
One of the objectives of EMIR is to promote central clearing and ensure the safe and stable operation of CCPs. In the case of central counterparties, the European Securities and Markets Authority (ESMA) initiates and coordinates stress tests all over the EU. The latest was published in February 2019 (ESMA, 2019). In coopera- tion with local authorities, ESMA applies common methodologies for the assess- ment of the effect of different stress scenarios and identifies the shortcomings in the resilience of the institutions.
In the course of the tests, they pay special attention to credit-, liquidity- and concentration risk, as well as reverse credit tests. The latest results published by ESMA in 2017 show that the performance of the central counterparties had improved since the first test. According to their communication, ESMA is still committed to the further improvement and development of the methodology and scope of the CCPs’ stress tests in future practices. (ESMA, 2018).
Hereunder, we present our model, which includes the method used for setting the margin requirements, the applied stress test and the methodology of price modeling.
3 METHODOLOGY
Our model has the following structure. We have one CCP that clears on the spot and the derivatives markets. Two financial instruments are available: a stock and a currency. On the spot market, only stocks can be traded, while on the deriva- tives market, both call and put options and futures contracts are available for both financial assets. The strike price and maturity date of derivatives are the same for all types. In the case of the two markets, the margin and the size of the default fund are calculated separately through the simulations.
The logreturn of the two available instruments follows arithmetic Brownian mo- tion (ABM):
(1) where dY represents the change in the logreturn over a period of time (dt), is the expected value of the logreturn, σ is the standard deviation of the logreturn and N(0,1) is a standard normal random variable.
The price is calculated as follows:
(2)
where t represents time, while S indicates the price of the instrument. By this method, we simulate the prices for 7500 days, namely 30 years, in accordance with the regulation in the EMIR, in which the Technical Standard prescribes the run- ning of stress scenarios for the past 30 years (RTS, Article 30).
We also assume that the prices of the two financial instruments are correlated.
This supposition is incorporated into the model by the Cholesky decomposition.
The connection between random variables is described by the following relation- ship, in which is a random number from the ABM of the currency ρ and is the correlation between the logreturn of the stock and the currency:
(3) We also simulate stresses in the time series of the instruments. The appearance of shocks follows a Poisson process, while the size of shocks is modeled with lognor- mal distribution. The parameters of the model is summarised in Table 1.
Table 1
Parameters of price simulation
Stock Currency
The parameters of the arithmetic Brownian motion
α 10% 5%
σ 15% 10%
S0 EUR 1000 EUR 1000
dt 1 day 1 day
Parameters affecting the shock value
µ –20 –20.6
standard deviation 0.7 0.8
petering out of the shock 0.97 0.99
Parameters affecting the time of the shock
λ 0.005 0.0045
Source: own editing
In case of a shock, the correlation increases to 0.9, and its value is decreased by 5%
every day – keeping the minimum value of correlation at the level of 0.5.
Figure 3 shows one realisation of the simulations of the stock price and the shocks respectively:
Figure 3
A realisation of the stock and currency prices and a realisation of the shocks
Source: own editing
On the market, there are four clearing members with different positions. Accord- ing to our definition, considering their opposite directions, they net each other to zero on the whole. Table 2 summarises their positions.
Table 2
Position of clearing members
Clearing members CM1 CM2 CM3 CM4
Asset Stock Currency Stock Currency Stock Currency Stock Currency Name of the
position Long straddle + spot Long straddle Protective put Futures Covered call + short put Short straddle Spot –
Long put 3 5 2
Short put 5 5
Long call 3 5
Short call 3 5
Long futures 5
Short futures 5
Long underlying 4 2 3
Short underlying 9
Source: own editing
-2E-08 -1,5E-08 -1E-08 -5E-09 0 5E-09 1E-08
0 2000 4000 6000 8000 10000 12000 14000
1 146 291 436 581 726 871 1016 1161 1306 1451 1596 1741 1886 2031 2176 2321 2466 2611
2756 2901 3046 3191 3336 3481 3626 3771 3916 4061 4206 4351 4496 4641 4786 4931 5076 5221 5366 5511
5656 5801 5946 6091 6236 6381 6526 6671 6816 6961 7106 7251 7396
EUR
Days
Stock prise Currency prise Shock - stock Shock - currency
We calculated the margin of the underlying products with the method of Béli and Váradi (2016), while we applied the SPAN (Standard Portfolio Analysis of Risk) system for calculating the portfolio-level margin, whose operation is sum- marised in Figure 4. In our model, we calculate only with the risk array and the short option minimum (SOM), which amounts to 10% of the margin value of the underlying product.
Figure 4
The elements of the SPAN margin
Source: Balázs, 2014, based on the CME SPAN, according to the terminology used by KELER CCP
Concerning the portfolio, risk array includes the scenarios summarised in Ta- ble 3, where regarding price change, one unit refers to the value of the current margin, i.e., the prices have to be moved by 1/3, 2/3, 3/3, 6/3 of the margin in the individual scenarios. Volatility change was supposed to be 90%, i.e., the value of the current standard deviation is increased or decreased by 90% according to the signs indicated in the individual scenarios. Based on this, positions are revalued according to the new prices of underlying products and new standard deviations.
The margin of the portfolios of the individual clearing members is be calculated based on the scenario with the biggest loss. Balázs (2014) expounds the operation of SPAN in a more detailed manner.
The highest value gives the SPAN requirementrisk
Risk array Inter-month (or intra-
commodity) spread Spot (delivery)
month charge Inter-commodity
spread credit Short option
minimum (SOM)
Table 3
Parameters of SPAN scenarios
Scenario Price change Volatility change
1 0.00 1
2 0.00 –1
3 0.33 1
4 0.33 –1
5 –0.33 1
6 –0.33 –1
7 0.67 1
8 0.67 –1
9 –0.67 1
10 –0.67 –1
11 1.00 1
12 1.00 –1
13 –1.00 1
14 –1.00 –1
15 2.00 0
16 –2.00 0
Source: Balázs, 2014
In order to calculate the size of the default fund, we have to run stress tests. We apply six different stress scenarios, and, in the case of each clearing member, we calculate whether, in the event of default, their margin is enough to cover their losses arising from price change or not on the 7500th day of running. We chose the 7500th day, as the EMIR prescribes that stress tests have to encompass a pe- riod of 30 years. In accordance with the regulation in the EMIR, the size of the default fund is determined by the scenario, which shows the highest loss of the max(1;2+3) exposures. Parameters of the stress scenarios:
− 4 historical scenarios
1 & 2: Min/max stock: the lowest/the highest return on stock over the period of 7500 days and the return on the currency on the appropriate days;
3 & 4: Min/max currency: the lowest/the highest return on currency over a period of 7500 days and the return on stock on the appropriate day.
− 2 hypothetical scenarios 1: stock 5%, currency –5%;
2: stock -5%, currency 5%.
As a final step, the division of the default fund (DF) among clearing members (CM) is proportionate to their margin payments:
(4)
4 ANALYSIS OF THE RESULTS
The simulation has been run 101 times. Figure 5 shows the sizes of the default funds, displaying all the 101 realisations.
Figure 5
Size of the default fund
Source: own editing
On the whole, it can be stated that the average size of default funds is 7 385.39.
However, based on the figure illustrating the 101 events of running, it is striking that even five extraordinary, outlier events appear. In the case of outlier events, the size of the default fund exceeds 20 000, more than the double of the average size. Figure 6 represents the funds following the removal of outliers from our data series. This figure still shows great differences between default fund sizes. How- ever, these differences are not so radical than those in Figure 5.
Realizations
EUR
Figure 6
Size of the default fund following the cleaning of the data series
Source: own editing
The total and the cleaned data series can be compared quantitatively as well as qualitatively.
Table 4
Comparison of the results of the total and cleaned data series
Total result Cleaned result Total/Cleaned
Minimum 342.40 342.40 1000
Maximum 104 670.14 18 209.94 5748
Average 7 385.39 4 931.37 1498
Standard deviation 12 768.63 4 369.44 2922
Source: own editing
As the only difference between the two data series is the removal of outliers, so the minimum value of the default funds is the same in both cases. Based on the minimum, it can be stated that its value was never zero, i.e., in all simulated cases, the defaulting members’ margin was not enough to cover the losses. Our results do not reveal what percentage of this constitutes the default fund contribution of the defaulting party and what percentage is attributable to the non-defaulting parties. It will be subject to further research.
At the same time, the maximum shows huge differences between the whole sim- ulation and the database containing the cleaned results. The maximum of the outlier values (104 670.14) is almost six times higher than the maximum of the
Realizations
EUR
cleaned data series (18 209.94). The average follows a similar pattern: the average of the 101 events of the raw data series is 7 385.39, which is almost one and a half times higher than the average of the cleaned data series. Standard deviation be- haves as a kind of uncertainty indicator, therefore it is a fundamental character- istic of our results. Based on Table 4, it is observable that the standard deviation of the entire data series (12 768.63) is almost three times higher than that of the cleaned data series (4 369.44).
In the light of the information above, it is understandable that disregarding outli- ers, extreme but plausible scenarios and calculating the size of the default fund solely based on historical data can be misleading, and the system may face un- expected, but significant losses. Alfaro and Drehmann (2009) emphasise the im- portance of stress tests, arguing that their use enables the detection of currently identified risks, excluding possible past effects. At the same time, they also con- firm the importance of past benchmarks. However, they prove that the historical perspective is not always sufficient. On the other hand, they believe that, in the period before the crisis, a hypothetical stress scenario of 300 basis points would not have passed the credibility test. Cont (2015) stresses the significance of the ap- plication of hypothetical scenarios, as they help the CCP to prepare for extreme but plausible losses.
The structure of the whole guarantee system should be subject to further research.
It would worth examining the actual data in an international context, as well.
5 CONCLUSION
Following the presentation of the regulatory framework, we described the oper- ating principles and assumptions of our model. The margin requirements were calculated employing the methodology proposed by Béli and Váradi (2016) and the SPAN system, while the size of the default fund was determined in accordance with Article 42 of the EMIR. Our results revealed how different the sizes of de- fault funds could be depending on realisations, which proves that it is not enough to rely solely on historical data when planning risk management. In our view, the calculation should consider hypothetical, extreme, but plausible scenarios so that the central counterparty can prepare for unexpected losses.
REFERENCES
Alfaro, R. – Drehmann, M. (2009): Macro stress tests and crises: what can we learn? BIS Quarterly Review, December 2009, 29–41., SSRN: https://ssrn.com/abstract=1519804.
Acemoglu, D. – Ozdaglar, A. – Tahbaz-Salehi, A. (2015): Systemic risk and stability in financial networks. American Economic Review 105(2), 564–608., https://doi.org/ 10.1257/aer.20130456.
Armenti, Y. – Crépey, S. – Drapeau, S. – Papapantoleon, A. (2018): Multivariate Shortfall Risk Allocation and Systemic Risk, Journal of Financial Math, Society for Industrial and Applied Mathematics 9(1), 90–126., https://doi.org/10.1137/16M1087357.
Balázs, B. C. (2014): Derivatívák marginja és ami mögötte van. SPAN használata a KELER KSZF Zrt.-nél [The Margin of Derivatives and the Background. The Use of SPAN at KELER CCP Plc., Thesis]. Corvinus University of Budapest.
Banai, Á. – Hosszú, Zs. – Körmendi, Gy. – Sóvágó, S. – Szegedi, R. (2013): Stressztesztek a Magyar Nemzeti Bank gyakorlatában [Stress Tests in the Practice of the National Bank of Hungary).
MNB-tanulmányok 109.
Barker, R. – Dickinson, A. – Lipton, A. – Virmani, R. (2016): Systemic risks in CCP networks. htt- ps://arxiv.org/abs/1604.00254.
BCBS (2009): Principles for sound stress testing practices and supervision. https://www.bis.org/
publ/bcbs155.htm.
Béli, M. – Váradi, K. (2016): Alapletét meghatározásának lehetséges módszertana [A possible methodology for calculating the initial margin]. Financial and Economic Review 16(2), 119–147., https://doi.org/10.25201/HSZ.16.2.117145.
Berlinger, E. – Dömötör, B. – Illés, F. – Váradi, K. (2016): A tőzsdei elszámolóházak veszte- sége [The loss of stock clearing houses]. Közgazdasági Szemle, 63(9), 993–1010., https://doi.
org/10.18414/KSZ.2016.9.993.
Berlinger, E. – Dömötör, B. – Illés, F. (2018): Optimal Margin Requirement. Financial Research Letters, https://doi.org/10.1016/j.frl.2018.11.010.
Berlinger, E. – Dömötör, B. – Illés, F. (2019): Anti-cyclical versus Risk-sensitive Margin Strate- gies in Central Clearing. Journal of International Financial Markets, Institutions and Money.
https://doi.org/10.1016/j.intfin.2019.06.002.
Biais, B. – Heider, F. – Hoerova, M, (2016): Risk-sharing or Risk-taking? Counterparty Risk, In- centives and Margins. Journal of Finance 71(4), 1669–1698., https://doi.org/ 10.1111/jofi.12396.
Biais, B. – Heider, F. – Hoerova, M, (2012): Clearing, counterparty risk, and aggregate risk. IMF Economic Review 60(2), 193–222., https://doi.org/10.1057/imfer.2012.8.
Campbell, S. D. – Ivanov, I. (2016): Empirically evaluating systemic risks in CCPs: The case of two CDS CCPs, https://doi.org/10.2139/ssrn.2841076.
Canabarro, E. (2013): Stress testing design. Journal of Risk Management in Financial Institution 7(1), 52–61.
Capponi, A. – Wang, J.– Jiaxu, J. – Zhang, H. (2018): Central Clearing and the Sizing of Default Funds. https://doi.org/10.2139/ssrn.3290397.
Cihák, M. (2007): Introduction to applied stress testing. IMF Working Paper, WP/07/59.
Cont, R. (2015): The end of the waterfall: Default resources of central counterparties. Journal of Risk Management in Financial Institutions 8(4), 365–389.
Cont, R. (2017): Central clearing and risk transformation. Norges Bank Research Working Paper No. 3., https://doi.org/10.2139/ssrn.2955647.
Deák, Zs. (2019): A központi szerződő felek garanciaalap képzésének célja és módszertana [The Aim and Methodology of Default fund Formation of Central Counterparties]. Thesis, Budapest Busi- ness School, Faculty of Finance and Accounting.
Duffie D. – Scheicher M. – Vuillemey G. (2015): Central clearing and collateral demand. Journal of Financial Economics 116(2), 237–256., https://doi.org/10.1016/j.jfineco.2014.12.006.
EMIR (2012) – European Market Infrastructure Regulation: Regulation (EU) No 648/2012 of the Eu- ropean Parliament and of the Council of 4 July 2012 on OTC derivatives, central counterparties and trade repositories. https:// https://eur-lex.europa.eu/legal-content/EN/TXT/HTML/?uri=O J:L:2012:201:FULL&from=EN.
ESMA (2012): European Securities and Markets Authority, Consultation Paper on Anti-Procyclical- ity Margin Measures. https://www.esma.europa.eu/press-news/esma-news/esma-consults-ccp- anti-procyclicality-margin-measures.
ESMA (2018): EU-wide stress test report. http://firds.esma.europa.eu/webst/ESMA70-151-1154%20 EU-wide%20CCP%20Stress%20Test%202017%20Report.pdf.
ESMA (2019a): EU-wide CCP stress test, ESMA.
ESMA (2019b): List of third-country central counterparties recognised to offer services and activi- ties in the Union, 6th May, 2019. https://www.esma.europa.eu/sites/default/files/library/third- country_ccps_recognised_under_emir.pdf.
Ghamami, S. – Glasserman,(2017): Does OTC derivatives reform incentivize central clearing? Jour- nal of Financial Intermediation 32, October, 76–87. https://doi.org/DOI: 10.1016/j.jfi.2017.05.007.
Hilbers,– Jones, M. T. (2004): Stress Testing a Financial System. IMF Working Paper, WP/04/127.
Hull, J. C. (2015): Risk management and financial institutions, 4. kiadás.
Iori, G. – Jafarey, S. – Padilla, F. G. (2006): Systemic risk on the interbank market. Journal of Economic Behavior & Organization 61(4), 525–542., https://doi.org/ 10.1016/j.jebo.2004.07.018.
KELER KSZF (2019a): Általános leírás [General Description] – https://www.kelerkszf.hu/
Kock%C3%A1zatkezel%C3%A9s/Multinet/%C3%81ltal%C3%A1nos%20le%C3%ADr%C3%A1s/.
KELER KSZF (2019b): Garanciarendszer elemei [The elements of the guarantee system] – https://
www.kelerkszf.hu/Kock%C3%A1zatkezel%C3%A9s/Multinet/Garanciarendszer%20elemei/.
KELER KSZF (2019c): Felhasználási sorrendje a garanciarendszer elemeinek [The or- der of application of the elements of the guarantee system] – https://www.kelerkszf.hu/
Kock%C3%A1zatkezel%C3%A9s/Multinet/Felhaszn%C3%A1l%C3%A1si%20sorrend/.
Madar, L. (2010): Stressztesztek használata anticiklikus tőkeszükséglet meghatározására [The Use of Stress Tests for the Calculation of Countercyclical Capita Requirement]. Hitelintézeti Szemle 9(5), 431–444.
Markose, S. – Giansante, S. – Eterovic, N. – Gatkowski, M. (2017): Early warning and systemic risk in core global banking: balance sheet financial network and market price-based methods.
https://doi.org/DOI: 10.2139/ssrn.2899930.
Markose, S. – Giansante, S. – Shaghaghi, A. (2012): ’Too interconnected to fail’ financial net- work of US CDS market: Topological fragility and systemic risk. Journal of Economic Behavior and Organization 83(3), 627–646., https://doi.org/10.1016/j.jebo.2012.05.016.
Menkveld, A. J. (2017): Crowded positions: An overlooked systemic risk for central clearing parties.
The Review of Asset Pricing Studies 7(2), 209–242., https://doi.org/ 10.1093/rapstu/rax016.
Murphy, D. (2017): I’ve got you under my skin: large central counterparty financial resources and the incentives they create. Journal of Financial Market Infrastructures 5(3), 57–74.
Murphy, D. – Vasios, M. – Vause, N. (2016): A comparative analysis of tools to limit the procy- clicality of initial margin requirements. Bank of England Working Paper No. 597., https://doi.
org/10.2139/ssrn.2772569.
Paddrik, M. – Young, H. (2017): How safe are central counterparties in derivative markets? Discus- sion Paper, University of Oxford. https://doi.org/10.2139/ssrn.3067589.
Parkinson, M. (2014): CCP Liquidity Risk Management and Related Failure Management Issues.
Federal Reserve Bank of Chicago, https://www.chicagofed.org/~/media/others/events/2014/an- nual-over-the-counter-derivatives-symposium/parkinson-ccp-derivatives-over-the-counter- 2014-pdf.
Poce, G. – Cimini, G. – Gabrielli, A. – Zaccaria, A. – Baldacci, G. – Polito, M. – Sabatini, S.
(2016): What do central counterparties default funds really cover? A network-based stress test answer. Journal of Market Infrastructures, https://doi.org/10.21314/JNTF.2018.047.
RTS (2012) – Technical Standard: Commission Delegated Regulation (EU) No 153/2013 of 19 Decem- ber 2012 supplementing Regulation (EU) No 648/2012 of the European Parliament and of the Council with regard to regulatory technical standards on requirements for central counterpar- ties. https://eur-lex.europa.eu/legal-content/EN/TXT/HTML/?uri=CELEX:32013R0153&from=
EN.