JavaScript Vulnerability Prediction Model
Balázs Mosolygó
Department of Software Engineering, University of Szeged
Szeged, Hungary mbalazs@inf.u-szeged.hu
Norbert Vándor
Department of Software Engineering, University of Szeged
Szeged, Hungary vandor@inf.u-szeged.hu
Gábor Antal
Department of Software Engineering, University of Szeged
Szeged, Hungary antal@inf.u-szeged.hu
Péter Hegedűs
ELKH-SZTE Research Group on Artificial Intelligence / Department of Software Engineering, University of Szeged
Szeged, Hungary hpeter@inf.u-szeged.hu
Rudolf Ferenc
Department of Software Engineering, University of Szeged
Szeged, Hungary ferenc@inf.u-szeged.hu
Abstract
Security has become a central and unavoidable aspect of today’s software development. Practitioners and re- searchers have proposed many code analysis tools and techniques to mitigate security risks. These tools apply static and dynamic analysis or, more recently, machine learning. Machine learning models can achieve impres- sive results in finding and forecasting possible security issues in programs. However, most of the current ap- proaches fall short of developer demands in two areas at least: explainability and granularity of predictions.
In this paper, we propose a novel and simple yet, promising approach to identify potentially vulnerable source code in JavaScript programs. The model im- proves the state-of-the-art in terms of explainability and prediction granularity as it gives results at the level of individual source code lines, which is fine-grained enough for developers to take immediate actions. Ad- ditionally, the model explains each predicted line (i.e., provides the most similar vulnerable line from the train- ing set) using a prototype-based approach. In a study of 186 real-world and confirmed JavaScript vulnerabil- ity fixes of 91 projects, the approach could flag 60%
of the known vulnerable lines on average by marking only 10% of the code-base, but in particular cases, the model identified 100% of the vulnerable code lines while flagging only 8.72% of the code-base.
Keywords:software security, vulnerability prediction, data mining, CVE, explainable ML
1 Introduction
It has never been easier to exploit an existing vulner- ability in a software system given the number of new domains and scenarios where complex programs appear.
Therefore, security has become a central and unavoid- able aspect of today’s software development. Dealing with security is an activity that should span through the whole software development life-cycle [7]. We focus on security activities carried out within the implemen- tation and quality assurance phases.
Practitioners and researchers have proposed many code analysis tools and techniques to aid software devel- opers in mitigating security risks. These usually apply static and dynamic analysis or, more recently, machine learning. Although machine learning-based vulnerabil- ity prediction models can achieve impressive results in finding and forecasting possible security issues in programs, there are at least two areas where most of the current approaches fall short of developer demands.
These are explainability and the granularity level of the results. Explainability means that a model should be able to provide so-called proof besides its prediction.
Most of the state-of-the-art vulnerability prediction models fail to meet explainability expectations. There- fore, developers cannot be sure why the model thinks that a certain code part is vulnerable, which reduces developer trust. Besides, without a clear explanation, it is extremely hard to validate the reported results (i.e., the developers need to either find and confirm the re- ported vulnerability or verify that the whole code part is secure).
The granularity of the results defines the unit of source code, which the vulnerability prediction refers to.
It can be, for example, a file, a class, a function/method, a block, a line, or a single statement. The coarser the gran- ularity of the prediction, the better the performance of a model. Nonetheless, the practical usability of a model depends highly on its ability to localize its prediction (i.e., to provide as fine-grained hit as possible). Most of the state-of-the-art vulnerability prediction models pro- vide prediction results at file [3, 8, 12, 16, 21], binary [22]
or class [19] level, but even the most fine-grained re- sults stop at the level of functions/methods [4, 19]. It means that developers need to explore large chunks of code to confirm and identify the exact spot and type of vulnerability predicted by a model. The lack of explana- tion worsens the situation further, which may hinder the entire practical adoption of the prediction model.
In this paper, we propose a novel and simple yet, promising approach to identify potentially vulnerable source code in JavaScript programs. We chose JavaScript as our target language because it is among the most popular languages nowadays [6] but gets less research attention than other mainstream languages, like Java or C/C++, which in this way have better support in terms of code security. The proposed model improves the state-of-the-art both in terms of explainability and prediction granularity as it gives results at the level of individual source code lines, which is fine-grained enough for developers to take immediate actions. Addi- tionally, the model shows proof for each predicted line using a prototype-based [9] approach. That means that it can provide a vulnerable line from the training data set that is the most similar to the predicted potentially vulnerable line. The model is based on the word2vec embedding [10] of source code lines and applying vec- tor distances with additional rules to find potentially vulnerable source code lines similar to those contained in a reference training set.
We performed a study on 186 real-world and con- firmed JavaScript vulnerability fixes of 91 projects con- tained in the dataset published by Ferenc et al. [4]
extended by a repository mining approach. However, since our approach is very sensitive to the data quality of the training set, we applied a line-by-line manual evaluation of all the vulnerability fix patches to keep only those code line changes that contribute to a vul- nerability fix. Using this cleaned-up training data set 10-fold cross-validation showed that the approach could flag 60% of the known vulnerable lines on average by marking only 10% of the code-base, but in particular
cases, the model identified 100% of the vulnerable code lines while flagging only 8.72% of the code-base. Ad- ditionally, it was able to detect non-trivial similarities between vulnerable source code lines.
The rest of the paper is organized as follows. In Section 2, we motivate our research and present the methodology we applied. The results obtained in the case study are detailed in Section 3. In Section 4, we present the works related to ours. Section 5 enumerates the list of possible threats, while we conclude the paper in Section 6.
2 Approach
We propose a simple yet, potentially practically useful approach for predicting vulnerable JavaScript source code lines. It is based on the word2vec similarity of program lines. We set up and maintain a validated ref- erence data set of vulnerable JavaScript code lines, the vulnerable lines repository (VLR). The VLR is collected by manually filtering and evaluating a publicly avail- able function level JavaScript vulnerability dataset [4]
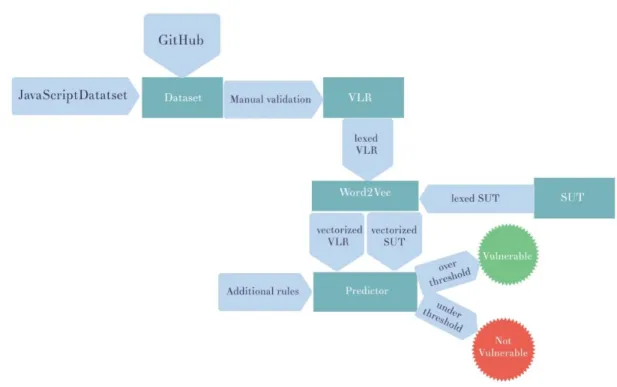
and patches collected by a repository mining approach (see Section 2.3 for details). Therefore, the lines in the VLR are samples of vulnerable code lines with very high confidence (i.e., there are practically no false-positive instances). The core of our vulnerable line detection algorithm is the calculation of an aggregated vector representation (see Section 2.3 for details) for each line in the VLR as well as for each line of thesystem under test (SUT). Once these semantically meaningful vector representations are calculated, we simply calculate the cosine distance between each pair of lines in the VLR and SUT. We keep only the minimal distance values for each line in the SUT (i.e., the distance between the cur- rent line and the most similar line in the VLR). From this distance and a couple of additional rules introduced to enhance accuracy (see Section 2.2 for details), we derive a probability for each line in the SUT that represents the likelihood of the line being vulnerable. Based on an empirically determined threshold, we can provide a prediction for each line in the SUT: if its vulnerabil- ity likelihood is above the threshold, we declare it to be vulnerable, otherwise, we consider the line to be non-vulnerable. For each likely vulnerable line, we can provide the sample line from the VLR that has the clos- est vector representation, which serves as a prototype- based explanation for the prediction. The outline of the proposed approach is depicted in Figure 1.
Figure 1.Overview of our process 2.1 Motivation
The motivations behind the proposed approach are many-fold, which we enumerate here.
Explainability and granularity. First and foremost, it has the favorable properties of being fine-grained (i.e., line-level results) and explainable. We already discussed in Section 1 why these properties are desirable and how most of the state-of-the-art approaches lack them.
Vulnerability patterns. Secondly, vulnerable code parts follow some common patterns. However, these patterns are not exact; they cannot be found easily with common methods like that of copy-paste detection (at least using the mature techniques to detect type-1 and type-2 clones). Word2vec proved to be meaningful for source code as well, so semantically similar statements (e.g., different loop instructions, type literals) fall close to each other in the vector space. It makes word2vec a good candidate for finding semantically similar, yet syntactically different code patterns, like that of vulner- abilities.
Lack of training data.Lastly, state-of-the-art ma- chine learning methods, deep learning especially, re- quire an enormous amount of training samples. In a realistic setup, this availability of training data is simply non-existent. Additionally, in almost all cases the col- lected data is imbalanced, meaning that vulnerable code samples are much less frequent in the training data than
non-vulnerable samples, which further complicates the training of ML models. Therefore, our proposed light- weight, vector similarity-based approach has a clear advantage in this scenario. It requires heavy ML train- ing only once for deriving word2vec vectors for the JavaScript keyword tokens (see Section 2.2), but for vul- nerability prediction, it does not use any ML techniques at all. It is not affected by the imbalance problem, as it uses only vulnerable code samples from the VLR. The method can be used with an arbitrary number of sam- ples in the VLR (even though the recall of the method will be very slow with too few samples), but the VLR can be extended iteratively with any newly identified vulnerabilities in the code. Therefore, the method is easy to adopt in practice and can be improved continu- ously throughout its application.
2.2 Matching and Prediction Algorithm
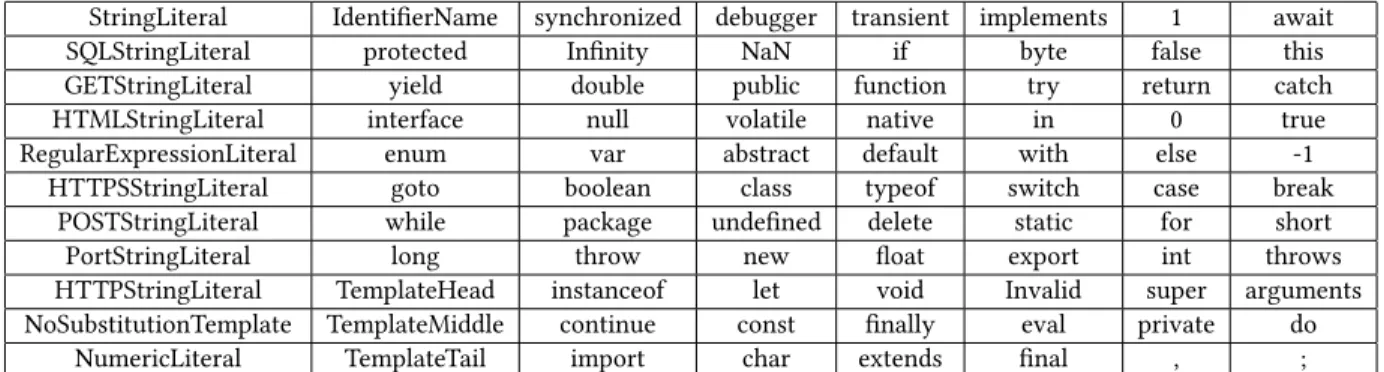
2.2.1 Source Code Embedding.To employ the pro- posed method, one needs to assign vectors to source code lines. For this, first, we tokenize the JavaScript source code and train a word2vec model with the set of tokens listed in Table 1, and the operators available in JavaScipt as the vocabulary. Two-dimensional vi- sualization of some of the vocabulary vectors can be seen in Figure 2. One can observe that the semantically similar statements and/or operators (e.g.,𝑐𝑎𝑡 𝑐ℎ/𝑓 𝑖𝑛𝑎𝑙𝑙𝑦, +=/−=) fall close to each other in the vector space.
StringLiteral IdentifierName synchronized debugger transient implements 1 await
SQLStringLiteral protected Infinity NaN if byte false this
GETStringLiteral yield double public function try return catch
HTMLStringLiteral interface null volatile native in 0 true
RegularExpressionLiteral enum var abstract default with else -1
HTTPSStringLiteral goto boolean class typeof switch case break
POSTStringLiteral while package undefined delete static for short
PortStringLiteral long throw new float export int throws
HTTPStringLiteral TemplateHead instanceof let void Invalid super arguments NoSubstitutionTemplate TemplateMiddle continue const finally eval private do
NumericLiteral TemplateTail import char extends final , ;
Table 1.The applied source code tokens
Figure 2.A vizualization of some of the word2vec vectors For the lexical analysis of the source code (i.e., produc-
ing tokens), we applied the open-source node module Js Tokens.1 Apart from the tokens derived from the JavaScript syntax, we included several concrete literal values in the vocabulary. These values are the literals of HTML tags, SQL queries, HTTP URLs, and the “GET”,
“POST” and “Port” string literals and the 0, 1, and−1 numeric literals. The identification of these literals is mostly straightforward, we just check whether the spec- ified value is present in the word in question or not. In the case of HTML and SQL, the process is slightly differ- ent, since the words will not contain the tokens directly, rather they contain specific key phrases or characters, for example “<” and “>” in HTML and “SELECT” and
“FROM” in SQL. The reasons for including these specific values are that these tokens are often associated with security functionality. Therefore, we expect additional
1https://github.com/lydell/js-tokens
expressiveness from the word2vec vectors using these tokens as well.2
We used a collection of 150,000 JavaScript files by Raychev et al. [15] as a corpus for training the word2vec model, which we implemented with the Gensim3topic modeling Python library. The calculated vectors have a length of 100.
Now that we have a vector representation for each token, we need to derive one aggregate vector for a sin- gle line of JavaScript as our proposed method compares lines of code by their vector representations. For this, we chose a simple approach, namely to calculate the average of vectors belonging to the tokens in a code line. We are aware that this method does not reflect the orders of the tokens within a line; however, it pro- vides the flexibility of matching code lines with similar
2We repeated the study without including these tokens and got slightly worse results, meaning that these special tokens indeed improve method performance.
3https://radimrehurek.com/gensim/
tokens used in a different order. Finding the most ap- propriate aggregation mechanism, however, requires further investigation.
2.2.2 Calculating Vulnerability Likelihood.To be able to predict which lines in a subject system are vul- nerable, we calculate the aggregated word2vec vectors for each line in the VLR, which we can use during the analysis of a new system. For each line in the subject system, we also calculate its aggregated word2vec vec- tor, then compare it with every line in the VLR and calculate the cosine distance between them. After we find the smallest distance, we calculate a probability value according to the following formula:
𝑃𝑑𝑖𝑠𝑡(𝑙 𝑖𝑛𝑒𝑐𝑜𝑑 𝑒) =1−𝑚𝑖𝑛𝑒(𝑐𝑜𝑠(®𝑣(𝑙 𝑖𝑛𝑒𝑐𝑜𝑑 𝑒),𝑣®(𝑙 𝑖𝑛𝑒𝑉 𝐿𝑅
𝑒))) Nonetheless, we cannot use this probability value directly to predict vulnerable code lines since language syntax elements that are usually written in separate lines such aselseor}are guaranteed to be flagged as vulnerable. A similar issue is caused by the common lan- guage patterns such asvar MyVar;orreturn Value;. Only using the standard distance value will cause these to also be permanently marked. Therefore, we introduced two rules: (i) the one-word elimination and the (ii) com- plexity rules. Rule (i) simply means that whenever we have a line with only one token, we do not apply vector matching but mark the line as non-vulnerable (to re- duce false-positive rate). Rule (ii) ensures that the same level of match between a pair of lines worth more if the subject line is having a higher number of different tokens. It is because complex lines match with very specific vulnerable lines in VLR; thus, our confidence should be higher. We derived a probability value from the complexity rule as follows:
𝑃𝑐𝑜𝑚𝑝𝑙(𝑙 𝑖𝑛𝑒𝑐𝑜𝑑 𝑒)=1− 1
𝑢𝑛𝑖𝑞𝑢𝑒𝐶𝑜𝑢𝑛𝑡(𝑙 𝑖𝑛𝑒𝑐𝑜𝑑 𝑒) Where𝑢𝑛𝑖𝑞𝑢𝑒𝐶𝑜𝑢𝑛𝑡 refers to the number of unique tokens present in the given line.
Once we have these two probabilities,𝑃𝑑𝑖𝑠𝑡(𝑙 𝑖𝑛𝑒𝑐𝑜𝑑 𝑒) and𝑃𝑐𝑜𝑚𝑝𝑙(𝑙 𝑖𝑛𝑒𝑐𝑜𝑑 𝑒), we calculate their average, which is our final estimated likelihood of a line being vulnera- ble:
𝑃𝑣𝑢𝑙 𝑛(𝑙 𝑖𝑛𝑒𝑐𝑜𝑑 𝑒) =
𝑃𝑑𝑖𝑠𝑡(𝑙 𝑖𝑛𝑒𝑐𝑜𝑑 𝑒) +𝑃𝑐𝑜𝑚𝑝𝑙(𝑙 𝑖𝑛𝑒𝑐𝑜𝑑 𝑒)
2 .
2.2.3 Deriving a Prediction.The calculated likeli- hood can be used for prioritizing source code lines based on their probabilities of being vulnerable. However, we intend to create a prediction model that reports likely
vulnerable lines. Therefore, we have to define a thresh- old and report all lines to be vulnerable with a vulnera- bility likelihood above this threshold. We defined such a threshold in an empirical manner, namely split our dataset into a𝑡 𝑟 𝑎𝑖𝑛,𝑑𝑒 𝑣, and𝑡 𝑒𝑠𝑡 sets (see details in Sec- tion 3.1). We use the𝑑𝑒 𝑣 set to find the best threshold so that we calculate the𝑃𝑣𝑢𝑙 𝑛(𝑙 𝑖𝑛𝑒𝑐𝑜𝑑 𝑒)values for each code lines in the𝑑𝑒 𝑣 set and check the performance measures (see details in Section 3.1) of the prediction applying various thresholds from 0.85 to 0.99 with a 0.01 step size. Depending on the measure we want to optimize, we can select an appropriate threshold and apply it for further prediction.
2.3 Dataset and Manual Evaluation
We created the VLR from a publicly available JavaScript vulnerability dataset [4] and by employing repository mining. The dataset contains vulnerability numbers at the function level; therefore, we had to extract the fix- ing patches by their git commit hashes. Besides these patches, we also performed repository mining on GitHub and analyzed the commit logs of over 500 JavaScript projects. With a heuristic approach, we identified com- mits whose messages mentioned the term “CVE”.4We separated the actual vulnerability fixes from test and documentation updates, manually creating new patches.
We took the union of all collected patches (i.e., coming from the vulnerability dataset and our repository min- ing process) and manually filtered and cleaned them.
It means that two of the authors of this paper read through all the lines in the vulnerability fixing patches.
We kept only those lines from the patches that we could manually confirm belong to a vulnerability fix. Even though it was a very labor-intensive task, it was essen- tial to minimize the number of false-positive samples in the VLR, thus improve prediction performance. Table 2 shows the descriptive statistics of the final dataset we ended up with after the manual evaluation.
Project count 91
File count 122
Function count 443
Patch count before review 614 Patch count after review 186 Remaining patch amount 30%
Amount of vulnerable lines 893 Average vulnerable lines per project 9.8
Table 2.Descriptive statistics of the dataset used
4https://cve.mitre.org/cve/
file_lines The total number of lines in a fold
flagged_lines The number of lines flagged as vulnerable vuln_lines The number of lines confirmed to be vulnerable
flagged_vuln_lines The number of confirmed vulnerable lines flagged as vulnerable
%_flagged The percentage of file_lines flagged as vulnerable (i.e., efficiency)
%_is_vuln The percentage of flagged_lines confirmed to be vulnerable (i.e., precision)
%_vuln_flagged The percentage of vuln_lines being flagged (i.e., recall) Table 3.Our measures and their short descriptions
3 Results
3.1 Case Study Setup and Performance measures
To evaluate the actual performance of the proposed vulnerability prediction method, we carried out a case study. We split the patches in the dataset described in Section 2.3 into two sets in a 90%-10% ratio. We used the 10%𝑑𝑒 𝑣 set to define the threshold needed to derive a prediction (see Section 2.2). On the remaining 90% of the data, we applied 10-fold cross-validation, meaning that we randomly split it into an 80%-20%𝑡 𝑟 𝑎𝑖𝑛,𝑡 𝑒𝑠𝑡 set ten times. In each iteration, we used the vulnerable lines from the𝑡 𝑟 𝑎𝑖𝑛set as the VLR and applied the prediction method to every line of the JavaScript projects with the patches in the𝑡 𝑒𝑠𝑡 set. We evaluated the performance of the predictions in each iteration and calculated their averages across the ten folds.
Since our proposed method is not a classical ML model, we can express its performance in terms of cor- rectly classified vulnerable code lines (i.e., precision), amount of identified vulnerability lines compared to all vulnerable lines (i.e., recall), and the total amount of lines predicted to be vulnerable compared to the total number of lines in the SUT (i.e., efficiency). For a com- plete list of collected performance measures, refer to Table 3.
However, one should be careful in interpreting these measures as their meaning is slightly different from that of a classic ML classification setup. We consider the pair of efficiency-recall to be the most expressive performance measure. For example, a 10%-60% ratio would mean that we can narrow down the location of the potential vulnerabilities into 10% of the source code, where we could find 60% of all the vulnerabilities.
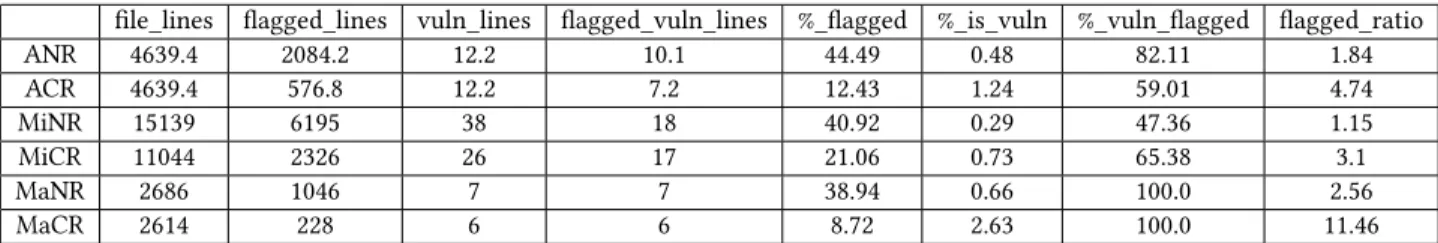
3.2 Prediction Performance of the Method To present the current predictive performance of our method, we performed 10-fold cross-validation on our dataset, the results of which are presented in Table 4.
The table contains the results when we apply no addi- tional rules (NR postfix) for filtering the results, just the word2vec distance of the corresponding vectors, and the case when complexity rule (see Section 2.2.2) has been applied (CR postfix). We show not only the aver- age of the ten results but the minimums and maximums as well – these are the edge cases – in which the method performs best and worst, respectively. We determined these edge cases by calculating the %_𝑣𝑢𝑙 𝑛_𝑓 𝑙 𝑎𝑔𝑔𝑒𝑑/
%_𝑓 𝑙 𝑎𝑔𝑔𝑒𝑑ratio for each fold and choosing their mini- mum and maximum values. This ratio can be seen in the 𝑓 𝑙 𝑎𝑔𝑔𝑒𝑑_𝑟 𝑎𝑡 𝑖𝑜 column of Table 4. The minimum line shows the case when the predictive power was the lowest, meaning that many of the vulnerable lines remained undetected, but a relatively large portion of the examined code was flagged. The values seen here for the two cases are different in nature, without the complexity rule (MiNR), the method flags fewer lines than average; however, it also misses most of the vul- nerable lines, on the other hand, when we apply the complexity rule (MiCR), it finds a higher percentage of the issues than on average but it marks a higher portion of lines as vulnerable. The maximum line shows off the case where the models performed the best: here both methods manage to find all of the vulnerable lines, the difference between them is the number of false posi- tives, which when we do not apply the complexity rule (MaNR) stays significantly higher as opposed to when we do (MaCR).
The average results are not as clear cut as the other two examples, since it shows that most of the time, the method using the complex rule (ACR) only finds 60%
of the vulnerable lines, while without it (ANR) 82% of the issues were detected. However, if we look at the flagged ratio of the two, we can see that after the ap- plication of the complex rule, it has more than doubled to 4.74 from 1.84, meaning that the loss in the amount vulnerable lines flagged is more than made up for, with the decrease in overall flagged lines. In the edge cases, the advantage of the application of the complexity rule
file_lines flagged_lines vuln_lines flagged_vuln_lines %_flagged %_is_vuln %_vuln_flagged flagged_ratio
ANR 4639.4 2084.2 12.2 10.1 44.49 0.48 82.11 1.84
ACR 4639.4 576.8 12.2 7.2 12.43 1.24 59.01 4.74
MiNR 15139 6195 38 18 40.92 0.29 47.36 1.15
MiCR 11044 2326 26 17 21.06 0.73 65.38 3.1
MaNR 2686 1046 7 7 38.94 0.66 100.0 2.56
MaCR 2614 228 6 6 8.72 2.63 100.0 11.46
Table 4.The results of the 10 fold cross validation both with and without the complexity metric becomes even clearer since in the minimum case it de-
tects more lines while falsely flagging less than half of its counterpart. We can see that the complexity rule is necessary when it comes to producing the best cur- rently possible predictions since it performs better in almost every existing metric.
While these metrics are promising, their deviation, especially in the edge cases is quite substantial, which is likely caused by the relatively low size of our current dataset, leading to fewer certain matches in with the vulnerable lines. The lack of data can also be the cause of the high false-positive rates since we have to use a smaller acceptance threshold, allowing fewer certain matches to also be accepted.
3.3 A Sample from the Results and its Proof We picked a concrete sample from the case study re- sults and showed its proof, too, to demonstrate the inner working of our prediction method. Figure 3 displays a line from the𝑡 𝑒𝑠𝑡 set, which we correctly predicted to be vulnerable (red line). We also put there its modifica- tion that appeared in the vulnerability fixing patch for reference. The proof for this correctly predicted vulner- able line is shown in Figure 4. We display also its fix appearing in a mitigation patch.
As can be seen, both lines contain security issues related to a Path Traversal vulnerability.5Even though they show some degree of similarity, for example, there is a𝑝𝑎𝑡 ℎoperation within another call, which also hap- pens to contain a string literal expressing a relative path, but they would be hard to match with any known copy detection tools. Nonetheless, our method applies a lexer to the code lines and produces their tokenized form shown in Listings 1 and 2.
I d e n t i f i e r N a m e = I d e n t i f i e r N a m e ( I d e n t i f i e r N a m e . I d e n t i f i e r N a m e ( I d e n t i f i e r N a m e ) , ! I d e n t i f i e r N a m e
, S t r i n g L i t e r a l ) ;
Listing 1. The tokenized form of a sample from predicted vulnerable lines
5https://owasp.org/www-community/attacks/Path_Traversal
I d e n t i f i e r N a m e = I d e n t i f i e r N a m e . I d e n t i f i e r N a m e ( I d e n t i f i e r N a m e . I d e n t i f i e r N a m e ( I d e n t i f i e r N a m e , S t r i n g L i t e r a l , I d e n t i f i e r N a m e ) )
;
Listing 2. The tokenized form of the proof for the sample vulnerable line
Even though they are still different, their average word2vec vectors will be very similar as there are lots of similar token types in them. This causes a high match probability (𝑃𝑑𝑖𝑠𝑡(𝑙 𝑖𝑛𝑒𝑐𝑜𝑑 𝑒) = 0.965) between the two lines. Given the fact that the lines are not trivial, con- tain many different token types, their complexity score (𝑃𝑐𝑜𝑚𝑝𝑙(𝑙 𝑖𝑛𝑒𝑐𝑜𝑑 𝑒) =0.889) will be high as well. The av- erage of the two, therefore, becomes higher than 0.92, so our method correctly flags the line shown in Figure 3 as vulnerable supported by proof as in Figure 4.
3.4 Discussion of Results
As demonstrated in the previous sections with both the 10-fold cross-validation values and the concrete ex- ample, our method is more than capable of producing valuable results, not only in the sense of noticing real vulnerabilities but also in producing accurate predic- tions. Our complexity rule proved useful in decreas- ing the number of flagged lines while keeping most of the vulnerable ones. Despite the imbalance in our dataset, the method is finding most of the vulnerable lines, meanwhile only flagging less than 13% of all of the available options. In an ideal situation, with a more extensive VLR, this could mean that one would only need to check about 10% of their code to find ˜60% of the potential vulnerabilities if one was using our method to look through their code. Similar numbers are pre- sented in past works [16] at a file level, so we think that reaching the same ratio at the source code line level is a great achievement. Despite this, our method still needs further refinements to be usable in a real-world setting.
In our experience, the method usually flags a large yet mutually independent number of the file’s lines at hand, in which case it does not improve the debugging
Figure 3.A sample vulnerable line predicted correctly and its actual fix
Figure 4.The proof line for the prediction and its actual fix experience considerably. The amount of lines flagged
is still too high in comparison to the amount of truly vulnerable lines. We intend to improve this issue by either creating new, more sophisticated rules to deal with the intricacies of written code or changing the way our current rules are being calculated. In the case of the complexity rule, for example, the function used to create the final result is somewhat arbitrary and could be further improved.
4 Related Work
Although using machine learning for predicting vulner- able software components is quite a new area, there are already numerous studies available.
File level.Shin et al. [16] performed an empirical case study on two large codebases, investigating if code complexity, code churn, and developer activity metrics can be useful in vulnerability prediction. Their used metrics were interpreted on files. The results showed that the metrics are discriminative and predictive of vulnerabilities. On Mozilla’s codebase, their model pre- dicted 70.8% of known vulnerabilities, and on Red Hat’s Linux kernel it achieved 68.8%.
Chowdhury et al. [3] created a framework to pre- dict vulnerable files relying on the CCC (Complexity, Coupling, and Cohesion) metrics [2]. They compared four statistical and machine learning techniques. The authors concluded that decision-tree-based techniques outperformed statistical models in their case.
In their work, Morrison et al. [11] built a model by replicating the prediction model proposed by Zimmer- mann et al [22]. Their model is built for both binaries and source code and used several code metrics at the file level. They figured out that vulnerability prediction at the binary level is not practical as it takes too much time to inspect the flagged binaries. Their results for source code metrics-based models showed a precision below 0.5 and a recall below 0.2. The authors checked several
learning algorithms, including SVM, Naive Bayes, ran- dom forests, and logistic regression. On their dataset, Naive Bayes and random forests performed the best.
In their work, Yu et al. proposed the HARMLESS [21]
approach, a cost-aware active learner that predicts vul- nerabilities. They used a support vector machine-based prediction model and a semi-supervised estimator to estimate the remaining vulnerabilities in the codebase.
In its actual run, HARMLESS suggests source code files that are most likely to contain vulnerabilities. They also used Mozilla’s codebase in their study, with three different feature sets: metrics, text, and the combina- tion of text mining and crash dump stack traces. Their results showed that HARMLESS finds 60-99% vulner- abilities by inspecting only 6-34% of source code files, and when targeting at 90, 95, 99% recall, HARMLESS can stop at 23, 30, 47% source files inspected. They also outperformed their previous study’s [20] recall and cost value.
Jimenez et al. [8] developed VulData7, an extensible framework (and dataset) of real vulnerabilities, auto- matically collected from software archives. VulData7 is a general framework that contains vulnerabilities for four security-critical open source project languages at the file level. However, their framework contains a lot of data, so an additional processing step is needed before the data can be used for predicting vulnerabilities.
In their work, Neuhas et al. [12] introduced their ap- proach, so-called Vulture (with a corresponding tool), which can predict vulnerable components in the source code relying on the dependencies between the com- ponents. A component in their approach is a header- source pair (where both are available, source file other- wise) for C/C++ (and would be a .java file for Java). They analyzed dependencies and function calls in between the components and used SVM for classification. Their classifier identified half of the vulnerable components in the system. Two third of the predicted components were correct.
File level Class level Function level Block \ Line level
Pascarella et al. [14] •
Giger et al. [5] •
Basili et al. [1] •
Palomba et al. [13] •
Ferenc et al. [4] •
Siavvas et al. [18] •
Jimenez et al. [8] •
Neuhas et al. [12] • •
Shin et al. [17] •
Shin et al. [16] •
Morrison et al. [11] • Chowdhury et al. [3] •
Yu et al. [21] •
Table 5.Summary of the related work Class level.Siavvas et al. [18] investigated the re-
lationship between software metrics and specific vul- nerability types. They used several class-level metrics and found that software metrics may not be sufficient indicators of specific vulnerability types.
In their work, Basili et al. [1] used a suite of object- oriented design metrics [2] as predictors of fault-prone classes, using a statistical approach. In contrast, our approach is mainly based on machine learning.
Palomba et al. [13] created a new model to predict bugs for smelly classes. They evaluated several predic- tion models: the best results were obtained using the Simple Logistic model. They also used several metrics and introduced a new metrics called intensity that is created by a third-party tool JCodeOdor.
Function level.Shin et al. [17] proposed an empir- ical model to predict vulnerable functions from static source code complexity metrics. They used the Wilcoxon rank-sum test and binary logistic regression analysis in their study. They showed that vulnerable functions have distinctive characteristics that separate them from
“non-vulnerable but faulty” functions.
Giger et al.[5] presented method-level bug prediction models using change and source code (size and com- plexity) metrics based on the CK metrics suite. Their models reached a precision of 84% and recall of 88%.
Ferenc et al. [4] presented a study using eight ma- chine learning algorithms to predict vulnerable JavaScript functions. They constructed a data set (consisted of static source code metrics, and vulnerability data from NVD6, along with patches collected from GitHub) and
6National Vulnerability Database
used that to train and test the algorithms. Their best results came from a KNN and reached a precision of 91% and recall of 66%. Although this study might be similar to ours, the used algorithms and predictors are differing from ours. Besides, their collected data can only be useful at the method level.
Pascarella et al. [14] replicated previous research by Giger et al. [5] on method-level bug prediction on differ- ent systems. They also proposed a more realistic evalua- tion strategy than the original research they replicated.
The used more realistic strategy made a significant per- formance drop to all of the models, so their final results were close to a random classifier.
Table 5 summarizes the related papers according to their level of prediction.
5 Threats to Validity
Next to the promising results, we also summarize the possible threats to their validity.
The creation of the vulnerable line repository, which is the basis of our prediction method, is based on a man- ually evaluated vulnerability fixing patch set. As with any human evaluation, this is also a subjective process.
To ensure the objective assessment of real vulnerable code lines, two of the authors evaluated the patches independently. Four disagreements arose during this process when they debated the acceptance of ambigu- ous cases. In these cases, if upon further investigation they were unable to come to a clear conclusion, the line was not marked as not vulnerable and has been left out of the VLR to minimize the possibility of false positives.
The size of the sample vulnerability dataset is not large; therefore, study results show a significant level
of deviation depending on the train, test split of the data. To minimize its effect, we applied a 10-fold cross- validation approach and calculated the mean perfor- mance measures to better reflect the true capabilities of the proposed approach. However, the generality of the results can be ensured further only by expanding the training dataset.
The approach of finding vulnerabilities line by line might be an oversimplification. Lots of vulnerability fixes span over multiple lines and can be assessed by looking at a larger portion of the code at the same time. However, our experiences show that a significant portion of the fixes (23% in our dataset) consists of only one line, in which case our method works perfectly.
Moreover, even in the case of multi-line fixes, there are key lines, which mitigate the security issue that we can recognize separately.
6 Conclusion
Vulnerability prediction models are highly desirable, so they attract a lot of research focus. The vast majority of the state-of-the-art approaches apply machine learning to build such models. In this paper, we proposed a novel method for vulnerability prediction, which goes beyond the state-of-the-art in two aspects: explainability and granularity.
Our lightweight solution is based on a set of manually evaluated real-world vulnerability fixing patches and the word2vec vector similarity of source code lines. We built a reference set of vulnerable source code lines and proposed an algorithm to find source code lines in a subject system that are very close to one of our reference lines. When similarity between an analyzed line and a line from our reference set is above a certain threshold and several other rules also apply, we predict the line to be vulnerable. The method is simple but bears an abundance of favorable properties most of the state-of-the-art approaches lack.
First, the method is lightweight, does not rely on heavy machine/deep learning models, which require an enormous amount of training samples. The only step where actual model training happens is the creation of word2vec vectors, which is a step that needs to run only once. Second, the prediction results are provided at the level of source code lines and not functions or files. It allows the developers to immediately reason about the correctness of the prediction and take immediate ac- tions if necessary. Third, to further support reasoning about the results, our method shows an explanation (i.e.,
proof) of the prediction. It is the most similar vulnerable line from the reference set, which can help developers understand the reason for their line being shown as vul- nerable, and allow them to more easily decide, whether further action is required or not. Fourth, it is easy to im- prove the performance of the model iteratively during its usage. For this, only the newly confirmed vulnerable lines should be put into the reference set; no further model training is necessary.
Although the method is far from perfect, it is a promis- ing step towards an actionable and explainable vulner- able prediction model. We demonstrated its applicabil- ity with a case study on 186 real-world and confirmed JavaScript vulnerability fixes of 91 projects, where the method could flag 60% of the known vulnerable lines on average by marking only 10% of the code-base, but in some cases, the model identified 100% of the vulnerable code lines while flagging only 8.72% of the code-base.
That result is already compelling but could be further improved. We plan to apply a smarter aggregation of word2vec vectors to reflect the order of the tokens as well, for example, by applying the doc2vec approach.
Defining additional rules that help further decreasing the false positive rate is also among our plans.
Acknowledgments
The presented work was carried out within the SETIT Project (2018-1.2.1-NKP-2018-00004)7and supported by the Ministry of Innovation and Technology NRDI Of- fice within the framework of the Artificial Intelligence National Laboratory Program (MILAB).
Furthermore, Péter Hegedűs was supported by the Bolyai János Scholarship of the Hungarian Academy of Sciences and the ÚNKP-20-5-SZTE-650 New National Excellence Program of the Ministry for Innovation and Technology.
References
[1] V. R. Basili, L. C. Briand, and W. L. Melo. 1996. A validation of object-oriented design metrics as quality indicators. IEEE Transactions on Software Engineering22, 10 (1996), 751–761.
https://doi.org/10.1109/32.544352
[2] Shyam R Chidamber and Chris F Kemerer. 1994. A metrics suite for object oriented design.IEEE Transactions on software engineering20, 6 (1994), 476–493.
7Project no. 2018-1.2.1-NKP-2018-00004 has been implemented with the support provided from the National Research, Development and Innovation Fund of Hungary, financed under the 2018-1.2.1-NKP funding scheme.
[3] Istehad Chowdhury and Mohammad Zulkernine. 2011. Using complexity, coupling, and cohesion metrics as early indicators of vulnerabilities.Journal of Systems Architecture57, 3 (2011), 294–313.
[4] Rudolf Ferenc, Péter Hegedűs, Péter Gyimesi, Gábor Antal, Dénes Bán, and Tibor Gyimóthy. 2019. Challenging Machine Learning Algorithms in Predicting Vulnerable JavaScript Func- tions. InProceedings of the 7th International Workshop on Re- alizing Artificial Intelligence Synergies in Software Engineering.
IEEE Press, 8–14.
[5] Emanuel Giger, Marco D’Ambros, Martin Pinzger, and Har- ald C Gall. 2012. Method-level bug prediction. InProceedings of the 2012 ACM-IEEE International Symposium on Empirical Software Engineering and Measurement. IEEE, 171–180.
[6] GitHub. 2020. GitHub octoverse website. https://octoverse.
github.com.
[7] Michael Howard and Steve Lipner. 2006.The security develop- ment lifecycle. Vol. 8. Microsoft Press Redmond.
[8] Matthieu Jimenez, Yves Le Traon, and Mike Papadakis. 2018.
Enabling the Continous Analysis of Security Vulnerabilities with VulData7. InIEEE International Working Conference on Source Code Analysis and Manipulation. 56–61.
[9] Pang Wei Koh and Percy Liang. 2017. Understanding black- box predictions via influence functions. arXiv preprint arXiv:1703.04730(2017).
[10] Tomas Mikolov, Kai Chen, Greg Corrado, and Jeffrey Dean.
2013. Efficient estimation of word representations in vector space.arXiv preprint arXiv:1301.3781(2013).
[11] Patrick Morrison, Kim Herzig, Brendan Murphy, and Lau- rie A. Williams. 2015. Challenges with applying vulnerability prediction models. InHotSoS.
[12] Stephan Neuhaus, Thomas Zimmermann, Christian Holler, and Andreas Zeller. 2007. Predicting Vulnerable Software Components. InProceedings of the ACM Conference on Com- puter and Communications Security. 529–540.
[13] F. Palomba, M. Zanoni, F. A. Fontana, A. De Lucia, and R.
Oliveto. 2016. Smells Like Teen Spirit: Improving Bug Predic- tion Performance Using the Intensity of Code Smells. In2016 IEEE International Conference on Software Maintenance and Evolution (ICSME). 244–255. https://doi.org/10.1109/ICSME.
2016.27
[14] L. Pascarella, F. Palomba, and A. Bacchelli. 2018. Re-evaluating method-level bug prediction. In2018 IEEE 25th International Conference on Software Analysis, Evolution and Reengineer- ing (SANER). 592–601. https://doi.org/10.1109/SANER.2018.
8330264
[15] Veselin Raychev, Pavol Bielik, Martin Vechev, and Andreas Krause. 2016. Learning programs from noisy data. ACM SIGPLAN Notices51, 1 (2016), 761–774.
[16] Yonghee Shin, Andrew Meneely, Laurie Williams, and Jason A.
Osborne. 2011. Evaluating Complexity, Code Churn, and De- veloper Activity Metrics As Indicators of Software Vulnera- bilities.IEEE Trans. Softw. Eng.37, 6 (Nov. 2011), 772–787.
[17] Yonghee Shin and Laurie Williams. 2008. An empirical model to predict security vulnerabilities using code complexity met- rics. InProceedings of the Second ACM-IEEE international sym- posium on Empirical software engineering and measurement.
ACM, 315–317.
[18] Miltiadis Siavvas, Dionisis Kehagias, and Dimitrios Tzovaras.
2017. A preliminary study on the relationship among software metrics and specific vulnerability types. In2017 International Conference on Computational Science and Computational Intel- ligence – Symposium on Software Engineering (CSCI-ISSE).
[19] Kazi Zakia Sultana, Vaibhav Anu, and Tai-Yin Chong. 2020.
Using software metrics for predicting vulnerable classes and methods in Java projects: A machine learning approach.Jour- nal of Software: Evolution and Process(2020), e2303.
[20] C Theisen, R Krishna, and L Williams. 2015. Strengthening the evidence that attack surfaces can be approximated with stack traces. InNorth Carolina State University Department of Computer Science TR2015-10, submitted to International Con- ference on Software Testing, Verification, and Validation (ICST) 2016.
[21] Zhe Yu, Christopher Theisen, Hyunwoo Sohn, Laurie Williams, and Tim Menzies. 2018. Cost-aware Vulnerability Prediction: the HARMLESS Approach.CoRRabs/1803.06545 (2018).
[22] Thomas Zimmermann, Nachiappan Nagappan, and Laurie Williams. 2010. Searching for a needle in a haystack: Predict- ing security vulnerabilities for windows vista. In2010 Third International Conference onSoftware Testing, Verification and Validation (ICST). IEEE, 421–428.
![Table 5. Summary of the related work Class level. Siavvas et al. [18] investigated the](https://thumb-eu.123doks.com/thumbv2/9dokorg/763018.33381/9.918.181.734.105.389/table-summary-related-work-class-level-siavvas-investigated.webp)
