R E S E A R C H A R T I C L E
Kinetic detection of osmium(VI) ester intermediates during the OsO
4‐ mediated aqueous dihydroxylation of
chloroethylenes
Mario Gabričević1 | Gábor Lente2 | István Fábián3,4
1Faculty of Pharmacy and Biochemistry, University of Zagreb, Zagreb, Croatia
2Department of General and Physical Chemistry, University of Pécs, Pécs, Hungary
3Department of Inorganic and Analytical Chemistry, University of Debrecen, Debrecen, Hungary
4MTA‐DE Redox and Homogeneous Catalytic Reaction Mechanisms Research Group, Debrecen, Hungary
Correspondence
Gábor Lente, Department of General and Physical Chemistry, University of Pécs, Pécs, Hungary.
Email: lenteg@gamma.ttk.pte.hu
Funding information
Ministry of Human Capacities in Hun- gary; European Regional Development Fund, Grant/Award Number: GINOP‐ 2.3.2‐15‐2016‐00008; Hungarian Science Foundation, Grant/Award Number:
OTKA K_17‐124983
Abstract
The kinetics and mechanism of the cis dihydroxylation of cis‐1,2‐ dichloroethylene,trans‐1,2‐dichloroethylene, and trichloroethylene by osmium tetroxide was studied systematically in aqueous solution. The stoichiometry of the process was determined based on the principle of continuous variation of reactant ratios with spectrophotometric detection. The results always showed 1:1 stoichiometry, which is in agreement with dihydroxylation. All three reac- tions were found to proceed in two distinct steps. The first step occurred on a time scale of seconds and was associated with a minor change in absorbance and was identified as the formation of a 1:1 adduct between the two reagents, which is the osmium(VI) ester that plays a decisive role in catalytic applica- tions. This species is formed in an equilibrium that is very much shifted toward the reactants, so the osmium(VI) complex is a short‐lived intermediate of the process, which is detected kinetically, but its concentration is never high enough for structural characterization. The second reaction is accompanied by major spectral changes; it involves the formation of the final products.
Our results clearly show that it is possible to detect the intermediate of the pro- cess by careful kinetic studies. It is also possible that the same strategy might be successful in other OsO4‐dependent dihydroxylation processes.
K E Y W O R D S
aqueous chemistry, osmium (VI) ester, oxidation of alkenes, relaxation kinetics, stopped‐flow
1 | I N T R O D U C T I O N
The cis dihydroxylation of carbon‐carbon double bonds using osmium tetroxide is a frequently used reaction in organic chemistry, it is probably the most reliable method for this particular transformation.[1,2] Osmium tetroxide has a surprisingly high number of additional practical
applications such as a staining and fixative agent for treating biological samples in electron microscopy and electrochemical analysis,[3–6]but it is rare and expensive.
Therefore, it is often imperative to use osmium as a cata- lyst in the process, which can be readily achieved by adding a less expensive stoichiometric oxidizing agent that is able to transform the product osmium(VI) back
- - - - This is an open access article under the terms of the Creative Commons Attribution License, which permits use, distribution and reproduction in any medium, provided the original work is properly cited.
© 2020 The Authors. Journal of Physical Organic Chemistry published by John Wiley & Sons Ltd DOI: 10.1002/poc.4045
J Phys Org Chem. 2020;33:e4045.
https://doi.org/10.1002/poc.4045
wileyonlinelibrary.com/journal/poc 1 of 10
into osmium tetroxide. Hydrogen peroxide, tert‐butyl‐ hydroperoxide, N‐methylmorpholine N‐oxide, dioxygen, chlorate ion, hypochlorite ion, and periodate ion have all been reported to be suitable for this purpose under certain conditions.[1,2,7–13] Despite the vastly different properties of these oxidants, it is a common aspect that they do not react with the substrate olefin directly, and their only role is to reproduce the initial form of the catalysts.[1,2] Therefore, it is clear that the kinetics and the efficiency of a catalytic method are dominantly deter- mined by the interaction of the oxidizable substrate with osmium tetroxide, and kinetic studies on this process in the absence of an extra oxidizing agent may provide insightful information on the mechanism and the poten- tial application of the method.
There seems to be quite general agreement on the mechanism of the cis dihydroxylation of carbon‐carbon double bonds by osmium tetroxide.[1,2,7,8]The formation of the catalytically active osmium(VI) ester usually assumed to contain a tetrahedral d2metal center by the addition of OsO4to the double bond is a common feature of these processes. The ester is a highly reactive intermediate that may have fleeting existence in solution but unlikely to be stable in the solid phase.
In some cases, penta‐coordinated dimeric monoester species Os2O4(O2R)2 and monomeric diester complexes OsO(O2R)2 were characterized structurally, and the mechanistic interpretations were also supported by quan- tum chemical calculations.[14–22] However, these mole- cules might very well represent unreactive dead ends as far as the dihydroxylation process is concerned. The pro- cess can be carried out in an enantioselective way by adding coordinating chiral amines as coligands.[2,8,9,11,13]
These are understood to exert an influence on the process by coordinating to the osmium center directly.
Trichloroethylene (TCE) was in widespread industrial use for decades in the 20th century as a vapor degreasing agent for metal objects and also as an anesthetic and dis- infectant in medicine. By now, its carcinogenic properties have been demonstrated, and its use was mostly phased out in developed countries.[23]However, it is still present in the environment in many industrial sites, and its general lack of reactivity is still an impediment in remedi- ation technologies.[24–27]From a purely chemical point of view, it is also interesting that the C‐H acidity of the molecule can be clearly detected in hydrogen isotope exchange reactions, similarly to the two isomers of 1,2‐ dichloroethylene.[28]
This work reports our serendipitous finding that the kinetics of the formation of the key intermediate can be detected during the reaction between osmium tetroxide and three different chloroethylenes in aqueous solution.
A full kinetic analysis showed that this highly reactive
intermediate is indeed present in low concentrations, which precludes structural characterization, but it is def- initely the species that is in the center of the catalytic activity. A formal kinetic scheme is proposed to interpret the kinetic findings with the full consideration of the var- ious labile equilibria of osmium(VIII) species in aqueous solution.[29–32]
2 | E X P E R I M E N T A L 2.1 | Materials
All chemicals used were commercially available and reagent grade. NaOH, TCE, trans‐1,2‐dichloroethylene (t‐DCE),cis‐1,2‐dichloroethylene (c‐DCE), and OsO4were supplied by Sigma and used without further purification.
NaClO4 (Sigma) was used to maintain constant ionic strength (denoted asIin this article) by adding an appro- priate amount of 6.2 mol/dm3stock solution to the reac- tion mixture. The solubilities of chloroethylenes are somewhat limited in water (mmol/dm3level), and stock solutions were prepared by the addition of excess of chloroethylenes in water to ensure saturated solution conditions.
The OsO4stock solution was prepared by dissolving a measured amount of solid OsO4 in NaOH solution to ensure the stability of OsO4in its mono/di‐hydroxo form.
(WARNING! Solid OsO4 is known to be highly volatile, and its vapors are very harmful for the eyes.) Basic condi- tions also decrease the volatility of osmium(VIII) very substantially. The osmium concentration of this stock solution was double checked by ICP‐AES measurements shortly after preparation and found to be in good agree- ment with the values calculated based on mass and vol- ume measurements. Final concentrations were 0.10 mol/dm3for NaOH and 50 mmol/dm3for OsO4. The con- centration of OsO4in this stock solutions was also moni- tored regularly by spectrophotometric measurements.
The solution was stable for 5 days at 4 °C. Under strongly basic conditions (2 mol/dm3NaOH or higher), OsO4can be reduced to osmium(VII) and later to osmium(VI) by water during a few days at room temperature as indicated by spectral change.[29,30] No such spectral change was observed in 0.10 mol/dm3NaOH under our conditions.
2.2 | Instruments
Kinetic studies were performed on an Applied Photophysics SX‐20 Stopped‐flow spectrophotometer (fast complexation reactions) and Perkin‐Elmer Lambda 25 spectrophotometer equipped with thermostated cell block (slow redox processes). The dead time of the stopped‐flow
instrument was experimentally determined to be 1.0 ms.[33–35] Kinetic curves were evaluated, and rate con- stants were fitted by the respective built‐in softwares of the instruments. Each point presented is the average of at least seven runs in the complexation study, while the same averaging was done for at least three runs in the redox study.
3 | R E S U L T S
3.1 | General observations
First, the UV‐visible spectral changes of the reaction between osmium tetroxide and the three chloroethylenes were studied in basic aqueous solution. No reaction was observed with 1,1‐dichloroethylene, the use of chloroethylene (better known as vinyl chloride) was not even attempted because it is a gas under normal conditions. In addition, no reaction was observed at room temperature even with the studied three chloroethylenes when the conditions were less basic than in the experi- ments shown in this study.
In a series of experiments, the ratio of reactants (OsO4 vs ethylenes) was changed systematically to explore the stoichiometry of the redox reactions. Samples with differ- ent ratios were prepared and left to react for 24 hours.
This period of time was sufficient for the completion of the redox process; the UV‐vis spectrum of the solution was measured. The absorbance at a few selected wave- lengths was plotted as a function of the reactant ratio.
This plot is expected to give a sharp break point that indi- cates the stoichiometric ratio of reactants in the process (this technique is also known as the method of continu- ous variation[36]). For all chloroethylenes, evidence for 1:1 stoichiometry was obtained. A plot based on a typical series of experiments is presented in Figure 1 for the TCE‐OsO4system. Two more plots for the other two sub- strates are shown in the Supporting Information. The spectral changes indicate the reduction of osmium(VIII) to osmium(VI) clearly: The initial spectrum matches the known spectrum of aqueous osmium(VIII), while the last one is the same as the independently known spectrum of osmium(VI) in water.[29,30] The appearance of the isosbestic point at about 260 nm implies that the studied process can be characterized by a single stoichiometric equation for TCE, the same was observed forc‐DCE and t‐DCE. The inset in Figure 1 shows absorbance as func- tion of the TCE/Os(VIII) ratio at 320 nm. The break point occurs at 1:1 ratio, so a 1:1 TCE:Os(VIII) stoichiometry is concluded. This is in agreement with the expectation based on previous knowledge about the cis dihydroxylation reaction. However, it is also clear from
the previous literature of the oxidation of chloroethylenes[37,38] that the cis‐dihydroxylated species hydrolyze to glyoxal and glyoxilic acid in fast reactions, which are the final detectable organic products.
The kinetics of the three processes was also studied in detail. Because the dominating absorbing species are the different forms of osmium, and chloroethylenes have neg- ligible UV‐absorption in this region; OsO4was selected as the substoichiometric reagent, and the chloroethylenes were used in excess. Figure 2 shows representative kinetic curves for all three substrates measured at 280 nm. They confirm that the spectral changes take at least a few hours to complete in each of the systems. All the curves
FIGURE 2 Representative kinetic curves on long time scale.
Conditions: [Os(VIII)] = 0.20 mmol/dm3(trichloroethylene [TCE], trans‐dichloroethylene [DCE]) and 0.16 mmol/dm3(cis‐DCE), [NaOH] = 0.10 mol/dm3,I= 0.10 mol/dm3,T= 25.0°C
FIGURE 1 Stoichiometry of the redox reaction between OsO4
and trichloroethylene (TCE). All spectra were measured after completion of the reaction (24 h). Inset: Absorbance change at 320 nm vs TCE/OsO4ratio. Conditions: [Os(VIII)] = 1.00 mmol/dm3, [TCE] = 0.050‐5.0 mmol/dm3[NaOH] = 0.10 mol/dm3,I= 0.10 mol/dm3,T= 25°C
gave excellent fits to exponential functions, which con- firmed the fact that the rates of these processes show first order dependence on the concentration of the substoichiometric reagent (OsO4). The initial absorbances in these curves matched the expectations based on the known spectrum of osmium(VIII) within experimental error. These facts, especially when considered together with the observed isosbestic point in Figure 1, gave no reason to suspect a multi‐step process.
However, when the kinetic experiments were repeated on a short time scale in a stopped‐flow instrument, the occurrence of a fast reaction was revealed. Figure 3 shows curves measured for two different ethylenes. These traces also gave quite acceptable fits to exponential functions, which implies pseudo‐first order behavior. The amplitude of the process (ie, the difference in the initial and the final absorbance) was really tiny, smaller than 0.005 units in all cases. Of course, absolute absorbances cannot be mea- sured reliably at this precision. However, the time depen- dence detected within a single curve still holds valuable information, and the pseudo‐first order rate constant could be determined quite reliably. This is the conse- quence of the negligible random variation of the absor- bance due to the fluctuation of the base line in such a short time scale. In this sense, this small signal resembles the general practice followed during relaxation measure- ments (temperature jump, pressure jump, and field jump).[39,40]
On the basis of these observations, it was concluded that the reaction between chloroethylenes and OsO4actu- ally proceeds in two distinct steps under basic conditions.
In the faster step, TCE, c‐DCE, or t‐DCE react with osmium(VIII) in a few seconds as evidenced by the small decrease of absorbance, which was detected in the entire
spectral region above 280 nm (OsO4absorption). We attri- bute this absorbance change to the formation of the com- monly assumed intermediate osmium(VI) ester complex.[1,2] In the slower step, the reaction proceeds via the decomposition of the complexes in each investi- gated system, and the appropriate form of aqueous osmium(VI) is formed from the intermediate on a time scale of a few hours.
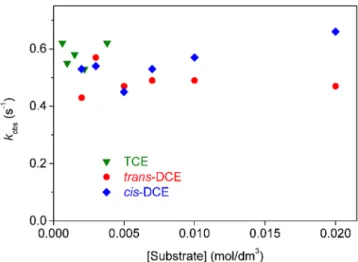
Detailed studies were carried out on the kinetics of both the fast and slow processes in all three systems, where the reactant concentrations and the pH were changed in a systematic way to explore the rate equa- tions of the processes. The dependence of the measured pseudo‐first order rate constants on the ethylene concen- trations for the fast step is shown in Figure 4. It is nota- ble that neither the concentration nor the identity of the chloroethylene influences the value of this parameter.
There is some scatter in the data, but that seems to show no particular tendency so we fully assign this scat- ter to random noise, which is not unreasonable given the small amplitude of the absorbance changes followed.
It should also be noted that the concentration of TCE could not be increased as much as that of the two dichloroethylenes because its solubility is more limited in water.
Figure 5, on the other hand, shows that the pseudo‐ first order rate constant of the fast process does depend on the pH. The identity of the chloroethylene still does not make a difference here, ie, trichloroethylene and the two dichloroethylenes have very similar values at the same pH, but the pseudo‐first order rate constants at lower basicities are significantly higher
The experimental points in Figure 5 were fitted to Equation (1), which is a very general one to interpret
FIGURE 3 Representative curves on short time scale.
Conditions: [Os (VIII)] = 0.20 mmol/dm3(trichloroethylene [TCE]) and 0.16 mmol/dm3(cis‐dichloroethylene [DCE]), [NaOH]
= 0.10 mol/dm3,I= 0.10 mol/dm3,T= 25.0°C
FIGURE 4 Dependence of kobs on the chloroethylene concentrations in the fast step of their reactions with osmium (VIII). Conditions: [Os(VIII)] = 0.20 mmol/dm3, [NaOH] = 0.10 mol/dm3,I= 0.10 mol/dm3,T= 25.0°C
pH‐dependences[41], although the equilibrium process characterized by the pK in the formula is not identified at this point, this will only be done in Section 4. Rate con- stants kacid and kbase correspond to the reactions of the acidic and basic forms of the same reactant, respectively.
kobs¼½Hþkacidþ10−pKkbase Hþ
½ þ10−pK : (1) The fit was carried out in a global way, so common parameter values were forced for the three different sub- strates. [H+] in this formula was calculated from the hydroxide ion concentrations with the known value of the ionic product of water (if defined by concentrations rather than activities[42], pKw = 13.58 at I = 0.10 mol/dm3and 298.15 K[43]). It was observed that the esti- mated value of kbase was very low and substantially smaller than its standard error. This is an indication that the basic pathway does not contribute significantly to the observed rate. Therefore, kbase was fixed to zero. The remaining two parameters were determined as kacid = 4.3 ± 0.1 s−1and pK= 12.0 ± 0.1. The best fit is shown as a line in Figure 5. Although the fit of the data points is far from perfect, this is still seen as a reasonable one given the small signal followed and the fact that three dif- ferent reactions were considered in a common fit.
As was already mentioned, the slow process was also very well described by an exponential curve. Figure 6 shows the dependence of the pseudo‐first order rate con- stants on the substrate concentrations in all systems.
Unlike in the fast step, the different substrates give noticeably different rate constant and reaction rates. t‐ DCE is the most reactive, whereas TCE takes the longest
time to complete the reaction under otherwise identical conditions. The plots in Figure 6 also show that the pseudo‐first order rate constants are directly proportional to the substrate concentration (which was used in excess).
These observations are normally indicative of a simple first order process with respect to the substrate, and therefore an overall second order reaction. The slopes of the straight lines give the second order rate constants in each system, they were determined as k2nd = 0.036 ± 0.001 dm3 mol−1 s−1 (TCE), k2nd = 0.111 ± 0.008 dm3 mol−1 s−1 (c‐DCE), and k2nd = 0.53 ± 0.01 dm3 mol−1 s−1(t‐DCE).
The pH‐dependence of the slow pseudo‐first order rate constant was studied in all three systems as well. The results are shown in Figure 7. It was mentioned earlier that the different substrates show characteristically differ- ent reactivities on the slow time scale. A change in the pH influences the measured pseudo‐first order rate constants in all three cases. However, unlike to the fast process, the FIGURE 5 Dependence ofkobson the pH of the complexation
reaction of chlorinated ethylenes with osmium(VIII). Conditions:
[Os(VIII)] = 0.20 mmol/dm3, [substrate] = 2.0 mmol/dm3,I= 0.10 mol/dm3,T= 25.0 °C. Continuous line: best fit to the formula give in Equation (1)
FIGURE 6 Pseudo‐first order rate constant as a function of substrate concentration for the slow process in the reactions between chloroethylenes and OsO4. [Os(VIII)] = 0.20 mmol/dm3 (trichloroethylene [TCE]), 0.50 mmol/dm3(c‐dichloroethylene [DCE] andt‐DCE); [NaOH] = 0.10 mol/dm3;I= 0.10 mol/dm3;T= 25°C
values tend to increase as the pH increases. The experi- mental points measured in all three cases were fitted to the function given in Equation (1). Again, this formula gave an acceptable interpretation of the observed depen- dence. The parameters were determined separately in each case: kacid = (2.3 ± 1.0) × 10−5 s−1, kbase = (6.4 ± 0.9) × 10−5 s−1, pK = 12.4 ± 0.4 (TCE), kacid = (1.5 ± 0.3) × 10−4s−1,kbase = (3.4 ±0.1) × 10−4s−1and pK= 11.9 ± 0.2 (c‐DCE), andkacid= (2.5 ± 2.3) ×10−4s−1,kbase
= (1.44 ± 0.08) × 10−3s−1and pK= 11.9 ± 0.3 (t‐DCE). It is seen thatkacidfort‐DCE is barely larger than its stan- dard error, which indicates that the corresponding path- way has a very limited contribution to the overall reaction progress under the experimental conditions.
4 | D I S C U S S I O N
First, it must be pointed out that this study has a highly unusual aspect, which is finding the fast process. In rou- tine high quality kinetic studies, this process would prob- ably not have been recognized as the easily detectable slow process is first order with respect to both of its reagents, and even a comparison of expected and detected initial absorbances[44]does not necessarily imply the need for including (or indeed, searching for) a fast process.[45]
So the discovery of the fast part of the reactions seems serendipitous.
To interpret the kinetic findings, the highly labile equi- libria in the solutions of OsO4have to be considered first.
Osmium(VIII) is present as molecular OsO4 in neutral aqueous solutions and shows very peculiar vibrational fine structure in its UV‐vis spectrum.[30]In basic medium, osmium(VIII) forms two perosmate ions, OsO4(OH)−and
OsO4(OH)22−in a stepwise manner:[29–31]
OsO4þH2O¼OsO4OH−þHþ Ka1; (2) OsO4OH−þH2O¼OsO4ðOHÞ2−2 þHþ Ka2: (3) The correspondingKa1andKa2values were reported in the literature as 8.69 × 10⁻¹³M (pKa1= 12.2) and 7.58 × 10⁻¹⁵M (pKa2= 14.4).[29]In agreement with these values, the single negative aqueous form of osmium(VIII) domi- nates under our conditions, which explains why vibra- tional fine structure[30] is not detected in the spectra shown in Figure 1. At the lower end of the pH range of these studies, the neutral OsO4species is in a slight excess over the mononegative ion. These equilibria only involve simple proton transfer processes, which are understood to be very fast (equilibrium reached within 1μs under all practical conditions), so only the equilibrium constants need to be considered in our kinetic studies.
We found that all our kinetic findings are interpreted by the following kinetic scheme where the notation E stands for the oxidizable chloroethylene derivative:
OsO4þE!k1a OsO2ðO2EÞ (4)
OsO4OH−þE!k1b OsO2ðO2EÞOH− (5)
OsO2ðO2EÞk1a−!OsO4þE (6)
OsO2ðO2EÞOH−k1b−!OsO4OH−þE (7) OsO2ðO2EÞ þH2O¼OsO2ðO2EÞOH−
þHþ KaE (8)
OsO2ðO2EÞ þ4H2O!k2a OsO2ðOHÞ2−4 þE OHð Þ2
þ2Hþ (9)
OsO2ðO2EÞOH−þ3H2O!k2b OsO2ðOHÞ2−4
þE OHð Þ2þHþ (10) This scheme may seem complicated at first sight, but in fact it is quite simple. The essence is that the osmium (VI) ester intermediate forms in a reversible way form osmium(VIII) and the chloroethyelene (Equations 4 and 6) then undergoes decomposition giving the final cisdiol product (Equation 9). All of these reactions have their counterpart where the osmium center is coordi- nated to a hydroxide ion (Equations 5, 7, and 10). Finally, not only the pre‐equilibrium shown in Equation (2) is FIGURE 7 Dependence of the pseudo‐first order rate constant of
the slow process on the pH in the reaction of chloroethylenes with OsO4. Conditions: [Os(VIII)] = 0.20 mmol/dm3, [Substrate] = 2.0 mmol/dm3,I= 0.10 mol/dm3,T= 25°C
established between the two osmium(VIII) aqua forms but also the two different osmium(VI) esters (the one with a hydroxide ion coordinated and the one without) interconvert in a very rapid process (Equation 8). In effect, this means that the scheme has one reversible reaction (adduct formation between the reactants) and one irreversible (formation of the final products), but these are also possible in the same way when a hydroxide ion is attached to the osmium center.
The first, reversible step occurs on the fast time scale.
Note that a tiny absorbance decrease is detected for this process. This is in agreement with the generally agreed formulation of the active intermediate as an osmium (VI) ester: If it contains a d2 metal center, its spectral characteristics must resemble those of the product aque- ous osmium(VI) and not the initial osmium(VIII). In agreement with previous literature data, Figure 1 shows that osmium(VI) has generally much smaller light absorption above 260 nm than osmium(VIII), the decrease in absorbance during the fast process is quite understandable. Furthermore, the tiny absorbance change of the process is caused by the fact that it reaches equilibrium at very low conversion. The small absorbance decrease of the curves in Figure 3 relative to the total measured absorbance implies that the conversion is not more than 2% to 3% in equilibrium.
The measured kinetics of the process, and especially the independence of the measured pseudo‐first order rate constants of the substrate concentration (Figure 4) deserves some additional attention here. From the theory of relaxation experiments,[39,44]it is well known that the lifetime in an equilibrium that is heavily shifted toward the initial reagents is set by the rate constant of the reverse reaction even if the process is advancing in the forward direction. This is a pivotal point in the present study, so we also report a derivation by a method that is independent of the kinetic relaxation theory[39] because the product complex is absent at the initial time, which is very atypical in relaxation.
The rate equation of a reversible reaction in which E and O come together to form the adduct EO takes the following form:
d½EO
dt ¼kþ½ E0−½EO
½ O0−½EO
−k−½EO: (11)
It is shown in the Supporting Information that this equation can be solved analytically (the solution of a more general version of this rate equation is also found in the literature[45]). The precise solution under condi- tions where EO is not present in the initial mixture is given as:
½EO ¼ A
2kþ− B A þBþAe−Bt−Be−Bt 2kþAþB−Ae−BtþBe−Bt
A¼kþ½ E0þkþ½ O0þk− B¼ ffiffiffiffiffiffiffiffiffiffiffiffiffiffiffiffiffiffiffiffiffiffiffiffiffiffiffiffiffiffiffiffiffiffiffiffi A2−4kþ2½ E0½ O0
q :
(12) As given above,AandBare combination parameters in this formula that have been introduced to shorten the mathematical expressions. When the equilibrium is shifted toward the initial reagents, the value of the reverse rate constant is large and dominates in the defini- tion of A becausek−> >k+[E]0+k+[O]0. As derived in the Supporting Information, Equation (12) can be simpli- fied into the following, exponential form under these con- ditions:
½EO≅ ½ E0 2 þ½ O0
2 þ k− 2kþ−
ffiffiffiffiffiffiffiffiffiffiffiffiffiffiffiffiffiffiffiffiffiffiffiffiffiffiffiffiffiffiffiffiffiffiffiffiffiffiffiffiffiffiffiffiffiffiffiffiffiffiffiffiffiffiffiffiffiffiffiffiffiffiffiffiffi
½ E0 2 þ½ O0
2 þ k− 2kþ
2
−½ E0½ O0 0 s
@
1 A 1−e−k−t
:
(13) So indeed, the pseudo‐first order rate constant of the process will simply bek−, ie, the first order rate constant of the reverse process.
This effect explains why Figure 4 shows that the pseudo‐first order rate constant of the fast process is inde- pendent of the substrate concentrations. It is more inter- esting to consider why it is independent even of the identity of the substrate. Here, it is probably best to con- sider that the reaction is the dissociation of the osmium (VI) ester where the reactive center (the metal atom) is not in the direct vicinity of the substituents that were on the double bond in the original substrate. Therefore, it is arguable that the rate of the dissociation of this ester is not very much influenced by the exchange of hydro- gens to chlorine on the carbon atoms. It is also clear how the pH dependence shown in Figure 5 arises: the OsO2(O2E) and OsO2(O2E)OH− have different dissocia- tion rate constants as the coordination of the hydroxide ion occurs directly on the metal center. In terms of ele- mentary rate constants shown in the scheme of Equa- tions (4) to (10), the pseudo‐first order rate constant of the fast process can be givens as:
kobs¼½Hþk1a−þKaEk1b−
Hþ
½ þKaE : (14) At this point, it should be remarked that the three dif- ferent chloroethylenes studied here might as well have three different pKaEvalues. However, as the pseudo‐first order rate constants measured for the fast process do
not depend on the identity of the substrate significantly, neither does pKaE. It can also be observed that this pKaE
is in fact not significantly different from pKa1, which implies that the affinity of the metal center toward hydroxide ion does not even depend on whether the bonded oxygens are involved in further ester bonds or not.
The kinetics of the slow step can be interpreted in a more commonly used sequence of thought[41,44] based on the proposed scheme. On this time scale, the two reversible reactions in Equations (4) to (7) already reach equilibrium, as this equilibrium is shifted toward the ini- tial reagents, the concentrations of the osmium(VI) esters can be given using the concentrations of the reactants at every time instant:
OsO2ðO2EÞ
½ ¼ k1a
k1a−½OsO4½ ;E (15)
OsO2ðO2EÞOH−
½ ¼ KaE
Hþ
½ ½OsO2ðO2EÞ
¼ k1aKaE
k1a−½Hþ½OsO4½ :E (16) It must also be considered that the total amount of aqueous osmium(VIII) is distributed between two differ- ent forms, the neutral molecule and the mononegative ion:
Os VIIIð Þ
½ ¼½OsO4 þ½OsO4ðOHÞ−
¼½OsO4 þ Ka1 Hþ
½ ½OsO4: (17) The formation rate of thecis‐diol is then:
dE OHð Þ2
dt ¼k2a½OsO2ðO2EÞ þk2b½OsO2ðO2EÞOH− ¼ k2aþk2bKaE
Hþ
½
k1a
k1a−½OsO4½ ¼E k2a½Hþ þk2bKaE
Hþ
½ þKa1
k1a
k1a−½Os VIIIð Þ½ :E
(18) Given that the substrate E is used in large excess over osmium(VIII) in the experiments, the pseudo‐first order rate constant of the slow processes is expected to be:
kobs¼k2a½Hþ þk2bKaE
Hþ
½ þKa1 k1a
k1a−½ :E (19) This is in excellent agreement with the experimental observations shown in Figures 6 and 7. It should be noticed that Ka1 ≅ KaE was already established at the analysis of the fast step, so the analogy with Equation (1) is complete with kacid = [E]k2ak1a/k1a− and kbase = [E]
k2bk1b/k1b−. It is also remarkable that, unlike for the fast
process, the pseudo‐first order rate constant of the slow phase depends on the identity of the substrate very signif- icantly. Thek1a−andk1b−values already led to the argu- ment that for the properties of the osmium (VI) ester, the substituents farther away from the metal center do not seem to exert much kinetic influence. This same line of thought leads to the estimate thatk2aandk2bare proba- bly close to independent of the identity of the substrate.
Therefore, the reason for the kinetic difference in the slow process between the three studied substrates must lie primarily in thek1avalues, which characterize the rate of association of osmium tetroxide with the oxidizable chloroethylene.
An essential point in our interpretation is that the adduct OsO2(O2E) is a minor intermediate because its for- mation equilibrium is shifted towards the reactants. In other words, the thermodynamic stability of the osmate ester is low. At first sight, this might seem to contradict well established quantum chemical calculations,[46,47]
which showed that the osmate ester formation is highly exergonic. The calculated energy changes for ethylene as an oxidizable alkene were−21.2 kcal mol−1 (=−88.7 kJ mol−1)[46] and −18.1 kcal mol−1 (=−75.7 kJ mol−1).[47]Without the intention to question the accuracy of these results, the next paragraphs will show that the results of these quantum chemical calculations are irrele- vant for the present study.
First, it is pointed out that the reported energy values are not Gibbs free energies and are therefore unsuitable for predicting the actual driving force of the adduct for- mation directly, separate considerations about the entropy changes would be needed. As this is an adduct formation reaction, the entropy change of the process must certainly be highly negative, which would result in a Gibbs free energy that is considerably less negative than
−88.7 kJ mol−1or−75.7 kJ mol−1. However, there seems to be insufficient data to make this consideration truly quantitative.
A much more important point is that the process was experimentally studied in aqueous solution in this work.
In this phase, thermodynamic data are available in the lit- erature to develop some truly quantitative and meaning- ful thermodynamic analysis. The starting point is the following aqueous standard two‐electron reduction potential, which is known experimentally:[30,48,49]
OsO4þ2 H2Oþ2 e−→OsO2ðOHÞ4
2− E°¼0:46 V: At first sight, this reduction potential may seem very low and it might also be somewhat counterintuitive that OsO4 is only a mild oxidant in water. As a qualitative confirmation of this weak oxidizing power, we carried out experiments with iodide ion (E° = 0.54 V). No
reaction was observed at all, which is in agreement with the literature value of the standard reduction potential for the aqueous osmium(VIII)/osmium(VI) couple.
Further thermodynamic data can be found in standard tables[50]: The standard Gibbs free energy of formation for gaseous ethylene isΔfG° = 68.4 kJ mol−1, for liquid ethyl- ene glycolΔfG° =−327.2 kJ mol−1, for liquid waterΔfG°
= −237.1 kJ mol−1, whereas the Henry constant for the dissolution of ethylene in water is 21.7 kPa m3 mol−1.[50] All the thermodynamic data are given for 298.15 K.
A detailed derivation in the Supporting Information is presented to show that these standard thermodynamic data lead to an estimate of the standard free energy change of the dihydroxylation of ethylene with OsO4in aqueous solution:
OsO4ð Þ þaq C2H4ð Þ þaq 4H2O lð Þ→OsO2ðOHÞ42−ð Þaq þC2H6O2ð Þ þl 2Hþð Þaq
ΔG°¼−17:8 kJ mol−1:
It should be emphasized that this estimate is based on firm experimental data only. As the driving force of the entire aqueous reaction is quite small, it is certainly impossible to have a highly exergonic intermediate in it.
This is in agreement with our experimental findings (the osmate ester is a minor intermediate) and the model proposed in this work. Again, we wish to emphasize that the analysis presented here does not necessarily imply that the accuracy of the gas phase quantum chemical calculations are questionable, it is rather a warning that drawing very general conclusions from such data for solution phase reactions has serious limitations.
5 | C O N C L U S I O N
In conclusion, this work reports that the generally accepted, but seldom in fact detected osmium(VI) ester intermediate of the cis dihydroxylation of olefins with osmium tetroxide can be detected by kinetic methods if di‐and trichloroethylenes are used as substrates in aque- ous medium. The kinetic studies have clearly confirmed that this intermediate plays a key role in the chemical transformation. In the catalytic form of this method, less expensive oxidants are employed to convert back the product osmium(VI) into to the original osmium tetrox- ide, but these stoichiometric oxidants do not react with the olefin, so the results reported here are fully transfer- able to catalytic systems as well. It is also important that the possibility of the kinetic detection of the intermedi- ate was not obvious from the studies of the overall
process: neither the simple second order rate equation nor the spectral analysis of spectrophotometric studies provided any clue for the existence of the fast process.
Therefore, it is quite possible that the same strategy will lead to the successful kinetic detection of the intermedi- ate in many other systems as well.
A C K N O W L E D G E M E N T
Work at the University of Pécs was financed by the Higher Education Institutional Excellence Programme of the Ministry of Human Capacities in Hungary, within the framework of the 1st thematic programme of the University of Pécs. Work at the University of Debrecen was supported by the Hungarian Science Foundation (OTKA K_17‐124983). The research was supported by the EU and cofinanced by the European Regional Development Fund under the project GINOP‐2.3.2‐15‐ 2016‐00008.
O R C I D
Gábor Lente https://orcid.org/0000-0003-2022-2156
R E F E R E N C E S
[1] M. Schröder,Chem. Rev.1980,80, 187.
[2] M. M. Heravi, V. Zadsirjan, M. Esfandyari, T. B. Lashaki, Tetrahed. Asymm.2017,28, 987.
[3] J. C. Riemersma,Biochim. Biophys. Acta1968,152, 718.
[4] S. K. K. Galagedera, L. Huynh, F. Wachholz, M. Jacobsen, P.
Haruehanroengra, J. Sheng, A. A. Chen, G. U. Flechsig, Electroanal.2018,30, 398.
[5] P. Havranová‐Vidláková, J.Špaček, L. Vítová, M. Hermanová, J. Dadová, V. Raindlová, M. Hocek, M. Fojta, L. Havran, Electroanal.2018,30, 371.
[6] J. Masís, D. Mankus, S. B. E. Wolff, G. Guitchounts, M. Joesch, D. D. Cox,Sci. Rep.2018,8, 5184.
[7] B. B. Lohray, V. Bhushan, E. Nandanan,Tetrahed. Lett.1994, 35, 4209.
[8] D. Munz, T. Strassner,J. Org. Chem2010,75, 1491.
[9] A. Poethig, T. Strassner,J. Org. Chem.2010,75, 1967.
[10] L. L. Lazarus, R. L. Brutchey,Dalton Trans.2010,39, 7888.
[11] V. Köhler, J. Mao, T. Heinisch, A. Pordea, A. Sardo, Y. M. Wil- son, L. Knörr, M. Creus, J. C. Prost, T. Schirmer, T. R. Ward, Angew. Chem. Inter2011,50, 10863.
[12] K. I. Fujita, K. Inoue, T. Tsuchimoto, H. Yasuda,Chem. Pharm.
Bull.2012,60, 1594.
[13] M. M. Heravi, T. B. Lashaki, B. Fattahi, V. Zadsirjan,RSC Adv.
2018,8, 6634.
[14] R. Criegee,Justus Liebigs Ann. Chem.1936,522, 75.
[15] R. Criegee,Angew. Chem.1937,50, 153.
[16] R. Criegee,Angew. Chem.1938,51, 519.
[17] N. A. Milas, J. H. Trepagier, J. T. Nolan Jr., M. I. Iliopulos, J. Am. Chem. Soc.1959,81, 4730.
[18] R. J. Collin, J. Jones, W. P. Griffith,J. Chem. Soc. Dalton Trans.
1974, 1094.
[19] L. G. Marzilli, B. E. Hanson, T. J. Kistenmacher, L. A. Epps, R.
C. Stewart,Inorg. Chem.1976,15, 1661.
[20] R. J. Collin, W. P. Griffith, F. L. Phillips, A. C. Skapski, Biochim. Biophys. Acta1974,354, 152.
[21] F. L. Phillips, A. C. Skapski,J. Chem. Soc. Dalton Trans.1975, 2586.
[22] T. Strassner,Adv. Phys. Org. Chem.2003,38, 131.
[23] https://www.echa.europa.eu/web/guest/substance‐informa- tion/‐/substanceinfo/100.001.062 (accessed 30 May 2019).
[24] H. F. Stroo, A. Leeson, J. A. Marqusee, P. C. Johnson, C. H.
Ward, M. C. Kavanaugh, T. C. Sale, C. J. Newell, K. D. Pennell, C. A. Lebrón,Environ. Sci. Technol.2012,46, 6438.
[25] S. Yuan, P. Liao, A. N. Alshawabkeh, Environ. Sci. Technol.
2014,48, 656.
[26] K. Manju, D. S. Nair, A. M. Rahnamol, Reac. Kinet. Mech.
Catal.2014,111, 591.
[27] E. Kowalewski, I. I. Kamińska, G. Słowik, D. Lisovytskiy, A.
Śrębowata,Reac. Kinet. Mech. Catal.2017,121, 3.
[28] M. Gabričević, G. Lente, I. Fábián,J. Phys. Chem. A2015,119, 12627.
[29] Z. M. Galbacs, A. Zsednai, L. J. Csányi,Trans. Met. Chem.1983, 8, 328.
[30] D. T. Richens,The Chemistry of the Aqua Ions, Wiley, Chiches- ter1997.
[31] Belinda Julie McFadzean, The Kinetics and Associated Equi- libria of High Oxidation State Osmium Complexes, PhD thesis, Nelson Mandela Metropolitan University, 2007 (https://core.ac.uk/download/pdf/49241525.pdf, accessed May 30, 2019).
[32] T. E. Geswindt, W. J. Gerber, H. E. Rohwer, K. R. Koch,Dalton Trans2011,40, 8581.
[33] B. Tonomura, H. Nakatani, M. Ohnishi, J. Yamaguchi‐Ito, K.
Hiromi,Anal. Biochem.1978,84, 370.
[34] G. Peintler, A. Nagy, A. K. Horváth, T. Körtvélyesi, I. Nagypál, Phys. Chem. Chem. Phys.2000,2, 2575.
[35] T. Ditrói, G. Lente,J. Phys. Chem. A2018,122, 5503.
[36] M. T. Beck, I. Nagypál, Chemistry of Complex Equilibria, Akadémiai Kiadó, Budapest1990.
[37] Y. E. Yan, F. W. Schwartz,Environ. Sci. Technol.2000,34, 2535.
[38] K. C. Huang, G. E. Hoag, P. Chedda, B. A. Woody, G. M.
Dobbs,J. Hazard. Mater. B2001,87, 155.
[39] C. Bernasconi,Relaxation Kinetics, Academic Press, New York 1976.
[40] H. Strehlow, Rapid Reactions in Solutions, VCH Publishers, Weinheim1992.
[41] J. H. Espenson, Chemical Kinetics and Reaction Mechanisms, 2nd ed., McGraw‐Hill, New York1995.
[42] A. K. Covington, M. I. A. Ferra, R. A. Robinson, J. Chem,Soc., Faraday Trans. 11977,73, 1721.
[43] A. G. Dickson, J. P. Riley,Marine Chem.1979,7, 89.
[44] G. Lente, I. Fábián,Inorg. Chem.1998,37, 4204.
[45] G. Lente,Deterministic Kinetics in Chemistry and Systems Biol- ogy, Springer, New York2015.
[46] U. Pidun, C. Boehme, G. Frenking,Angew. Chem. Int. Ed.1996, 35, 2817.
[47] P. Gisdakis, N. Rösch,J. Am. Chem. Soc.2001,123, 697.
[48] R. N. Goldberg, L. G. Hepler,Chem. Rev.1968,68, 229.
[49] W. M. Latimer, Oxidation States of the Elements and their Potential in Aqueous Solution, Prentice‐Hall, Englewood Clipps 1952.
[50] D. R. Lide (Ed),CRC Handbook of Chemistry and Physics, 87th ed., CRC Press, Boca Raton1996.
S U P P O R T I N G I N F O R M A T I O N
Additional supporting information may be found online in the Supporting Information section at the end of the article.
How to cite this article: GabričevićM, Lente G, Fábián I. Kinetic detection of osmium (VI) ester intermediates during the OsO4‐mediated aqueous dihydroxylation of chloroethylenes. J Phys Org Chem. 2020;33:e4045.https://doi.org/10.1002/poc.4045