Longer Achilles tendon moment arm results in better running economy
B. KOV ACS
1p, I. K OBOR
2, O. SEBESTY € EN
1and J. TIHANYI
11Department of Kinesiology, University of Physical Education, Budapest, Hungary
2Semmelweis University, MR Research Centre, Budapest, Hungary
Received: April 8, 2020 • Accepted: August 29, 2020 Published online: January 06, 2021
© 2020 The Author(s)
ABSTRACT
Based on the current literature, the link between Achilles tendon moment arm length and running economy is not well understood. Therefore, the aim of this study was to further investigate the connection between Achilles tendon moment arm and running economy and the influence of Achilles tendon moment arm on the function of the plantarflexor muscle-tendon unit during running.
Ten male competitive marathon runners volunteered for this study. The participants ran on a treadmill at two running speeds: 3 and 3.5 m s1. During running the oxygen consumption, lower leg kinematics, electrical activity of plantar flexor muscles, and fascicle behavior of the lateral gastrocnemius were measured simultaneously. On the second occasion, an MRI scan of the right leg was taken and used to estimate the Achilles tendon moment arm length.
There was a negative correlation between running economy and the body height normalized moment arm length at both selected speeds (r50.68,P50.014 andr50.70,P50.01). In addition, Achilles tendon moment arm length correlated with the amplitude of the ankleflexion at both speeds (r50.59, P50.03 andr50.60,P50.03) and with the electrical activity of the medial gastrocnemius muscle at 3 m s1speed (r50.62,P50.02). Ourfinding supports the concept that a longer moment arm could be beneficial for distance runners.
KEYWORDS
moment arm, running economy, EMG, MRI
pCorresponding author. E-mail: k.balint828@gmail.com; Tel.:þ36 303460177 All authors contributed equally to this study.
INTRODUCTION
Running economy (RE) is defined as the oxygen or energy cost of transport at a given speed and distance [1], as a better RE refers to a smaller rate of oxygen consumption. RE is influenced by several biomechanical factors [2] that include structural parameters of the lower leg [3–6].
Moreover, the lower leg produces most of the propulsive force, and it consumes a large portion of the energy cost of running [7]. Storage and recoil of elastic strain energy in Achilles tendons substantially reduce the energy cost of running [8, 9]. The amount of energy stored in a tendon depends on the force that stretches the tendon. The magnitude of force production during running depends on the running velocity and the joint angular displacement [10].
The ankle joint torque production is influenced by the length of the joint moment arm [11].
For example, when the moment arm length shortens, then the force exerted by the muscle should increase to keep the torque constant. The Achilles tendon moment arm (AT-MA) is genetically determined, and it has a great individual variability [4–6, 12].
During the last two decades several studies investigated the effect of the AT-MA on running economy (RE) and performance [3–6, 13, 14]. Most of them reported that a shorter AT-MA is associated with better RE and running performance [3, 4, 6, 13]. Scholz et al. [6], similarly to others [3, 4], reported that variation in moment arm length can explain more than 56 percent of the variation in RE, suggesting that a shorter moment arm might be beneficial for a greater storage and release of elastic strain energy, thus lead to a reduced energy cost of running. This finding was supported by several other studies, namely, shorter AT-MA length resulted in decreased contraction velocity during dynamic contraction [11] and increased leg stiffness [3], which was shown to be related to better RE. The main assumption behind this concept has been that the shorter AT-MA increases the tendon force, thus it results in a greater degree of Achilles tendons stretch [5]. This additional tendon stretch enables to convert a higher amount of kinetic energy into elastic energy, and the recoil of this energy leads to a lower energy cost of running.
However, this assumption neglects the possibility that the additional force requires more metabolic energy than can be stored and recoiled in the Achilles tendon during the process [15].
Indeed, other researchers found that a shorter AT-MA increases the tendon force, but did not find that a shorter AT-MA leads to lower oxygen consumption [14]. Interestingly, Sano et al. [5]
reported that a longer moment arm correlated with better running race performance when both Kenyan and Japanese runners were merged in a group for correlation analysis purposes. The reason for this is that Kenyan runners have longer AT-MA and better running race time than Japanese runners, but within each group there was no correlation between AT-MA and running performance. In this study RE was not assessed, but running performance was shown to correlate with RE [16, 17]. However, this connection is less clear in the case of Kenyan distance runners [4], thus we cannot conclude that a longer AT-MA can decrease oxygen consumption.
Kunimasa et al. [18] suggested that a longer AT-MA may reduce the force on the Achilles tendon and, as a consequence, the triceps surae muscle’s electrical activity (EMG) is also reduced when the same torque generation is required. It is well documented that a smaller tendon force couples with a smaller tendon strain, and therefore Sano et al. [5] suggested that it can maintain the tendon stiffness at a similar level during endurance running. A longer AT-MA is also associated with a smaller amount of medial gastrocnemius (MG) fascicle length changes and lower MG EMG activity paired with a relative longer tendon elongation, which seems to be an economical way to use both tendon and muscle within the muscle-tendon unit [5].
As shown above, there is no comprehensive agreement among researchers about the asso- ciation between AT-MA and RE, i.e., whether it is short or long AT-MA that is more beneficial for running economy. Therefore, we aimed to investigate the connection between AT-MA and RE selecting a truly homogeneous group, i.e., the participants were all Caucasian marathon runners of approximately the same training age. To achieve our goal, we carried out an experiment similar to that reported by Sano et al. [5] with additional measurement of RE. Since the velocity of running has an impact on motor function, runners ran at two different speeds, similar to speeds used in earlier studies [4, 5]. Following the concept proposed by Sano et al. [5], we hypothesized that a longer AT-MA reduces the energy cost of running, because less effort is required to produce the same joint torque. In this case, a lower EMG activity and smaller fascicle length changes can be expected in order to maintain appropriate and economical propulsion.
MATERIAL AND METHODS
Participants
Ten national and international caliber distance runners (age: 29±3.8years, body height: 177.1± 8.9 cm, body mass: 65.4±5.8 kg) volunteered for this study. The runners regularly exercised and took part in marathon races. Their weekly training volume ranged between 120 and 200 km on average. Their personal best IAAF (International Amateur Athletic Federation) score was 888.0
±184.0 in marathon running. The participants had no history of musculoskeletal injury in the last two years and had no pain in the lower extremities prior to the experiment. All participants were in the midseason when the experiment was performed. The participants gave written informed consent to take part in the study, which was performed in accordance with the Declaration of Helsinki and was approved by the local scientific ethics committee of the Uni- versity of Physical Education (TE-KEB/No. 07/2018). The athletes were encouraged to abstain from hard training sessions and to refrain from alcohol and caffeine ingestion for at least 24 h before testing and to be well rested. All runners had previous experience with treadmill running.
Protocol
To determine the RE and biomechanical characteristics of running, an incremental and sub- maximal treadmill protocol was used. The test began at 2.5 m s1running for 5 min as a warm- up, then two constant-speed running sets lasted 10 min continuously with increasing the speed to 3 m s1then 3.5 m s1. All participants wore their own running shoes. Lower leg joint ki- nematics, electromyography activity (EMG) of ankle plantar flexor muscles, and fascicle behavior of the lateral gastrocnemius from the right leg and the relative oxygen consumption were recorded simultaneously during the running. On a separate day (1 week after the treadmill test) participants came to the MR Research Centre, where the right leg was scanned to estimate the length of the AT-MA.
Kinematic measurements
To estimate knee and ankle angular displacements during running, lower body kinematics was recorded with an 18 camera, video-based motion analysis system (OptiTrack Flex 13, Natu- ralPoint, OR, USA). A modified Helen-Hayes model was used to mount 19 reflective markers on
the lower limbs of the participants. The marker trajectories were recorded in three dimensions sampling at 100 Hz in Motive software (NaturalPoint, OR, USA). To estimate segment lengths, joint centers and joint coordinates, and optimize the model, a static standing pose was recorded before recording marker displacements during running.
EMG measurement
EMG signals were recorded from the right leg using a TeleMyo telemetric hardware system (Noraxon U.S. Inc., Scottsdale, Az, USA) at a sampling frequency of 1,000 Hz. After skin preparation (shaved, abraded lightly and cleaned with alcohol), silver-silver chloride Ambu BlueSensorN bipolar surface electrodes (Blue Sensor M-00-S/25, Ambu, Denmark) with a 10- mm diameter and an inter-electrode distance of 20 mm (center-to-center) were placed over four major muscles of the right shank: medial gastrocnemius (MG), lateral gastrocnemius (LG), soleus (SOL) and tibialis anterior (TA). The SENIAM guideline [19] was followed basically, but ultrasonography was also used to define the most appropriate area to place the electrodes to ensure that electrodes were aligned parallel with the fascicle orientation and to minimize cross- talk between the observed and the underlying muscles. In the case of SOL the electrodes were placed on the lateral side of the muscle [20]. For the proper placement of the ultrasound probe (ultrasound preparation detailed below) the EMG electrodes for LG were placed slightly lateral to the muscle midbelly. The reference electrode was placed on the ipsilateral patella. EMG cables were taped over the skin to minimize movement artefacts.
Ultrasonography measurement
An ultrasound device (Hitachi-Aloka EUB 405 plus, Japan) was used to measure fascicle length changes in LG during running at a scanning frequency of 50 Hz with a linear B mode (6 cm field-of-view, B-mode linear array probe, 7.5 MHz scanning frequency). The ultrasound probe was positioned over approximately the midbelly of the right LG in the plane of the fascicles. The probe was secured using a custom-made cast and tightly fixed around the shank to minimize probe movement relative to the skin. Data were sampled from the last 30 s of 3 and 3.5 m s1 running andfive steps per interval were analyzed from each runner, then the mean of thesefive steps was included in further analysis.
Running economy measurement
During all tests, gas-exchange data were collected continuously using an automated breath-by- breath system (Cosmed K5, Rome, Italy). Before each test, the gas analyzer was calibrated with gases of known concentration (16% O2and 5% CO2) and ambient air. VO2(O2min1) values were collected during each running speed and the data were averaged for every 30-s interval.
The last 30 s of the 3 and 3.5 m s1speeds were averaged and used as RE (Fig. 1).
MRI measurement
To estimate AT-MA length MRI scans were acquired. For this purpose, a 3T Philips scanner (Ingenia 3.0T MR system, Amsterdam, Netherland) was used. The participants laid on their sides, and the right ankle was set in a neutral angle position. The joint angles were measured with a goniometer to ensure the same joint position for each participant. Then the ankle was
secured with sandbags to fix the joint during the scan. The scan was retaken with 15-degree plantar flexion angle position. The scans were performed using a T1 weighted turbo spin echo sequence (slice thickness510 mm, slice gap50 mm, slices scan order: interleaved, TR5650 ms, TE520) at all measurements.
DATA PROCESSING
Kinematic analysis
Marker trajectories were smoothed with a 10-Hz low-pass Butterworth filter, then knee and ankle joint angles were calculated in Opensim (SimTK v. 4.0.1.) software using inverse kine- matics and a modified Helen–Hayes model. Joint angles were calculated for each step, but only five continuous steps were selected from both running speeds and included in the analysis.
The angular data were time-normalized, then the steps were averaged for each running speed and individual. Next we calculated the amplitude of joint angular displacement over the braking and push off phase. Additionally, joint angles and contact timings were used to define step subphases as braking and push-off phase. The braking phase was considered as the period between the initial foot contact and the most dorsiflexed ankle angle, and the push off phase was considered as the period between the lowest ankle angle and toe off.
EMG analysis
Raw EMG signals were band-pass filtered (20–450 Hz) with a fourth-order zero-lag Butterworth filter to remove movement artefacts and signal noise. The root-mean square values of the EMG signals were calculated for the following two phases: braking and push off phases. The EMG signals were normalized to the peak activity of the muscles from the corresponding running speed. Next the EMG values were averaged for each phase. Data analysis included five continuous steps of running for each participant, then the average of these five steps was used to characterize the neuromuscular pattern of the steps.
Ultrasound analysis
Images were analyzed using SMA (Simple Muscle Architecture Analysis) automated algorithm developed by Seynnes and Cronin [21]. The software has been demonstrated to be equally valid to manual segmentation [21]. The ultrasound images which had been recorded during the corresponding five continuous steps determined from the kinematic data were analyzed. The region of interest was manually outlined on each image, then the algorithm detected the upper and lower aponeuroses. Next the maximal fascicle length of this area was defined by the soft- ware. Thereafter we calculated the fascicle length change under the braking and push off phase.
The mean values of five steps were used in the statistical analysis. The image process was recorded and stored in a computer in digital format.
Estimation of the Achilles tendon moment arm
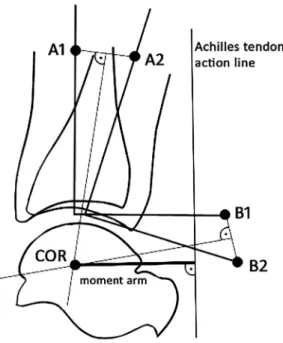
MRI images were analyzed using ImageJ software (version 1.8.0, USA 2006). Images from the ankle in the sagittal plane were used to estimate the moment arm length. The ankle joint was
represented by the tibiotalar joint. For the Reuleaux graphical analysis [22] two markers are required to be placed on the images (Fig. 2). In the image made in a neutral joint position, point A1 was marked along the longitudinal axis of the tibia 7 cm proximal to the most distal articular surface of the bone. Point B1 was placed 7 cm distal and 7 cm posterior to point A1 at a line perpendicular to the longitudinal axis. The same process was applied for the next image (158plantarflexion) to set points A2 and B2 as well. The two images were placed on each other in such a way that the two talus bones overlapped each other. Points A1 and A2 were connected by a straight line and so were points B1 and B2. A perpendicular line was placed to the bisectors, and the intersection of the two bisectors was marked as the center of rotation. The AT action line was considered as a straight line and it was identified at the 90-degree ankle position. The shortest perpendicular distance from the center of rotation to the tendon action line was the moment arm length (Fig. 1). Since the inter-individual variation in body height was great (range 1.64–1.92 m), AT-MA was normalized to body height as described by Scholz et al. [6].
Statistical analysis
Normal Gaussian distribution of the data was confirmed using Shapiro–Wilk’s test of normality.
Pearson’s correlation coefficients were used to assess the correlation between AT-MA and RE and also between AT-MA and neuromuscular and fascicle characteristics. To determine the magnitude of significance we used the thresholds recommended by Hopkins et al. [23] (0–0.1 as small, 0.1–0.3 as moderate, 0.3–0.5 as large, 0.5–0.7 as very large and 0.9–1 as extremely large correlations). Additionally, the 95% confidence intervals for each corresponding Pearson coef- ficient were calculated. In the case of non-Gaussian data distribution, a Spearman rank corre- lation was used. To test statistically the difference between joint angular displacement, EMG amplitudes and fascicle behavior we used SPM analysis in Matlab using the open-source spm1d code (SPM 30, v0.4,www.spm1d.org). SPM two-tailed pairedt-tests were used to compare time- normalized variables between the two running speeds. First, the scalar output (SPM{t}) was calculated, then the critical threshold (t*), at which only a% of smooth random curves are expected to be traverse. If the t-test statistic trajectory crossed the critical threshold, the dif- ference was statistically significant. The technical details of SPM are described elsewhere [24, 25]. To determine the reliability of AT-MA estimation an intraclass correlation coefficient (ICC) was calculated using a two-way mixed-effects model (average measures). The ICC estimate was considered good between 0.75 and 0.9 and excellent above 0.9 [26]. To determine the bias between the raters and the limits of agreement (in supplementary) a Bland Altman plot was used. The alpha level was set at P≤0.05.
RESULTS
The AT-MA length and the normalized length were 4.97±0.61 and 0.03±0.002 cm, respectively.
The means and the standard deviations of the measured and calculated variables at the two applied running speeds are shown inTable 1. There was no difference between the two running speeds in mean EMG activity. Both speeds showed a similar neuromuscular pattern (Fig. 3). The electrical activity of the selected muscles showed a typical neuromuscular pattern, which characterizes the rear foot strike running. TA showed the highest EMG activity at the early stance phase due to minimal plantarflexion after the initial ground contact, which can be observed at rear foot strike
Fig. 1.Running economy measurement protocol. The blue line represents mean oxygen consumption over treadmill running and the blue shaded area represents SD. Numbers 1 and 2 represent the two 30-s
sampling periods
Fig. 2.Method used for locating the center of rotation (COR) at neutral joint position. Plantarflexion of the ankle is represented by movement of the tibia with markers A1 and B1 to the next joint position with A2 and B2, respectively. Corresponding markers were connected by straight lines. Perpendicular bisectors were constructed for each line and their intersection marked the COR. Next the action line of the Achilles tendon
was marked in the image. Then a perpendicular line was drawn between COR and the action line of the Achilles tendon, and the length of this line was considered as the length of the Achilles tendon moment arm
Table 1.Means and±SD for the measured variables. Abbreviations: tibialis anterior (TA), soleus (SOL), medial gastrocnemius (MG), lateral gastrocnemius (LG), braking phase (BP), push off phase (PO), peak
normalized mean EMG (norm%)
Measured variables Running speed
3.0 m s1 3.5 m s1
VO2(mL/min/kg) 40.55±1.82 42.96±2.11
TA EMG braking phase (norm%) 0.42±0.11 0.37±0.11
SOL EMG BP (norm%) 0.44±0.14 0.38±0.09
MG EMG BP (norm%) 0.50±0.09 0.39±0.12
LG EMG BP (norm%) 0.48±0.10 0.43±0.11
TA EMG push off phase (norm%) 0.19±0.07 0.20±0.07
SOL EMG PO (norm%) 0.29±0.14 0.44±0.12
MG EMG PO (norm%) 0.38±0.13 0.46±0.17
LG EMG PO (norm%) 0.13±0.12 0.50±0.11
Resting fascicle length (cm) 4.25±0.51 4.48±0.60
Length change BP (cm) 0.30±0.46 0.24±0.17
length change PO (cm) 0.28±0.40 0.41±0.33
Ankle angle amplitude BP (rad) 0.21±0.07 0.21±0.07
Ankle angle amplitude PO (rad) 0.55±0.14 0.62±0.07
Fig. 3.Normalized electrical activity (EMG), knee and ankle joint angular displacement and fascicle length curves during braking phase (jointflexion) and push off phase (joint extension). The green line represents the mean values at 3 m s1running speed and the green shaded area shows SD. The red line represents the mean values at 3.5 m s1running speed and the red shaded area shows SD. Abbreviations: tibialis anterior
(TA), soleus (SOL), medial gastrocnemius (MG), lateral gastrocnemius (LG)
runners (Fig. 3) [27]. There were relatively small amplitude length changes in the mean fascicle length of LG over the stance phase, but there was a relatively high inter-individual variability in the amplitude of the fascicle length changes (Fig. 3). The knee and ankle joint angular displacements were almost the same at both speeds (Fig. 3). At the initial ground contact, the ankle was in a slight dorsiflexed position at both speeds (0.10±0.10 rad and0.08±0.10 rad) followed by a slight ankleflexion then ankle extension. The ratio of the ankle angle amplitude during braking to push off phase was 2.97±1.23 at 3 ms1and 3.17±1.14 at 3.5 m s1running speed. The ankleflexion amplitude was similar at both speeds, but the ankle extension amplitude increased from 0.56± 0.14 rad at 3 m s1to 0.62±0.07 rad at 3.5 m s1 running speed.
Correlation analysis
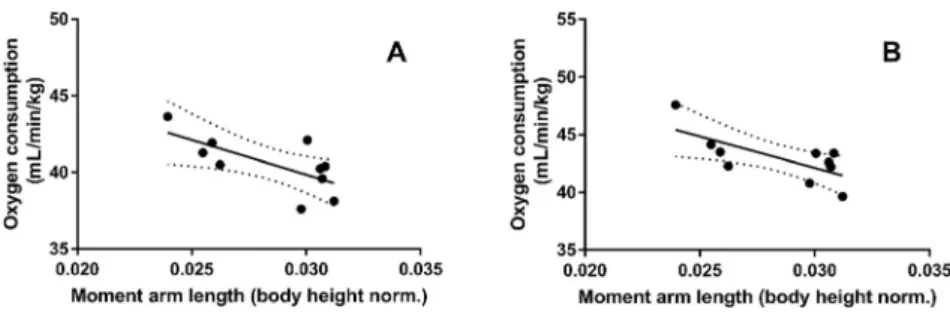
We found negative correlation between the moment arm length (normalized to body height) and the oxygen consumption at both running speeds (3.0 m s1,r50.68,P50.01 and 3.5 m s1,r50.70,P50.01) (Fig. 4.) A significant negative correlation was revealed between ankle flexion and extension amplitude with AT-MA at the 3 m s1(r50.59,P50.03) and also at 3.5 m s1 running speed (r50.60,P50.03) (Fig. 5).
A higher oxygen consumption at 3 m s1running speed was associated with a smaller MG electrical activity (r5 0.62, P50.02) at the braking phase of the stance. In addition, ankle flexion and extension amplitude correlated with oxygen consumption at 3.5 m s1speed (r5 0.65,P50.038), but not at 3 m s1 speed (r 50.58,P50.064).
Fig. 4.Correlation between body height normalized Achilles tendon moment arm length and oxygen con- sumption. (A) At 3 m s1running speed (r50.68,P50.01) and (B) at 3.5 m s1speed (r50.70,P50.01)
Fig. 5.Correlation between body height normalized Achilles tendon moment arm length and ankleflexion.
(A) At slow running speed (r50.59,P50.03) and (B) at moderate speed (r50.60,P50.031)
DISCUSSION
The main aim of this study was to examine the connection between RE and AT-MA, and also the effect of AT-MA on joint kinematics, muscle EMG activity and fascicle behavior during submaximal running. Confirming our expectation, the results showed that a longer AT-MA (normalized to body height) was related to a superior RE among our participants, i.e., marathon runners with longer AT-MA length have had less oxygen consumption during constant running speed.
In the introductory part, it was indicated that our test protocol was similar to that of Sano et al. [5]. However, some differences must be underlined. Our subjects formed a homogeneous group, as marathon race was their main event and all of them belonged to the same human race.
Furthermore, we used MR images to estimate AT-MA, which is considered to be a more ac- curate method [12]. Comparing our AT-MA data to those of the previous studies [3, 4, 6, 12, 28]
it can be concluded that our data are similar to those. There is evidence to suggest that RE and running performance do relate [17, 29], but others are in disagreement [4]. However, the question arises whether better RE is coupled with better running performance, since both are influenced by several diverse factors [1, 30]. The reports are contradictory in this respect. Some researchers found a significant correlation between RE and running performance [17, 29]. On the contrary, Mooses et al. [4] reported recently that there was no correlation between running performance determined on the basis of the International Amateur Athletic Federation score table [31] and RE in a group consisting only of East African long and middle distance runners.
Although they stressed that their sample of runners was homogeneous concerning human race, because their runners belonged to the same tribe [5]. On the other hand, from the point of view of running distance the sample in the study of Sano et al. [5]can be considered non-homoge- neous, because there are substantial differences between slow and fast running concerning running and joint kinematics [32, 33]. It is known that with increased running speed the foot strike pattern changes, i.e., long distance runners including marathon runners use rearfoot strike [34–36] and the great majority of middle distance runners adopt forefoot or midfoot strike running pattern [37]. It is conceivable that the foot-strike pattern may influence RE and alter the relationship between RE and AT-MA length. However, Gruber et al. [38] demonstrated that forefoot strike running is not more economical than rearfoot strike. We did not determine the landing type directly, but the high EMG activity of the tibialis anterior muscle at the beginning of the foot-strike, which is characteristic of rearfoot striking [27] indicated that runners in our study used rearfoot striking. Most probably in all cited studies the subjects used rearfoot strike pattern, in spite of the fact that no strike pattern determination was carried out because the running speed was low. Thus we can conclude that foot-strike pattern is not a significant influencing factor that can explain the difference between ourfindings and those of Scholz et al.
[6], Barnes et al. [3], and Mooses et al. [4]. The constant running speed used for the deter- mination of RE was almost the same (12–16 km/h) in these three studies. We applied the slowest speed and, as a consequence, we measured the lowest VO2 consumption (43 mLkg1min1).
However, it is not probable that these differences resulted in the opposite relationship between RE and AT-MA length observed in this study and that reported by Scholz et al. [6], Barnes et al.
[3], and Mooses et al. [4].
Scholz et al. [6] made a musculo-skeletal model to test the biomechanical consequence of AT-MA length. They demonstrated that the muscle should exert greater force when the AT-MA
length is shorter and, as a consequence, the tendon strain becomes greater. This would increase the tendon stress which is associated with greater elastic energy storage and allows to utilize more elastic energy, thus that would lower the plantarflexor muscles’energy cost during joint extension [39, 40]. As a consequence, RE increases, i.e., less oxygen is required. This theoretical approach was tested in their experiment, and they proved this concept. This finding was confirmed in the study of Barnes et al. [3] and Mooses et al. [4]. We had another concept and we hypothesized that if AT-MA increases, the plantarflexor muscles need to generate less force to produce the same torque, therefore the muscle consumes less energy during muscle stretch.
Because the muscle force is reduced, the tendon stretch will be shorter, associated with smaller joint extension. We assumed that the reduced stored elastic energy is sufficient for doing the same muscle work, and then the runners with longer moment arm can run more efficiently.
In concert with our hypothesis, we observed that the normalized AT-MA length is linearly correlated with oxygen consumption at both 3 and 3.5 m s1speed. Namely, those marathon runners who had longer AT-MA were able to consume less oxygen, i.e., could run more economically. As we assumed, shorter ankle angular displacement was observed in those run- ners who had longer AT-MA, which may indirectly indicate a more efficient energy con- sumption.
Based on literature reports, AT-MA length decreases during dorsiflexion and increases with plantarflexion [41–46]. During the braking phase when dorsiflexion occurs, it is more likely that AT-MA length decreases, thus a longer AT-MA would be beneficial to stretch the tendon with smaller muscle work compared to a shorter AT-MA. If we assume that the elastic energy storage and recoil plays an important role in lowering the energy cost of running [47], then during push off, when the muscle-tendon unit shortens, the muscle should operate at close to the resting length, and most of the length changes should occur in the tendon to recoil the elastic energy and reduce the metabolic cost of muscle work [39, 40]. In this case the joint flexion and extension amplitude should be similar. Our results showed that ankle extension amplitude is twofold greater than ankleflexion, which means that during push off the muscle must also shorten (increased metabolic cost) with the Achilles tendon. In this case a longer AT-MA would allow generating the joint torque with smaller muscle work, lowering the metabolic cost of the contraction compared to shorter AT-MA. Because the muscle generates less force, a greater contraction velocity can be applied, which means that it can propel the body mass at higher speed, consequently with a higher running speed, or at a lower energy cost of running at the same speed.
We measured only the length change of the LG muscle. There was relatively little length change of the fascicles during both joint flexion and extension, indicating low energy con- sumption [39]. Unfortunately, we were not able to measure the length change of the Achilles tendon. Therefore, we could not estimate the amount of strain in the tendon. However, it can be assumed that the AT was elongated mostly within the muscle tendon unit because of the short fascicle length change, as shown in previous studies [5, 48]. We observed great variation in fascicle length change and no correlation between fascicle elongation and ankle joint angular displacement. We did not estimate how much force was exerted by the plantarflexor muscles during braking and push off phases, but it could be expected that if a longer AT-MA is asso- ciated with less force, then EMG activity is also smaller, Indeed, we observed a significant correlation between AT-MA and EMG of the MG muscle. In addition, runners with better RE showed lower EMG activity of MG during the push off phase at 3.5 m s1speed. The observed
neuromuscular activity pattern in this study resembles the results of Japanese runners at similar running speeds [5]. AT-MA length seems to have an influence on ankle joint rotation, since a smaller amount of ankle rotation was observed in the case of runners possessing longer AT-MA and it might be sufficient to maintain the proper propulsion. Although a smaller ankleflexion would result in a smaller muscle-tendon unit lengthening, therefore less amount of elastic strain energy could be stored in the Achilles tendon. On the other hand, a lower contraction force demands a lower metabolic cost, which can decrease the energy cost of running.
It seems that a shorter AT-MA increases the force of the contractile elements that stretch the tendon [14], and increases tendon stiffness [3]. These conditions are beneficial for better elastic energy storage and recoil; however, it was suggested that the greater muscle force that stretches the tendon requires more metabolic energy than can be additionally stored in the tendon [15].
Several reports found that a shorter AT-MA is beneficial for lower oxygen consumption, but there are different results as well. van Werkhoven and Piazza [14] found no correlation between AT-MA and oxygen consumption; Sano et al. [5] reported that a longer AT-MA and a longer Achilles tendon were advantageous for Kenyan runners who had superior RE compared to Japanese runners. Because RE is influenced by several factors [1, 10, 49], it is possible that different combinations of these variables can be equally efficient. We have demonstrated that a longer AT-MA with smaller ankle flexion angular displacement and lower MG muscle EMG activity is associated with lower oxygen consumption. Studies in favor of shorter AT-MA [3, 4, 6] did not measure joint angular characteristics and neuromuscular activity patterns during the running test, which would have provided a more comprehensive view. Therefore we can assume that differences in these variables and/or other influencing factors can explain the different outcome of our study.
The methodology that we used in this study has some limitations and this should be addressed. We could not measure or calculate the whole muscle-tendon unit and tendon length changes, which would provide more valuable information about the tendon length changes that occurred during running. A two-dimensional ultrasound technique was used to observe the length changes of LG regardless of the three-dimensional structures of this muscle. It must be noted that this method has potential errors that occur during running or any other dynamic movement, and currently it is not possible to quantify due to a limitation of two dimensions and may not be consistent throughout the step cycles. However, the estimated fascicle length changes during both speeds were similar to previous reports [5]. We used 3 and 3.5 m s1 running speeds for the treadmill protocol, like in previous studies [4, 5]. It was also the speed limit of the treadmill that we used during the experiment, but lower leg function and muscle-tendon interaction have different operating conditions at a higher running speed. A higher running speed would be also closer to the racing velocity of the investigated athletes, which would represent more detailed information about lower leg function close to a race-like situation.
In summary, we found that longer AT-MA was associated with better RE. In addition, longer AT-MA was associated with smaller ankle flexion and smaller EMG activity of the MG muscle.
Also, a lower EMG activity of MG was linked to better RE. As a conclusion, we demonstrated that longer normalized AT-MA may reduce the metabolic cost of muscle work and can contribute to a better running performance. Because the plantar flexor muscles need to exert less force to produce the same moment, the Achilles tendon is less stressed, therefore tendon injury incidents can be minimized. We may also conclude that our findings may be relevant for Caucasian marathon runners adopting primarily rearfoot strike pattern.
Conflict of interest:The authors declare that they have no conflict of interest.
REFERENCES
1. Saunders PU, Pyne DB, Telford RD, Hawley JA. Factors affecting running economy in trained distance runners. Sport Med 2004; 34: 465–85.
2. Moore I. Is there an economical running technique? A review of modifiable biomechanical factors affecting running economy. Sport Med 2016; 46: 793–807.
3. Barnes KR, McGuigan MR, Kilding AE. Lower-body determinants of running economy in male and female distance runners. J Strength Cond Res 2014; 28: 1289–97.
4. Mooses M, Mooses K, Haile DW, Durussel J, Kaasik P, Pitsiladis YP. Dissociation between running economy and running performance in elite Kenyan distance runners. J Sports Sci 2015; 33: 136–44.
5. Sano K, Nicol C, Akiyama M, Kunimasa Y, Oda T, Ito A, et al. Can measures of muscle–tendon interaction improve our understanding of the superiority of Kenyan endurance runners? Eur J Appl Physiol 2015; 115:
849–59.
6. Scholz MN, Bobbert MF, van Soest AJ, Clark JR, van Heerden J. Running biomechanics: shorter heels, better economy. J Exp Biol 2008; 211: 3266–71.
7. Kram R, Taylor CR. Energetics of running: a new perspective. Nature 1990; 6281: 265–7.
8. Biewener AA, Roberts TJ. Muscle and tendon contributions to force, work, and elastic energy savings: a comparative perspective. Exerc Sport Sci Rev 2000; 28: 99–107.
9. Cavagna GA, Saibene FP, Margaria R. Mechanical work in running. J Appl Physiol 1964; 19: 249–56.
10. Fletchern JR, MacIntosh BR. Running economy from a muscle energetics perspective. Front Physiol 2017;
433.
11. Nagano A, Komura T. Longer moment arm results in smaller joint moment development, power and work outputs in fast motions. J Biomech 2003; 36: 1675–81.
12. Rugg SG, Gregor RJ, Mandelbaum BR, Chiu L. In vivo moment arm calculations at the ankle using magnetic resonance imaging (MRI). J Biomech 1990; 23: 495–501.
13. Raichlen DA, Armstrong H, Lieberman DE. Calcaneus length determines running economy: Implications for endurance running performance in modern humans and Neandertals. J Hum Evol 2011; 60: 299–308.
14. Werkhoven HV, Piazza SJ. Does foot anthropometry predict metabolic cost during running? J Appl Biomech 2017; 33: 317–22.
15. Fletcher JR, MacIntosh BR. Achilles tendon strain energy in distance running: consider the muscle energy cost. J Appl Physiol 2015; 118: 193–99.
16. Conley DL, Krahenbuhl GS. Running economy and distance running performance of highly trained athletes.
Med Sci Sports Exerc 1980; 12: 357–60.
17. Santos-Concejero J, Tam N, Granados C, Irazusta J, Bidaurrazaga-Letona I, Zabala-Lili J, et al. Stride angle as a novel indicator of running economy in well-Trained runners. J Strength Cond Res 2014; 28: 1889–95.
18. Kunimasa Y, Sano K, Oda T, Nicol C, Komi P V., Locatelli E, et al. Specific muscle-tendon architecture in elite Kenyan distance runners. Scand J Med Sci Sport 2014; 24: 269–74.
19. Hermens HJ, Freriks B, Disselhorst-Klug C, Rau G. Development of recommendations for SEMG sensors and sensor placement procedures. J Electromyogr Kinesiol 2000; 10: 361–74.
20. Peter A, Hegyi A, Stenroth L, Finni T, Cronin NJ. EMG and force production of theflexor hallucis longus muscle in isometric plantarflexion and the push-off phase of walking. J Biomech 2015; 48: 3413–9.
21. Seynnes OR, Cronin NJ. Simple muscle architecture analysis (SMA): An ImageJ macro tool to automate measurements in B-mode ultrasound scans. PLoS One 2020; 15.
22. Reuleaux F. (Translated by A. B. W. Kennedy (1963). Theoretische kinematic: Grundzuge einer theorie des maschinewesens (The Kinematics of Machinery: Outlines of a Theory of Machines). London: MacMillan, New York: Dover; 1875.
23. Hopkins WG, Marshall SW, Batterham AM, Hanin J. Progressive statistics for studies in sports medicine and exercise science. Med Sci Sports Exerc 2009; 41: 3–13.
24. Pataky TC, Robinson MA, Vanrenterghem J. Region-of-interest analyses of onedimensional biomechanical trajectories: bridging 0D and 1D theory, augmenting statistical power. PeerJ 2016; 11.
25. Pataky TC, Vanrenterghem J, Robinson MA. The probability of false positives in zero-dimensional analyses of one-dimensional kinematic, force and EMG trajectories. J Biomech 2016; 49: 1468–76.
26. Koo TK, Li MY. A guideline of selecting and reporting intraclass correlation coefficients for reliability research. J Chiropr Med 2016; 15: 155–63.
27. Landreneau LL, Watts K, Heitzman JE, Childers WL. Lower limb muscle activity during forefoot and rearfoot strike running techniques. Int J Sports Phys Ther 2014; 9: 888–97.
28. Sano K, Ishikawa M, Nobue A, Danno Y, Akiyama M, Oda T, et al. Muscle-tendon interaction and EMG profiles of world class endurance runners during hopping. Eur J Appl Physiol 2013; 113: 1395–403.
29. Jones AM. The physiology of the world record holder for the women’s marathon. Int J Sports Sci Coach 2006;
1: 101–16.
30. Morgan DW, Martin PE, Krahenbuhl GS. Factors affecting running economy. Sport Med 1989; 7: 310–30.
31. Spiriev B. IAAF scoring tables of athletics. Monaco: Multiprint; 2011.
32. Novacheck TF. The biomechanics of running: review paper. Gait Posture 1998; 7: 77–95.
33. Padulo J, Annino G, Migliaccio GM, D’Ottavio S, Tihanyi J. Kinematics of running at different slopes and speeds. J Strength Cond Res 2012; 26, 1331–9.
34. Hanley B, Bissas A, Merlino S, Gruber AH. Most marathon runners at the 2017 IAAF World Championships were rearfoot strikers, and most did not change footstrike pattern. J Biomech 2019; 92: 54–60.
35. Hasegawa H, Yamauchi T, Kraemer WJ. Foot strike patterns of runners at the 15-km point during an elite- level half marathon. J Strength Cond Res 2007; 21: 888–93.
36. Kasmer ME, Liu XC, Roberts KG, Valadao JM. Foot-strike pattern and performance in a marathon. Int J Sports Physiol Perform 2013; 8: 286–92.
37. Hayes P, Caplan N. Foot strike patterns and ground contact times during high-calibre middle-distance races. J Sports Sci 2012; 30: 1275–83.
38. Gruber AH, Umberger BR, Braun B, Hamill J. Economy and rate of carbohydrate oxidation during running with rearfoot and forefoot strike patterns. J Appl Physiol 2013; 115: 194–201.
39. Lai A, Lichtwark GA, Schache AG, Pandy MG. Differences in in vivo muscle fascicle and tendinous tissue behavior between the ankle plantarflexors during running. Scand J Med Sci Sport 2018; 28: 1828–36.
40. Lai A, Schache AG, Lin Y-C, Pandy MG. Tendon elastic strain energy in the human ankle plantar-flexors and its role with increased running speed. J Exp Biol 2014; 217: 3159–68.
41. Deforth M, Zwicky L, Horn T, Hintermann B. The effect of foot type on the Achilles tendon moment arm and biomechanics. Foot 2019; 38: 91–4.
42. Fath F, Blazevich AJ, Waugh CM, Miller SC, Korff T. Interactive effects of joint angle, contraction state and method on estimates of Achilles tendon moment arms. J Appl Biomech 2013; 29: 241–4.
43. Fletcher JR, MacIntosh BR. Estimates of achilles tendon moment arm length at different ankle joint angles:
effect of passive moment. J Appl Biomech 2018; 34: 220–5.
44. Maganaris CN, Baltzopoulos V, Sargeant AJ. Changes in Achilles tendon moment arm from rest to maximum isometric plantarflexion: in vivo observations in man. J Physiol 1998; 510: 977–85.
45. Manal K, Cowder JD, Buchanan TS. Subject-specific measures of achilles tendon moment arm using ultra- sound and video-based motion capture. Physiol Rep 2013; 1: 1–8.
46. Obst SJ, Barber L, Miller A, Barrett RS. Reliability of achilles tendon moment arm measured in vivo using freehand three-dimensional ultrasound. J Appl Biomech 2017; 33: 300–4.
47. Alexander RM. Elastic energy stores in running vertebrates. Integr Comp Biol 1984; 24: 85–94.
48. Ishikawa M, Komi PV. Muscle fascicle and tendon behavior during human locomotion revisited. Exerc Sport Sci Rev 2008; 36: 193–9.
49. Barnes KR, Kilding AE. Running economy: measurement, norms, and determining factors. Sport Med Open 2015; 1.
Open Access. This is an open-access article distributed under the terms of the Creative Commons Attribution 4.0 International License (https://creativecommons.org/licenses/by/4.0/), which permits unrestricted use, distribution, and reproduction in any medium, provided the original author and source are credited, a link to the CC License is provided, and changes–if any–are indicated. (SID_1)