www.oikosjournal.org
OIKOS
Oikos
––––––––––––––––––––––––––––––––––––––––
© 2018 The Authors. Oikos © 2018 Nordic Society Oikos Subject Editor: Wendt Muller
Editor-in-Chief: Dries Bonte Accepted 6 July 2018
128: 1–12, 2019
doi: 10.1111/oik.05157
doi: 10.1111/oik.05157 128 1–12
Theory predicts that parents adjust the sex ratio of their brood to the sexually selected traits of their mate because the reproductive success of sons may be more dependent on inherited paternal attractiveness than that of daughters. Empirical studies vary in terms of whether they support the theory, and this variation has often been regarded as evi- dence against sex ratio adjustment or has been ascribed to methodological differences.
Applying phylogenetic meta-analyses, we aimed to find biological explanations for the variation observed in songbirds. In particular, we tested the role extra-pair paternity, because infidelity occurs in the majority of these species and may reduce the adaptive value of adjusting brood sex ratio to the phenotype of the social mate. However, we found that the variation in effect sizes was unrelated to the proportion of extra-pair paternity. Thus future studies should consider that mate quality dependent sex ratio adjustment may be driven by direct (material) rather than indirect (genetic) benefits.
We also tested if the effect sizes are influenced by whether the focal male trait is indeed under sexual selection as it is assumed by the sex allocation theory. We found that for male traits with proven role in sexual selection, effect sizes significantly differed from the null expectation of random production of sons and daughters. For male traits with only presumed sexual role in sexual selection, the deviation from the null expectation was less convincing, and the effect sizes were significantly smaller. This result indicates that studies that neglect the assumptions of the hypotheses concerned, may lead to the underestimation of the mean effect size and, eventually, false conclusions.
Keywords: extra-pair paternity, mate attractiveness, sex allocation
Introduction
Depending on the quality of the parents and the rearing environment, fitness return from male and female offspring may differ. If so, parents are expected to over-produce offspring of the sex with the higher fitness potential, and this phenomenon is gener- ally known as sex ratio adjustment. Burley (1981, 1986) applied the idea of sex ratio adjustment to the sexually selected and heritable traits of the parents, and this led to the
‘mate attractiveness hypothesis’. This hypothesis predicts a surplus of sons in broods of
What is behind the variation in mate quality dependent sex ratio adjustment? – A meta-analysis
Eszter Szász, László Zsolt Garamszegi and Balázs Rosivall
E. Szász (http://orcid.org/0000-0002-9810-2085) (iciperezvon@gmail.com) and B. Rosivall, Dept of Systematic Zoology and Ecology, Eötvös Loránd Univ., Pázmány Péter sétány 1/C, HU-1117 Budapest, Hungary. – L. Z. Garamszegi, Depto de Ecología Evolutiva, Estación Biológica de Donaña-CSIC, Sevilla, España, and: MTA-ELTE-Theoretical Biology and Evolutionary Ecology Research Group, Eötvös Loránd Univ., Budapest, Hungary.
Meta analysis
mothers with an attractive partner, and a surplus of daughters in broods of mothers with an unattractive partner. This pre- diction arises because males often have a more variable access to mating opportunities than females due to female choice and male–male competition. Therefore, sons could benefit more, in terms of reproductive success from inheriting high attractiveness. This hypothesis has become one of the most- studied within the field of sex ratio adjustment. It received particular attention in songbirds (Passeriformes), where the reproductive success of males often varies considerably more than that of females due to multiple social pair bonds (i.e.
social polygyny) and extra-pair copulations; in addition, males often possess conspicuous sexually selected traits.
Whether females adjust the sex ratio of their offspring to the phenotype of their social mate has so far been investigated in ca. 40 songbird species (Table 1, Supplementary material Appendix 1 Table A1). Results vary greatly among species in terms of whether sex ratio adjustment has been revealed and which specific paternal traits have been found to cor- relate with offspring sex ratio. For example, body size of the mate predicted brood sex ratio in the varied tit Parus varius (Yamaguchi et al. 2004), and similarly in some populations of the great tit Parus major (Kölliker et al. 1999, Oddie and Reim 2002 (year-specific)). However, this was not the case in other populations of the great tit (Lessells et al. 1996, Radford and Blakey 2000, Stauss et al. 2005) and in the coal tit Parus ater (Dietrich-Bischoff et al. 2006). Moreover, results also vary among populations of the same species and among years within the same population. The collared fly- catcher Ficedula albicollis provides an example for both. A study in a Swedish population of the species, found that the proportion of sons in the brood was positively correlated with the size of the white forehead patch of the social father (Ellegren et al. 1996). A subsequent study in the same popu- lation, did not find such a relationship (Hjernquist et al.
2009). In a Hungarian population of the species, none of the measured phenotypic traits of the male parent was related to brood sex ratio, but broods became more male-biased as the breeding season progressed (Rosivall et al. 2004). Another study in this population, found a reverse seasonal pattern, and revealed that certain phenotypic traits (territorial aggres- siveness and body size) of the male parent were also related to brood sex ratio (Szász et al. 2014). Finally, in a Czech col- lared flycatcher population, the proportion of sons in the brood was positively correlated with the investment capacity of the parents and the size of the white wing patch of the male (Bowers et al. 2013).
Quantitative reviews (i.e. meta-analyses) also yielded mixed results for sex ratio adjustment to mate phenotype. West and Sheldon (2002) tested the ‘mate attractiveness hypothesis’ on 11 selected studies that had accumulated until 2000 and had clear a priori prediction about which trait of the male parent should be related to brood sex ratio in the particular study system and in what direction. They found an overall effect size of an intermediate magnitude in support of the hypoth- esis (West and Sheldon 2002). Cassey et al. (2006) focused on 17 studies accumulated until 2003 that were not selected
on the basis of whether the study provided a priori predic- tion about the appearance and direction of the relationships between the investigated male traits and brood sex ratio. They found a weaker overall effect size, but it was still significantly larger than zero. Since these two meta-analyses, numerous additional studies have been published on the influence of male traits on brood sex ratio (Table 1, Supplementary mate- rial Appendix 1 Table A1). Booksmythe et al. (2015) have recently gathered these and conducted a meta-analysis while also controlling for the phylogenetic relationships of the spe- cies. They took into account studies independent of whether a priori predictions were formulated, and found a weak overall effect size that no longer differed statistically from zero after applying a method that is suggested to correct for publication bias. Though both Cassey et al. (2006) and Booksmythe et al.
(2015) detected a considerable heterogeneity (i.e. variation not attributable to sampling error) in the effect sizes, so far no study has investigated the potential sources of this variation.
With the present meta-analysis we aimed to fill this gap, and identify moderator variables that could explain the het- erogeneity. In particular, we investigated two important bio- logical factors that could potentially explain the relatively small overall effect size and the high unexplained heterogene- ity. First, sex ratio adjustment in relation to the social mate’s phenotype should result in a net fitness benefit that is expected to change with the prevailing ecological and social conditions varying from population to population. Infidelity occurs in the vast majority of songbirds (86%; Westneat and Stewart 2003), shows considerable variation among species and popu- lations (Griffith et al. 2002, Westneat and Stewart 2003), and is likely to influence the net benefit of sex ratio adjustment to mate phenotype. As infidelity increases, the social mate’s phenotype is no longer a reliable predictor of offspring phe- notype, and thereby offspring fitness. Accordingly, the selec- tive advantage of sex ratio adjustment in relation to the social mate’s phenotype should decrease. We therefore, investigated the proportion of extra-pair young as a potential moderator variable that may explain the detected heterogeneity in sex ratio adjustment in relation to the social mate’s phenotype.
We expected a negative correlation between the proportion of extra-pair young in the population and the magnitude of the effect of male traits on brood sex ratio. Second, results could also be influenced by whether the inclusion of the focal male traits (i.e. predictors of brood sex ratio) into the analysis is based on previous knowledge (i.e. publication(s)) about the trait’s relevance to sexual selection in the study spe- cies, or the analysis is purely explorative (Hasselquist and Kempenaers 2002, Booksmythe et al. 2015). The earlier meta-analyses either excluded (West and Sheldon 2002) or included (Cassey et al. 2006, Booksmythe et al. 2015) stud- ies that explored correlates of brood sex ratio without a priori predictions. We rather explicitly tested this factor, and used a moderator variable in our analyses that distinguished between two categories of male traits based on whether they can be considered relevant to test the ‘mate attractiveness hypothesis’
(i.e. whether they can be sexually selected) according to the existing literature on the respective species. As only sexually
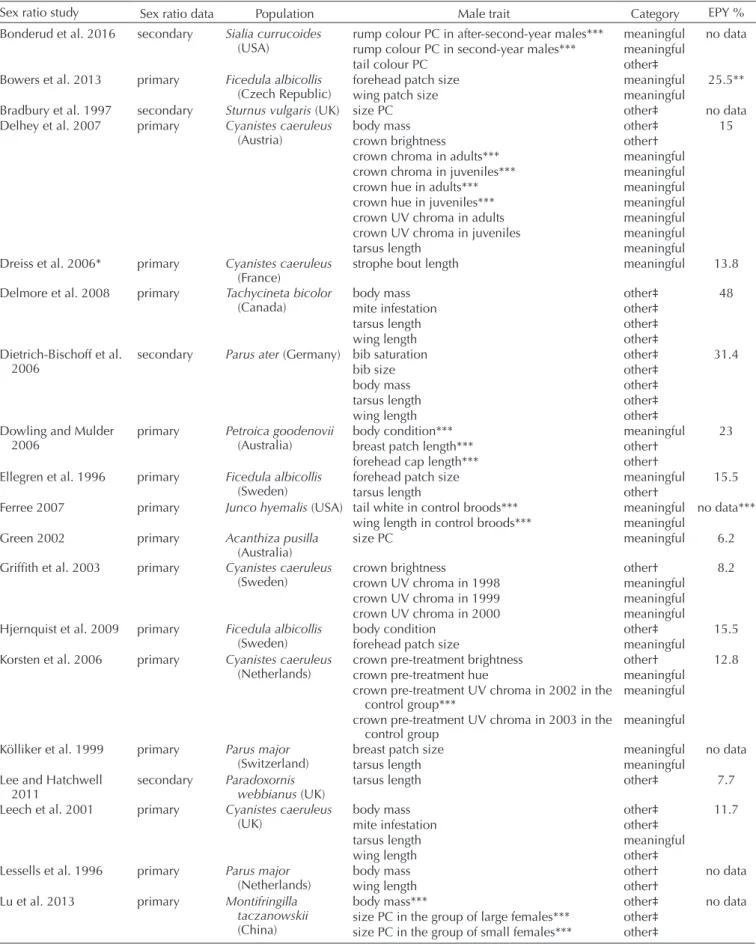
Table 1. Studies included in the meta-analyses with the proportion of extra-pair young in the given population (EPY %) and the categorisa- tion of the extracted effect sizes.
Sex ratio study Sex ratio data Population Male trait Category EPY %
Bonderud et al. 2016 secondary Sialia currucoides
(USA) rump colour PC in after-second-year males*** meaningful no data rump colour PC in second-year males*** meaningful
tail colour PC other‡
Bowers et al. 2013 primary Ficedula albicollis
(Czech Republic) forehead patch size meaningful 25.5**
wing patch size meaningful
Bradbury et al. 1997 secondary Sturnus vulgaris (UK) size PC other‡ no data
Delhey et al. 2007 primary Cyanistes caeruleus
(Austria) body mass other‡ 15
crown brightness other†
crown chroma in adults*** meaningful
crown chroma in juveniles*** meaningful
crown hue in adults*** meaningful
crown hue in juveniles*** meaningful
crown UV chroma in adults meaningful
crown UV chroma in juveniles meaningful
tarsus length meaningful
Dreiss et al. 2006* primary Cyanistes caeruleus
(France) strophe bout length meaningful 13.8
Delmore et al. 2008 primary Tachycineta bicolor
(Canada) body mass other‡ 48
mite infestation other‡
tarsus length other‡
wing length other‡
Dietrich-Bischoff et al.
2006 secondary Parus ater (Germany) bib saturation other‡ 31.4
bib size other‡
body mass other‡
tarsus length other‡
wing length other‡
Dowling and Mulder
2006 primary Petroica goodenovii
(Australia) body condition*** meaningful 23
breast patch length*** other†
forehead cap length*** other†
Ellegren et al. 1996 primary Ficedula albicollis
(Sweden) forehead patch size meaningful 15.5
tarsus length other†
Ferree 2007 primary Junco hyemalis (USA) tail white in control broods*** meaningful no data***
wing length in control broods*** meaningful Green 2002 primary Acanthiza pusilla
(Australia) size PC meaningful 6.2
Griffith et al. 2003 primary Cyanistes caeruleus
(Sweden) crown brightness other† 8.2
crown UV chroma in 1998 meaningful
crown UV chroma in 1999 meaningful
crown UV chroma in 2000 meaningful
Hjernquist et al. 2009 primary Ficedula albicollis
(Sweden) body condition other‡ 15.5
forehead patch size meaningful
Korsten et al. 2006 primary Cyanistes caeruleus
(Netherlands) crown pre-treatment brightness other† 12.8
crown pre-treatment hue meaningful
crown pre-treatment UV chroma in 2002 in the
control group*** meaningful
crown pre-treatment UV chroma in 2003 in the
control group meaningful
Kölliker et al. 1999 primary Parus major
(Switzerland) breast patch size meaningful no data
tarsus length meaningful
Lee and Hatchwell
2011 secondary Paradoxornis
webbianus (UK) tarsus length other‡ 7.7
Leech et al. 2001 primary Cyanistes caeruleus
(UK) body mass other‡ 11.7
mite infestation other‡
tarsus length meaningful
wing length other‡
Lessells et al. 1996 primary Parus major
(Netherlands) body mass other† no data
wing length other†
Lu et al. 2013 primary Montifringilla taczanowskii (China)
body mass*** other‡ no data
size PC in the group of large females*** other‡
size PC in the group of small females*** other‡
(Continued)
Sex ratio study Sex ratio data Population Male trait Category EPY % Magrath et al. 2002 primary Petrochelidon ariel
(Australia) body condition other‡ 14
tarsus length meaningful
Moreno-Rueda et al.
2014 secondary Lanius meridionalis
(Spain) body mass other‡ no data
tarsus length other‡
primary wing length other‡
Neto et al. 2011 secondary Locustella luscinoides
(Portugal) size PC meaningful 4.1
Perlut et al. 2014 primary Passerculus sandwichensis (USA)
bill length other‡ 42.9***
body mass other‡
tarsus length other‡
wing length other‡
Poláková et al. 2012* primary Carpodacus erythrinus
(Czech Republic) ornament lightness (i.e. brightness) meaningful 17.5**
Potvin and MacDougall-
Shackleton 2010 primary Melospiza melodia
(Canada) song repertoire size at early stage meaningful no data Questiau et al. 2000 secondary Luscinia svecica
(France) throat patch size other‡ 41.9
wing length other‡
Ramsay et al. 2003 primary Poecile atricapilla
(Canada) dominance rank meaningful 10.8
Romano et al. 2015 primary Hirundo rustica
(Italy) tail length meaningful 28.5
ventral colouration other‡
Rosivall et al. 2004 primary Ficedula albicollis
(Hungary) forehead patch size meaningful 20.6
tarsus length other‡
wing patch size meaningful
Stauss et al. 2005 secondary Parus major
(Germany) body condition other† no data
Cyanistes caeruleus
(Germany) body condition meaningful
Suorsa et al. 2003 primary Certhia familiaris
(Finland) tarsus length in first broods other‡ no data
Szász et al. 2014 primary Ficedula albicollis
(Hungary) attack latency meaningful 20.6
forehead patch size meaningful
tarsus length other†
wing patch size meaningful
Taff et al. 2011 secondary Geothlypis trichas
(USA) bib carotenoid chroma in experienced males*** meaningful 17 bib carotenoid chroma in inexperienced males*** meaningful bib size in experienced males*** meaningful bib size in inexperienced males*** meaningful bib UV brightness in experienced males*** meaningful bib UV brightness in inexperienced males*** meaningful bib yellow brightness in experienced males*** other†
bib yellow brightness in inexperienced males*** other†
body mass in experienced males*** other‡
body mass in inexperienced males*** other‡
mask size in experienced males*** other†
mask size in inexperienced males*** other†
tarsus length in experienced males*** other‡
tarsus length in inexperienced males*** other‡
Yamaguchi et al. 2004 primary Parus varius (Japan) breast patch size other† 0
forehead area size other†
tarsus length meaningful
Zielinska et al. 2010 primary Delichon urbicum
(Poland) body condition other‡ no data
rump patch length other‡
rump patch colouration other‡
wing length other‡
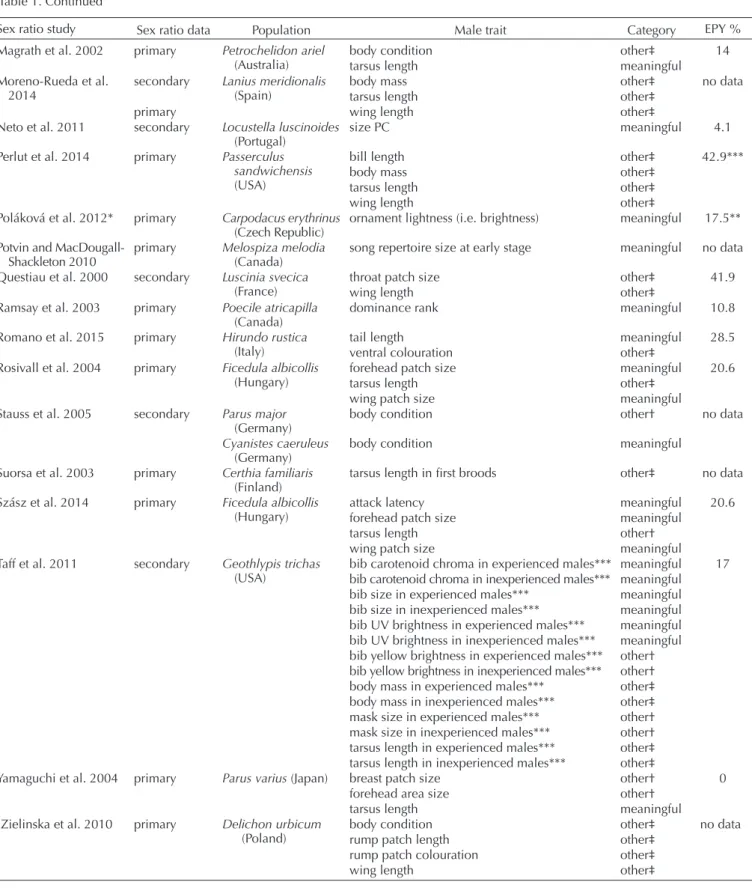
Sex ratio data = ‘primary’ refers to actually or practically complete brood sex ratio, while ‘secondary’ refers to incomplete brood sex ratio.
Category = ‘meaningful’ refers to traits with intra- or intersexual role, while ‘other’ refers to traits for which such role has not been confirmed.
EPY % = Proportion of extra-pair young among all young in the given population.
*Test statistics were only reported for a single significant term. Exclusion of the study did not change the results.
**Averaged value from two published data.
***Additional data or information from the authors of the sex ratio adjustment paper was used.
†Intra- or intersexual role of the respective trait has been examined, but has not been confirmed.
‡Study about the intra- or intersexual role of the respective trait has not been found.
Table 1. Continued
selected traits are relevant in the context of the ‘mate attrac- tiveness hypothesis’, we expected larger effect sizes among male traits that have been shown to be sexually selected than among those traits whose role was unknown. We also pre- dicted that the proportion of extra-pair young would only be related to the effect sizes among the sexually selected traits and not among traits with unknown roles. Accordingly, we also tested the interactive effect of the proportion of extra- pair young and male trait category on the effect sizes.
Methods
Literature search
We searched for publications using the ISI Web of Knowledge search engine using ‘sex ratio’ and one of the following terms:
offspring, nestling, chick, clutch or brood. We searched in
‘Topic’ as it simultaneously screens the title, the abstract and the key words. We searched for publications until the end of 2016. The literature search yielded ca 3700 records. After nar- rowing the list of journal titles to relevant ones, we obtained ca 1300 records. We then conducted a hierarchical evaluation procedure by first screening the titles, then the abstracts, and then the full texts. We selected studies that were conducted on wild songbird populations and analysed brood sex ratio determined by molecular methods. We then also performed backward and forward literature search by screening the ref- erences and the citations of the selected studies.
We found 63 studies on passerines that investigated brood sex ratio in relation to one or more traits of the male parent.
From these, we excluded 20 studies for one or more of the following reasons (see Supplementary material Appendix 1 Table A1 for details): morphological or behavioural phe- notypic traits of the male parent were not examined, male quality was estimated only indirectly e.g. by territory qual- ity or the number of social mates (n = 12 cases); the study was manipulative, and correlative data were not available (n = 6 cases); data of the given study were completely or partly included in another study with a larger dataset (n = 2 cases); the unit of the analysis was seasonal rather than brood (i.e. family) offspring sex ratio (n = 1 case); the study spe- cies was a cooperative breeder (n = 2 cases); only traits of the genetic father were examined (n = 2 cases). Cooperative breeders were excluded because predictions about sex ratio adjustment are far more complicated in those species and incomparable with the other species that we analysed. In cooperative breeders, individuals may aim to increase their inclusive fitness by balancing their investment between the helping/philopatric and the non-helping/dispersing sex (Komdeur et al. 1997) and extra-pair paternity may be distributed among within-group (often relative) and extra- group extra-pair males (Rubenstein 2007). Studies that pro- vided data only on the traits of the genetic father, but no data on the social father of the offspring were excluded because we aimed to test whether sex ratio was adjusted to the traits of the social father. Authors of the remaining studies were
contacted when the published details of the statistical analy- ses were insufficient to calculate effect sizes, and/or when we failed to find information on the proportion of extra- pair young in the population. Despite this effort, we had to exclude further eight studies because adequate statistics were not available or not provided upon request (Supplementary material Appendix 1 Table A1), and 11 studies because data on the proportion of extra-pair young were still missing (Table 1).
The overlap between our database and that of two earlier meta-analyses (West and Sheldon 2002, Cassey et al. 2006) was negligible (one (Ellegren et al. 1996) and three stud- ies (Questiau et al. 2000, Leech et al. 2001, Green 2002), respectively) because we used different inclusion criteria (i.e.
correlative studies on wild songbird populations). The data- base of the most recent meta-analysis (Booksmythe et al.
2015) included all but four studies from our database (Poláková et al. 2012, Szász et al. 2014, Romano et al. 2015, Bonderud et al. 2016).
Calculation of effect sizes
Our final dataset with data on the proportion of extra- pair young (hereafter, ‘EPY data’) comprised 79 effect sizes from 24 studies conducted on 22 populations of 16 species (Table 1). Our dataset that also included those 11 studies that we excluded because of the lack of data on the propor- tion of extra-pair young (hereafter, ‘all data’) comprised 103 effect sizes from 35 studies conducted on 34 populations of 25 species (Table 1).
We extracted statistical results for the relationship between brood sex ratio and phenotypic male traits as follows: We used test statistics from full models including control vari- ables in case of non-significant terms and final models in case of significant terms. If only univariate analyses were available, we used those. If a single study tested the effect of multiple male traits on brood sex ratio, we calculated an effect size for each of the investigated male traits (Table 1). Where lin- ear and quadratic effects of the same male trait were tested (Romano et al. 2015), we considered the linear term only for the sake of comparability among studies. Where the effect of the same male trait was tested on brood sex ratio at two nestling stages (Potvin and MacDougall-Shackleton 2010), we considered the earlier stage only. Where a male trait was involved in a significant interaction, we calculated effect sizes for the independent groups separately: i.e. years (Griffith et al.
2003, Korsten et al. 2006), age categories (Delhey et al.
2007, Taff et al. 2011, Bonderud et al. 2016), or female size categories (Lu et al. 2013). Effect sizes (i.e. correlation coef- ficient Pearson’s r) were calculated from Chi2, ∆D, F and t values (Rosenthal 1994), and then transformed to Fisher’s Z (Nakagawa and Cuthill 2007). For most of the effects, the authors did not provide a priori expectation about the direction of the effect (i.e. whether the character value of the male trait should be negatively or positively correlated with offspring sex ratio), or even if they did, the expectation was not backed up with references. Therefore, we focused on the
magnitudes irrespective to their direction, and used unsigned effect sizes in our meta-analyses.
Moderator variables
We collected data on the proportion of extra-pair young in the given population from published literature or from the authors of the case studies (Table 1, Supplementary material Appendix 2).
We grouped the male traits based on trait relevance to the
‘mate attractiveness hypothesis’, and defined ‘meaningful’ and
‘other’ categories. The ‘meaningful’ category included traits that had been previously shown to play a role in mate choice or male–male competition, or to be associated with within- or extra-pair reproductive success in the respective species or, where applicable, subspecies (Table 1, Supplementary material Appendix 2). The ‘other’ category included traits that were found to be unrelated to competitive, pairing and breeding performance, and traits for that we failed to find published data on intra- and intersexual function (Table 1).
Meta-analyses
We ran Bayesian Markov chain Monte Carlo (MCMC) mul- tilevel meta-analyses with phylogenetic and random effects in R using package ‘MCMCglmm’ (Hadfield 2010).
Phylogeny of the species was obtained from < http://
birdtree.org/ > (Jetz et al. 2012; Source of trees: Ericson All Species, Number of trees created: 100). Consensus tree was produced in R using packages ‘ape’ (Paradis et al. 2004) and ‘phytools’ (Revell 2012). Three species, the blue tit, the collared flycatcher and the great tit, were represented with multiple populations (Table 1). Unfortunately, we failed to find published data on the genetic relatedness of these populations, therefore, we used the pair-wise geographic dis- tances of the populations to approximate their phylogenetic relatedness (in R using packages ‘fields’ (Douglas et al. 2015) (to generate the distance matrices) and ‘phangorn’ (Schliep 2011) (to generate the trees)). Then, we incorporated the three population trees into the species tree (Supplementary material Appendix 1 Fig. A1). In the ultimate tree, we did not use branch length because it lost its meaning due to the combination of species-level genetic and population-level geographic information.
First, we ran models that consisted of the intercept only and the random factors: namely, phylogeny, species ID and study ID. From these models, we obtained mean effect size with 95% credible interval (CrI). As a measure of heterogene- ity, we calculated total variance, and also partitioned it accord- ing to the random effect structure (following scripts provided by Lim et al. 2014). Then, we used meta-regressions to inves- tigate the effects of our moderator variables: the proportion of extra-pair young and male trait category (used as fixed fac- tors) and their additive and interactive effects. In case of all models, we ran three MCMC chains with the same param- eter settings: number of iterations per chains = 1 100 000, thinning interval = 1000, number of burn-ins = 100 000.
Model convergence and sampling independency were always
fulfilled (all PSR factors < 1.050, all autocorrelations
< 0.100). Models were compared based on deviance infor- mation criterion (DIC) values (Spiegelhalter et al. 2002).
Explanatory power of the moderator variables was evaluated based on the change in DIC value between models lacking or containing the respective moderator and their posterior significance.
As we used unsigned effect sizes, it is not informative to evaluate the credible interval of the mean effect sizes against zero. Therefore, to test whether the observed mean effect sizes significantly deviate from what is expected under the null hypothesis of no relationship between male traits and brood sex ratio, we generated a null expectation based on simulations. Accordingly, for each source study, we generated random numbers with the original sample size for both vari- ables of interest (i.e. male trait (normally distributed variable) and brood sex ratio (binomially distributed variable)), from which we calculated effect sizes. Then, we implemented the meta-analyses on the simulated effect sizes (all unsigned) to calculate mean effect sizes for the null hypothesis by relying on the same model design as for the real data. The procedure was repeated 1000 times to get a null distribution, against which the significance of the mean effect sizes of the real data- sets was assessed.
Given the unsigned effect sizes, funnel plot and trim-and- fill test of publication bias could not be applied. As a sur- rogate, we introduced the year of publication as a moderator variable to inspect whether effect sizes tend to get smaller over time, which could be the case if non-significant results are more difficult to publish (Jennions and Møller 2002).
Additionally, we generated and inspected p-curves to rule out p-hacking (< http://p-curve.com/ >). p-curve is the dis- tribution of statistically significant p-values (p < 0.05). If there is no effect, the p-curve’s shape is uniform, whereas a right-skewed p-curve indicates true effects and a left-skewed p-curve or a peak of p-values just below the significance threshold indicates publication bias towards statistically sig- nificant results (Simonsohn et al. 2014).
To assure that our results are not confounded by non- random offspring mortality, each analysis was re-run on pri- mary offspring sex ratios. The restricted datasets relying on primary brood sex ratios comprised 56 effect sizes from 19 studies conducted on 11 species (‘EPY data’) and 72 effect sizes from 28 studies conducted on 18 species (‘all data’;
Table 1). We considered the sex ratio data as primary if one of the following criteria was fulfilled: the analyses were run on entirely sexed broods; results on entirely and partially sexed broods were qualitatively the same; results did not change qualitatively when all unsexed progenies were introduced as males or females into the analyses; proportion of sexed progenies within the brood was unrelated to brood sex ratio.
Otherwise, and if it was not specified by the authors, the sex ratio data was considered as secondary.
Data deposition
Data available from the Dryad Digital Repository: < http://
dx.doi.org/10.5061/dryad.5dh2q2b > (Szász et al. 2018).
Results
The mean unsigned effect size for the relationship between mate phenotype and brood sex ratio was small: mean Zr = 0.119, 95% CrI = 0.054–0.196. However, this overall mean effect size significantly differed from the mean effect size that was calculated under the null expectation (mean effect size for null expectation = 0.091, p = 0.010, Fig. 1).
We detected a considerable heterogeneity in the data: total
variance = 46.9%, variance accounted by phylogeny = 10.3%, variance accounted by species ID = 9.8%, variance accounted by study ID = 19.4%, residual variance = 7.5%. According to the DIC values, the most appropriate fixed-effect model was the one that included the main effect of male trait category alone (Table 2, ‘EPY data’). Based on posterior sig- nificances, the main effect of male trait category was signifi- cant (Table 2, ‘EPY data’). In particular, the mean effect size in the ‘meaningful’ category was significantly larger (mean
Figure 1. Mean effect sizes for the relationship between mate phenotype and brood sex ratio. Observed mean effect sizes (broken lines) as compared to the simulated mean effect sizes under null expectation (histograms; see the Methods for the details). NS = p > 0.05,
** = p ≤ 0.01, *** = p ≤ 0.001.
Zr = 0.162, 95% CrI = 0.067–0.244, n = 38 effect sizes) than the mean effect size in the ‘other’ category (mean Zr = 0.079, 95% CrI = 0.008–0.162, n = 41 effect sizes). Moreover, comparing the mean effect sizes of the two categories one by one to the null expectation revealed that the mean effect size can be discriminated from the null expectation only in the ‘meaningful’ category (mean effect size for null expec- tation = 0.091, p < 0.001, Fig. 1), while not in the ‘other’
category (mean effect size for null expectation = 0.092, p = 0.843, Fig. 1). Neither the main effect of the propor- tion of extra-pair young, nor its interaction with male trait category was significant (Table 2, ‘EPY data’).
Because the proportion of extra-pair young did not explain the magnitude of the effect sizes, we went back to the stud- ies that we excluded because of the lack of data on extra-pair paternity. In the larger dataset, the mean effect size yielded was larger: Zr = 0.163, 95% CrI = 0.063–0.251. This mean effect size significantly differed from the mean effect size that was calculated under the null expectation (mean effect size for null expectation = 0.092, p < 0.001, Fig. 1). The hetero- geneity was also higher when the larger dataset was used: total variance = 74.6%, variance accounted by phylogeny = 16.2%, variance accounted by species ID = 6.0%, variance accounted by study ID = 23.2%, residual variance = 29.2%. The signifi- cant effect of male trait category was confirmed using the larger dataset (Table 2, ‘all data’). The mean effect size in the
‘meaningful’ category was significantly larger (Zr = 0.216, 95% CrI = 0.094–0.342, n = 46 effect sizes) than in the
‘other’ category (Zr = 0.129, 95% CrI = 0.053–0.213, n = 57 effect sizes). Considering ‘all data’, the mean effect size of both male trait categories differed significantly from the null expectation (‘meaningful’ category: mean effect size for null expectation = 0.092, p < 0.001; ‘other’ category: mean effect size for null expectation = 0.092, p < 0.001), but the observed mean effect size of the ‘meaningful’ category fell far more outside the frequency distribution of the generated effect sizes than that of the ‘other’ category (Fig. 1).
When the analyses were restricted to primary brood sex ratios, the results were qualitatively the same (Supplementary material Appendix 1 Table A2). Our results are unlikely to be
influenced by publication bias. The models containing publi- cation year as moderator variable had the highest DIC values both in the case of ‘EPY data’ and ‘all data’ (DIC = –241.485 and –86.673, respectively), and the moderator was non- significant (pMCMC = 0.302 and 0.243, respectively). The p-curve was significantly right-skewed indicating that our database comprised true findings and did not suffer from publication bias due to p-hacking (‘EPY data’: Z = –2.26, p = 0.012; ‘all data’: Z = –3.61, p = 0.002).
Discussion
The evolution of sex ratios has excited evolutionary ecolo- gists since the foundation of the field. The potential ability of parents to facultatively produce sons and daughters is an interesting and subtle way to increase fitness. In addition, sex ratio adjustment has an importance to species conserva- tion, and may have economic relevance (Clout et al. 2002, Robertson et al. 2006, Linklater et al. 2017). Consequently, sex ratio adjustment has become a popular research topic, and the number of publications increased rapidly. However, instead of leading to a clear conclusion, this led to a debate concerning the existence of the phenomenon because con- tradictory results have appeared in the literature (Krackow 1999, Szász et al. 2012). Recent meta-analyses yielded small overall statistical support for the phenomenon, and found a considerable and unexplained heterogeneity in the results (Cassey et al. 2006, Booksmythe et al. 2015). The uncertainty of the mechanism (Pike and Petrie 2003, Rutkowska and Badyaev 2008), by which the adjustment may be achieved, has also strengthened the scepticism. As a consequence, in the recent years, there has not been much advance in the field. We believe that our study investigating some potential biological reasons for the heterogeneity in the results provides evidence for the phenomenon and a solid basis for further studies.
Similarly to earlier findings (Cassey et al. 2006, Booksmythe et al. 2015), we found a small overall effect size of mate phenotype on offspring sex ratio and a consid- erable heterogeneity in the effect sizes. To step forward, we
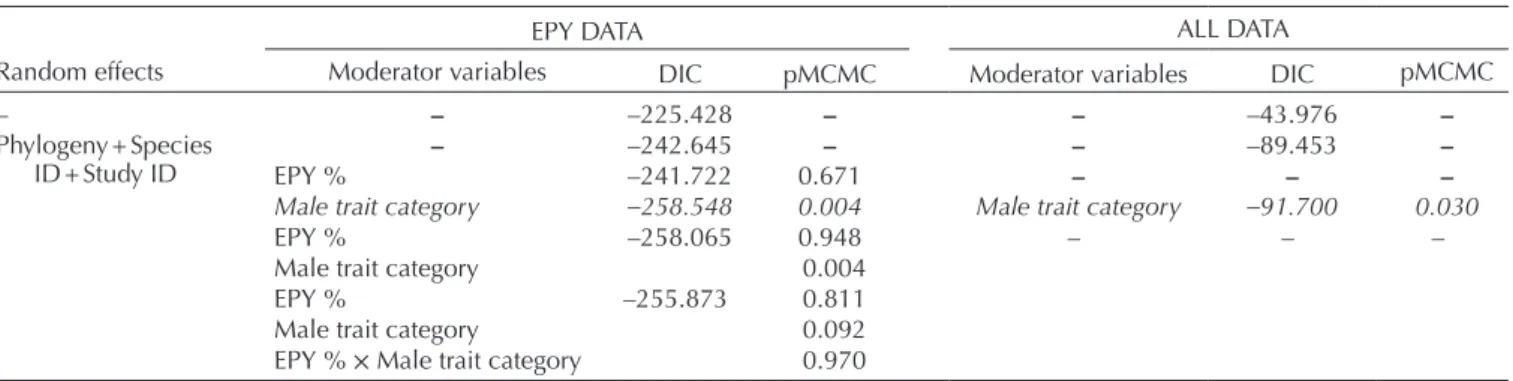
Table 2. The effect of moderator variables on the relationship between male traits and brood sex ratio. Bayesian meta-analytical models with the corresponding deviance information criterion values and the significance of the moderators are shown.
Random effects
EPY DATA ALL DATA
Moderator variables DIC pMCMC Moderator variables DIC pMCMC
– – –225.428 – – –43.976 –
Phylogeny + Species
ID + Study ID – –242.645 – – –89.453 –
EPY % –241.722 0.671 – – –
Male trait category –258.548 0.004 Male trait category –91.700 0.030
EPY % –258.065 0.948 – – –
Male trait category 0.004
EPY % –255.873 0.811
Male trait category 0.092
EPY % × Male trait category 0.970
EPY % = Proportion of extra-pair young among all young in the given population. Male trait category = ‘meaningful’/’other’ (role in sexual selection demonstrated or not). DIC and pMCMC values are means from three MCMC chains.
introduced moderator variables that could potentially explain the heterogeneity. We found that the proportion of extra- pair young, which may limit the predictability of offspring phenotype, and thereby offspring fitness, did not explain the strength of the relationship between social mate phenotype and brood sex ratio. However, male trait category (discrimi- nating between traits with proven role in sexual selection and traits with only presumed sexual role) partly explained the detected heterogeneity. These results were qualitatively simi- lar when the datasets were narrowed to primary brood sex ratios suggesting that our findings were not confounded by offspring mortality.
We did not find statistical support for our idea that unpre- dictability in the inheritance of the social father’s phenotype decreases the selection for sex ratio adjustment to mate phe- notype. Namely, we could not show a negative relationship between the proportion of extra-pair young and the magni- tude of the effect of mate phenotype on offspring sex ratio.
There are several possible explanations for the lack of this pre- dicted relationship. First, we might be unable to detect the expected relationship if variation in extra-pair paternity is low in our database. However, the proportion of extra-pair young ranged from zero to almost 50% with a mean ± SD = 18.914
± 12.869%, which makes this explanation unlikely, as these values are representative of songbirds (Griffith et al. 2002).
Second, it is possible that the relationship between the pro- portion of extra-pair young and sex ratio adjustment is not linear, because selection for sex ratio adjustment to mate phe- notype could be weak not only when the proportion of extra- pair young is high, but also when it is low. This is because smaller variance in male reproductive success could diminish the selective advantage of sex ratio adjustment to mate phe- notype. However, when we tested the main and interactive effect of the quadratic proportion of extra-pair young on the correlation coefficients between male phenotype and brood sex ratio, they were statistically negligible (main effect: mean DIC value = –241.659, mean pMCMC = 0.723; interactive effect with male trait category: mean DIC value = –256.579, mean pMCMC = 0.899). Third, sex ratio adjustment to mate phenotype may be independent from the proportion of extra- pair young if sex ratio adjustment is driven not by indirect (i.e. genetic), but direct (i.e. material) benefits that are related to the phenotype of the social father, even if infidelity occurs.
In respect of sex ratio adjustment to mate phenotype, direct benefits have been entirely neglected. However, in the context of mate choice, it has been shown that preferred male traits could equally indicate genetic and material benefits (Møller and Jennions 2001). It would be very important in the future to consider the possibility that females adjust the sex ratio of their offspring in relation to the phenotype of their social mate because of resource availability and not the heritabil- ity of male characteristics. It is particularly important in the case of male traits that could be associated with resource holding potential such as body size, territorial aggressive- ness and dominance. Interestingly, in the meta-analysis of Booksmythe et al. (2015), measures of body size proved to
be stronger predictors of offspring sex ratio than measures of ornamentation.
Our most important result was that the mean effect size was considerably larger for variables that were shown to be related to within- or extra-pair reproductive success or com- petitive ability in males (‘meaningful’ traits) than for variables about which we could not find published data confirming their role in sexual selection (‘other’ traits). The mean effect size for ‘meaningful’ traits was ca two-times larger than the mean effect size for ‘other traits’, and was similar to the mean effect size of the first meta-analysis on the subject (West and Sheldon 2002). As we showed, such a mean effect size is unlikely to be obtained by chance. This suggests that the mean effect size of the ‘meaningful’ category captures a real biological effect. This was true for both of our datasets, i.e.
the one that included only those study populations where information on the proportion of extra-pair young was avail- able (‘EPY data’) and the one that included all study popula- tions (‘all data’). In contrast, the mean effect size for ‘other’
traits could be statistically discriminated from the simulated effect sizes only in the case of our larger dataset (‘all data’), and even then, it fell rather close to the frequency distribu- tion of the simulated effect sizes. Study populations with data on the proportion of extra-pair young have presumably been studied more intensively. Therefore, in these populations, it is less likely that a sexually selected male trait fell acciden- tally in the ‘other’ category. This might be responsible for the outcome that the statistical difference between the mean effect sizes of the two male trait categories was more pro- nounced in our initial (‘EPY data’) than in our larger data- set (‘all data’). Our results demonstrate that the noise caused by non-specific explanatory variables (more than the half of the investigated male traits) can indeed be misleading in the sense than it can push the estimate of the overall mean effect size towards the smaller end of the range. With this finding our study may resolve the apparent discrepancy between the conclusions of the first (West and Sheldon 2002) and the later meta-analyses (Cassey et al. 2006, Booksmythe et al.
2015) conducted on the subject. In conclusion, it could be inferred that we did find a general support for the relation- ship between mate attractiveness and brood sex ratio when considering those traits of the male that were relevant to the sex allocation theory.
Whether or not male attractiveness dependent sex alloca- tion may endure in the long run was debated. A simulation study by Fawcett et al. (2011) suggested that the ability of sex ratio adjustment erodes sexual selection, and thereby eventu- ally its own operation. Later, Booksmythe et al. (2013) modi- fied the model so that sex ratio response to male attractiveness followed a more realistic function, and some cost of sex ratio adjustment was also introduced to the model. They agreed that sex allocation may limit the exaggeration of male traits, however, their results suggested that sex allocation rather stabilises than erodes sexual selection. They also found that the degree of sex ratio adjustment was the strongest when the expression of male traits was intermediate, however, on
average, the degree of sex ratio adjustment was rather low (i.e. in more than 80% of the simulations, females could adjust their offspring sex ratio less than ± 0.1 around 0.5).
In light of these results, the relatively low effect sizes observed in empirical studies are not surprising. Future studies should address the question whether this small degree of sex alloca- tion can indeed stabilise sexual selection. Nonetheless, this will not be easy to test, because measuring the degree of sex ratio response to mate attractiveness is inherently difficult even under laboratory conditions.
In addition to its importance to sex allocation theory, our results have a more general message concerning hypothesis testing. When conducting meta-analyses, it is a general prob- lem that the quality of the individual studies may itself intro- duce heterogeneity into the results, and thereby prevent us from drawing a reliable overall conclusion (Gurevitch et al.
2001). This issue is extremely important in an era, when studies are published in so large amount that it is very hard to review them, thus people more and more rely on meta- analyses. In the case of the ‘mate attractiveness hypothesis’
(Burley 1981, 1986), studies that examined the relationship between brood sex ratio and proven sexually selected traits can be regarded as more appropriate tests of the hypothesis (which was developed for sexually selected traits) than those studies that had no previous knowledge about the role of the examined male traits. Here, we show that about the sexu- ally selected male traits it is safe to say that those drive sex ratio adjustment (even if not necessarily because of genetic benefits as suggested by the ‘mate attractiveness hypothesis’), while it is not the case concerning the male traits with no information about their role in sexual selection. Similarly to our study, meta-analyses on mammalian offspring sex ratios (Sheldon and West 2004, Cameron 2004) also bring the attention to the quality of the data used for hypothesis testing. In mammals, the most-tested hypothesis of sex ratio adjustment is the ‘Trivers–Willard hypothesis’ (Trivers and Willard 1973) that predicts male-bias in litters of mothers in good body condition and female-bias in litters of moth- ers in poor body condition. The hypothesis was supported when appropriate measures of female body condition were used (i.e. condition was measured directly and around con- ception), while less or not supported when the measure was indirect or was taken after conception (Sheldon and West 2004, Cameron 2004).
To conclude, recent meta-analyses of mate attractiveness dependent sex ratio adjustment have not controlled for data quality, and therefore underestimated the true effect size. This may have contributed to the recent decrease in research effort in the field. Our study found convincing evidence for mate attractiveness dependent sex ratio adjustment in songbirds.
We hope that this will facilitate further research, because knowledge on the interplay of sex allocation and sexual selection would be important. The fact that the relationship between mate attractiveness and brood sex ratio was inde- pendent of the proportion of extra-pair paternity suggests that mate attractiveness dependent sex ratio adjustment may have evolved because of direct benefits. Thus the relationship
between male parental effort and brood sex ratios deserve more attention in the future.
Acknowledgements – We thank the authors of the sex ratio adjustment papers who readily responded to our additional data requests. We thank Wendt Müller for their constructive comments on our manuscript. We are grateful to Gergely Hegyi and Thomas Kaali for improving the English of the paper.
Funding – Our work was supported by a PhD scholarship to ES from the Doctoral School of Biology, Eötvös Loránd University, Hungary, a János Bolyai research scholarship to BR from the Hungarian Academy of Sciences, a research grant from the National Research, Development and Innovation Office of Hungary to BR (grant no. K-120249) and a research grant from the Ministry of Economy and Competitiveness of Spain to LZG (grant no.
CGL2015-70639-P).
Competing interests – We have no competing interests.
Author contributions – BR and ES conceived the idea, ES built the database and performed the analyses, GLZ contributed substantially to statistics, all authors contributed to the preparation of the manuscript and gave approval for publication.
References
Bonderud, E. S. et al. 2016. Female mountain bluebirds (Sialia currucoides) paired to more colourful males produce male- biased broods. – Behaviour 153: 367–386.
Booksmythe, I. et al. 2013. The complex interplay of sex allocation and sexual selection. – Evolution 67: 673– 678.
Booksmythe, I. et al. 2015. Facultative adjustment of the offspring sex ratio and male attractiveness: a systematic review and meta- analysis. – Biol. Rev. 92: 108–314.
Bowers, E. K. et al. 2013. Cross-fostering eggs reveals that female collared flycatchers adjust clutch sex ratios according to parental ability to invest in offspring. – Mol. Ecol. 22:
215–228.
Bradbury, R. B. et al. 1997. Nestling sex ratio in the European starling Sturnus vulgaris. – J. Avian Biol. 28: 255–258.
Burley, N. 1981. Sex-ratio manipulation and selection for attractiveness. – Science 211: 721–722.
Burley, N. 1986. Sex-ratio manipulation in color-banded populations of zebra finches. – Evolution 40: 1191–1206.
Cameron, E. Z. 2004. Facultative adjustment of mammalian sex ratios in support of the Trivers–Willard hypothesis: evidence for a mechanism. – Proc. R. Soc. B 271: 1723–1728.
Cassey, P. et al. 2006. Facultative primary sex ratio variation: a lack of evidence in birds? – Proc. R. Soc. B 271: 1277–1282.
Clout, M. N. et al. 2002. Effects of supplementary feeding on the offspring sex ratio of kakapo: a dilemma for the conservation of a polygynous parrot. – Biol. Conserv. 107: 13–18.
Delhey, K et al. 2007. Brood sex ratio and male UV ornamentation in blue tits (Cyanistes caeruleus): correlational evidence and an experimental test. – Behav. Ecol. Sociobiol. 61: 853–862.
Delmore, K. E. et al. 2008. Sex allocation and parental quality in tree swallows. – Behav. Ecol. 19: 1243–1249.
Dietrich-Bischoff, V. et al. 2006. Extra-pair paternity, offspring mortality and offspring sex ratio in the socially monogamous coal tit (Parus ater). – Behav. Ecol. Sociobiol. 60: 563–571.
Douglas, N. et al. 2015. ‘fields: Tools for spatial data.’ – doi:
10.5065/D6W957CT
Dowling, D. K. and Mulder, R. A. 2006. Combined influence of maternal and paternal quality on sex allocation in red‐capped robins. – J. Evol. Biol. 19: 440–449.
Dreiss, A. et al. 2006. Sex ratio and male sexual characters in a population of blue tits, Parus caeruleus. – Behav. Ecol. 17:
13–19.
Ellegren, H. et al. 1996. Sex ratio adjustment in relation to paternal attractiveness in a wild bird population. – Proc. Natl Acad. Sci.
USA 93: 11723–11728.
Fawcett, T. W. et al. 2011. Sex-ratio control erodes sexual selection, revealing evolutionary feedback from adaptive plasticity. – Proc.
Natl Acad. Sci. USA 108:15925–15930.
Ferree, E. D. 2007. White tail plumage and brood sex ratio in dark-eyed juncos (Junco hyemalis thurberi). – Behav. Ecol.
Sociobiol. 62: 109–117.
Green, D. J. 2002. Pair bond duration influences paternal provi- sioning and the primary sex ratio of brown thornbill broods.
– Anim. Behav. 64: 791–800.
Griffith, S. C. et al. 2002. Extra pair paternity in birds: a review of interspecific variation and adaptive function. – Mol. Ecol. 11:
2195–2212.
Griffith, S. C. et al. 2003. Correlations between ultraviolet colora- tion, overwinter survival and offspring sex ratio in the blue tit.
– J. Evol. Biol. 16: 1045–1054.
Gurevitch, J. et al. 2001. Meta-analysis in ecology. – Adv. Ecol. Res.
32: 199–247.
Hadfield, J. D. 2010. MCMC methods for multi-response general- ized linear mixed models: the MCMCglmm R package.
– J. Stat. Soft. 33: 1–22.
Hasselquist, D. and Kempenaers, B. 2002. Parental care and adaptive brood sex ratio manipulation in birds. – Phil. Trans.
R. Soc. B 357: 363–372.
Hjernquist, M. B. et al. 2009. Sex allocation in response to local resource competition over breeding territories. – Behav. Ecol.
20: 335–339.
Jennions, M. D. and Møller, A. P. 2002. Relationships fade with time: a meta-analysis of temporal trends in publication in ecology and evolution. – Proc. R. Soc. B 269: 43–48.
Jetz, W. et al. 2012. The global diversity of birds in space and time.
– Nature 491: 444–448.
Kölliker, M. et al. 1999. Offspring sex ratio is related to male body size in the great tit (Parus major). – Behav. Ecol. 10: 68–72.
Komdeur, J. et al. 1997. Extreme adaptive modification in sex ratio of the Seychelles warbler’s eggs. – Nature 385: 522–525.
Korsten, P. et al. 2006. Primary sex ratio adjustment to experimen- tally reduced male UV attractiveness in blue tits. – Behav. Ecol.
17: 539–546.
Krackow, S. 1999. Avian sex ratio distortions: the myth of maternal control. – In: Adams, N. J. and Slotow, R. H. (eds), Proc. 22 Int. Ornithol. Congr., Durban, pp. 425–433.
Lee, J.-W. and Hatchwell, B. J. 2011. Do females adjust brood sex ratio according to males’ genetic structures in a gregarious passerine, the vinous-throated parrotbill Paradoxornis webbianus?
– J. Avian Biol. 42: 447–453.
Leech, D. I. et al. 2001. No effect of parental quality or extrapair paternity on brood sex ratio in the blue tit (Parus caeruleus).
– Behav. Ecol. 12: 674–680
Lessells, C. M. et al. 1996. Great tit hatchling sex ratios. – J. Avian Biol. 27: 135–142.
Lim, J. N. et al. 2014. Heterogeneity in individual quality and reproductive tradeoffs within species. – Evolution 68:
2306–2318.
Linklater, W. L. et al. 2017. Experimental evidence for homeostatic sex allocation after sex-biased reintroductions. – Nat. Ecol.
Evol. 1: 0088.
Lu, X. et al. 2013. Body attributes of both parents jointly affect offspring sex allocation in a socially monogamous, size-mono- morphic passerine. – Curr. Zool. 59: 271–277.
Magrath, M. J. L. et al. 2002. Sex allocation in the sexually mono- morphic fairy martin. – J. Avian Biol. 33: 260–268.
Møller, A. P. and Jennions, M. D. 2001. How important are direct fitness benefits of sexual selection? – Naturwissenschaften 88:
401–415.
Moreno-Rueda, G. et al. 2014. Costs of rearing and sex-ratio variation in southern grey shrike Lanius meridionalis broods.
– J. Avian Biol. 45: 424–430.
Nakagawa, S. and Cuthill, I. C. 2007. Effect size, confidence inter- val and statistical significance: a practical guide for biologists.
– Biol. Rev. 82: 591–605.
Neto, J. M. et al. 2011. Sex allocation in Savi’s warblers Locustella luscinioides: multiple factors affect seasonal trends in brood sex ratios. – Behav. Ecol. Sociobiol. 65: 297–304.
Oddie, K. R. and Reim, C. 2002. Egg sex ratio and paternal traits:
using within-individual comparisons. – Behav. Ecol. 13:
503–510.
Paradis, E. et al. 2004. APE: analyses of phylogenetics and evolution in R language. – Bioinformatics 20: 289–290.
Perlut, N. G. et al. 2014. Nestling sex ratios do not support long-term parity in two species with different life-history strategies. – Auk 131: 224–234.
Pike, T. W. and Petrie, M. 2003. Potential mechanisms of avian sex manipulation. – Biol. Rev. 78: 553–574.
Poláková, R. et al. 2012. Effect of extra-pair paternity and parental quality on brood sex ratio in the scarlet rosefinch Carpodacus erythrinus. – Folia Zool. 61: 225–232.
Potvin, D. A. and MacDougall-Shackleton, E. A. 2010. Paternal song complexity predicts offspring sex ratios close to fledging, but not hatching, in song sparrows. – Wilson J. Ornithol. 122:
146–152.
Questiau, S. et al. 2000. Nestling sex ratios in a population of bluethroats Luscinia svecica inferred from AFLP (TM) analysis.
– J. Avian Biol. 31: 8–14.
Radford, A. N. and Blakey, J. K. 2000. Is variation in brood sex ratios adaptive in the great tit (Parus major)? – Behav. Ecol. 11:
294–298
Ramsay, S. M. et al. 2003. Sex allocation in black-capped chickadees Poecile atricapilla. – J. Avian Biol. 34: 134–139.
Revell, L. J. 2012. Phytools: an R package for phylogenetic comparative biology (and other things). – Methods Ecol. Evol.
3: 217–223.
Robertson, B. C. et al. 2006. Sex allocation theory aids species conservation. – Biol. Lett. 2: 229–231.
Romano, A. et al. 2015. Sex allocation according to multiple sexually dimorphic traits of both parents in the barn swallow (Hirundo rustica). – Evol. Biol. 28: 1234–1247.
Rosenthal, R. 1994. Parametric measures of effect size. – In: Cooper, H. et al. (eds), The handbook of research synthesis. Russell Sage Foundation, NY, pp. 231–244.
Rosivall, B. et al. 2004. Brood sex ratio adjustment in collared flycatchers (Ficedula albicollis): results differ between popula- tions. – Behav. Ecol. Sociobiol. 56: 346–351.
Rubenstein, D. R. 2007. Female extrapair mate choice in a cooperative breeder: trading sex for help and increasing offspring heterozygosity. – Proc. R. Soc. B 274: 1895–1903.
Rutkowska, J. and Badyaev A. V. 2008. Meiotic drive and sex determination: molecular and cytological mechanisms of sex ratio adjustment in birds. – Phil. Trans. R. Soc. B 363:
1675–1686.
Schliep, K. P. 2011. Phangorn: phylogenetic analysis in R.
– Bioinformatics 27: 592–593.
Sheldon, B. C. and West, S. A. 2004. Maternal dominance, maternal condition, and offspring sex ratio in ungulate mammals. – Am. Nat. 163: 40–54
Simonsohn, U. et al. 2014. P-curve: a key to the file-drawer.
– J. Exp. Psychol. Gen. 143: 534–547.
Spiegelhalter, D. J. et al. 2002. Bayesian measures of model complexity and fit. – J. R. Stat. Soc. B 64: 583–639.
Stauss, M. et al. 2005. Sex ratio of Parus major and P. caeruleus broods depends on parental condition and habitat quality.
– Oikos 109: 367–373.
Suorsa, P. et al. 2003. Forest fragmentation is associated with primary brood sex ratio in the treecreeper (Certhia familiaris).
– Proc. R. Soc. B 270: 2215–2222.
Szász, E. et al. 2012. Sex ratio adjustment in birds. – Ornis Hung.
20: 26–36.
Szász, E. et al. 2014. Aggressive behavior of the male parent predicts brood sex ratio in a songbird. – Naturwissenschaften 101: 653–660.
Szász, E. et al. 2018. Data from: What is behind the variation in mate quality dependent sex ratio adjustment? – A meta-analysis. – Dryad Digital Repository, <http://dx.doi.org/10.5061/dryad.5dh2q2b>.
Taff, C. C. et al. 2011. Relationship between brood sex ratio and male ornaments depends on male age in a warbler. – Anim.
Behav. 81: 619–625.
Trivers, R. L. and Willard, D. 1973. Natural selection of parental ability to vary the sex ratio of offspring. – Science 179: 90–92.
West, S. A. and Sheldon, B. C. 2002. Constraints in the evolution of sex ratio adjustment. – Science 295: 1685–1688.
Westneat, D. F. and Stewart, I. R. K. 2003. Extra-pair paternity in birds: causes, correlates and conflict. – Annu. Rev. Ecol. Evol.
Syst. 34: 365–396.
Yamaguchi, N. et al. 2004. Facultative sex ratio adjustment in response to male tarsus length in the varied tit Parus varius.
– Ibis 146: 108–113.
Zielinska, M. et al. 2010. Offspring sex ratio skew in the sexually monomorphic house martin Delichon urbicum. – J. Avian Biol.
41: 591–596.
Supplementary material (available online as Appendix oik- 05157 at < www.oikosjournal.org/appendix/oik-05157 >).
Appendix 1.