https://doi.org/10.1007/s11244-018-0936-z ORIGINAL PAPER
Hydrogen evolution in the photocatalytic reaction between methane and water in the presence of CO
2on titanate and titania supported Rh and Au catalysts
Balázs László1 · Kornélia Baán1 · Albert Oszkó1 · András Erdőhelyi1 · János Kiss3 · Zoltán Kónya2,3
Published online: 13 April 2018
© Springer Science+Business Media, LLC, part of Springer Nature 2018
Abstract
The photocatalytic transformation of methane-water mixture over Rh and Au catalysts supported on protonated (H-form) titanate nanotube (TNT) was investigated. The role of the catalyst structure was analyzed using titania reference support.
Furthermore the effect of carbon-dioxide addition was also investigated. The catalysts were characterized by high resolution transmission electron microscopy and X-ray photoelectron spectroscopy (XPS). Photocatalytic tests were performed with a mercury-arc UV source illuminating a continuous flow quartz reactor which was attached to a mass spectrometer. The surface of the catalysts was analyzed by diffuse reflectance infrared spectroscopy during the photoreactions. The changes of the catalysts due to photocatalytic usage were investigated by XPS and temperature programmed reduction methods as well. Most of the methane was generally transformed to hydrogen and ethane, and a small amount of methanol was also formed. The carbon dioxide addition enhanced the rate of the photocatalytic transformation of methane on Rh/TNT with increasing the lifetime of the electron–hole pairs. Bigger gold particles with mainly plasmonic character were more active in the reactions due to the photo induced activation of the adsorbed water. Surface carbon deposits were identified on the catalysts after the photoreactions. More oxidized carbon formed on the Au-containing catalysts than on the ones with Rh.
Graphical Abstract
Keywords Heterogeneous photocatalysis · Titanate nanotube · Gold nanoparticle · Molecular-like cluster · Surface plasmon resonance
1 Introduction
It is envisaged that in the near future a hydrogen economy will be developed, in which H2 as the principal energy carrier may replace fossil fuels [1, 2]. The methods for
* János Kiss
jkiss@chem.u-szeged.hu
* Zoltán Kónya
konya@chem.u-szeged.hu
Extended author information available on the last page of the article
the effective production, transport and storage of hydrogen are topics of investigation all over the world. As a first approximation water could be the number one candidate as a source for hydrogen production. The pioneering work of Fujishima and Honda in 1972 accelerated the research in the field of water splitting [3]. They achieved UV light induced water splitting using a TiO2 photoanode and a Pt counter electrode immersed in an electrolyte solution.
Since that time the photocatalysis with TiO2 has attracted significant attention because of its promising application in solar energy conversion [4–8]. The photocatalytic water splitting is a promising option to generate hydrogen if the usage of carbon containing materials needs to be avoided.
This method had been widely investigated over the past decades, but, unfortunately, the stability or activity of all the semiconductor photocatalysts reported to date for direct water splitting is too low to justify industry uptake [9, 10]. Therefore the current hydrogen production method is focused on the steam reforming of methane combined with water–gas shift reaction [11, 12].
Methane and carbon-dioxide are both greenhouse gases;
their atmospheric concentrations are showing monotonic increase in the past few decades due to human activity. The increased emission rate of these gases, especially of CO2, contributes to global warming [13]. The dry reforming of CH4 with CO2 results in valuable syngas; this would solve the problem if atmospheric or byproduct CO2 could be used in the reaction [14–20]. Unfortunately, the energy demand of this process is too high to be economical, furthermore, the catalysts easily deactivate at the required temperature [21]. Photocatalysis is a promising way to break the ther- modynamic barrier of this endothermic reaction. The energy stored in the chemical bonds of the products can be a form of renewable energy if solar energy is used in the photo-exci- tation [22]. This way we can simultaneously decrease the atmospheric CO2 presence and exploit a renewable energy source.
The photocatalytic activity of titanium dioxide (TiO2) has been a major topic of research due to its advantageous properties over other semiconductors: It is relatively cheap and readily available. It is chemically and biologically sta- ble and possesses high oxidative potential. UV-irradiation generates electron–hole pairs in TiO2 like in other semi- conductors, which ends in powerful redox centers on the surface [23–29]. TiO2 and its derivatives were reported in many papers as photocatalysts in the carbon-dioxide reduc- tion [26–30]. However, the overall photocatalytic efficiency is consistently low hence further improvements are still required. A possible way to enhance the catalytic activity of a material is to increase its specific surface area. This research line in the case of TiO2 was started in 1998: Kasuga et al. published the synthesis of a novel tubular shaped TiO2 material with high specific surface area [8, 30–33].
The strenuous development of TiO2 nanomaterials has thriven our knowledge with a new class of titania-based nanostructure, the layered titanate materials [8, 10, 32–35].
They are in the center of interest due to their extremely large ion-exchange capacity [8, 32, 34–39]. Their high surface area and cation exchange capacity ensure high metal disper- sion (e.g. Ni, Co, Ag, Cu and Au) in/on their structure hence titanate nanostructures are promising supports for catalytic applications [40]. Titanate nanotubes (TNT) have got open ends. Their typical outer diameter is 7–10 nm and their length is generally 50–170 nm. Their cross section is spiral shaped and composed of 3–7 wall layers. The mean diameter of their inner channel is around 5 nm [8, 30, 41–43]. Their H-form (H2Ti3O7·nH2O) contains physisorbed water on its surfaces, crystallographic water between their layers and –OH groups with ion exchangeable H+ ions in their structure [44]. The curved layers consequently contains large amount of defect sites, typically oxygen vacancies and Ti3+ centers, which can make them promising photocatalysts, because the defect sites can trap photoelectrons or holes extending the lifetime of the excited state [8, 45]. The defect sites on their surfaces can stabilize considerably small sized metal clus- ters, too [38, 39]. From now on we denote H2Ti3O7·nH2O nanotubes as TNT in this paper.
The photocatalytic activity of N-doped ion-exchanged and modified TNT-s in several reactions was already inves- tigated [29, 33]. Some activity in dye degradation, ethanol decomposition and CO2 reduction was observed. Li et al.
observed considerable activity in the CO2+H2O photo- reaction in liquid phase with CdS modified TNT-s where methanol was accumulated in the reactor with approx.
45 µmol h−1 g−1 rate [46]. Ethanol was used during the syn- thesis of the catalysts, still the carbon source of methanol was not verified in this report. Parayil et al. investigated the CO2+H2O photocatalytic reaction in gas phase on C and N doped sodium-TNT [47]. They detected methane as the main product with 9.75 µmol h−1 g−1 formation rate but the reaction was followed only for 1 h in a static system. Most of the works investigate the photocatalytic activity of doped and modified titanates and are restricted to common dye degradation tests which tell us insufficient information on their functionality [48–50]. In order to understand how CO2 can be photocatalytically reduced to methane, studying the mechanism of the backward reaction could be very useful, too. Very little attention was devoted in the literature to this topic up to now.
Not only semiconductors, but metals themselves can also be photo-excited. It has been shown that the photon- driven bond breaking and bond formation of the adsorbates may occur for many adsorbed molecules on metal surfaces, despite the strong quenching of electronically excited states [51–53]. In certain cases the rate of the photochemical pro- cess is commensurable with the electronic quenching on
metal surfaces. The cross section is rather low, it is in the range of 10−18–10−20 cm2. These photo-induced mechanisms are appropriately described with the model involving sub vacuum hot electrons or photoelectrons [53–55]. The photo efficiency of pure, unsupported metals is too low to justify photocatalytic applications.
The photochemical activity of semiconductors is appreci- ably enhanced by doping and metal nanoparticle depositing [24, 56]. The photocatalytic performance of a semiconduc- tor is determined greatly by the rate of recombination of photo-excited electron–hole pairs (excitons). The nature of the dopants, impurities or defects in the crystal structure can have strong positive or negative effect on the recombina- tion rates [45]. Generally, depositing noble metals onto the semiconductor surface can appreciably suppress the rate of the exciton recombination as they serve as electron sinks [57–61]. The mechanism of the electron trapping in n-type semiconductors such as TiO2 is explained by the Schottky barrier which prevents the backward movement of electrons from the metal to the semiconductor [62]. Metals with large work functions such as Pt, Pd, Rh and Au are suitable to gen- erate high energy Schottky barriers hence the electron–hole separation can be more effective [8, 24, 56]. An additional property of metal particles, the localized surface plasmonic resonance (LSPR), can play an important role in photocatal- ysis. It has been already investigated in the case of titanate or titania supported gold catalysts and it was suggested that the photo-excitation of LSPR can take part in the photochemical mechanisms [8, 33, 58, 61, 63–66].
Recently we studied the photo-induced reactions of meth- ane on sodium-free (H-form) TNT doped with Rh and Au nanoparticles [61]. The pristine TNT was photocatalytically active in the CH4–transformation reaction as well, but the addition of nanosized metal particles increased the forma- tion rates significantly. It was also shown that the adsorption characteristic of gold strongly depends on the particle sizes.
The electron transfer step can even occur on the surface of the gold particles due to the excitation of the local surface plasmon resonance or electron transitions in the molecular- like metal-adsorbate interactions. It was concluded that Rh initiates hydrogen formation while the gold nanoparticles more likely couples the methyl radicals. The activity of the Rh/TNT catalysts significantly decreased in irradiation time while the Au/TNT kept its activity. The activity decrease in the case of Rh/TNT was explained with the formation of structured surface carbon deposits. It was concluded that Rh can stabilize methine and methylene surface groups because it was prominently active in methane degradation [67, 68].
TNTs contain structural water and –OH groups basically that cannot be completely removed without permanent structural changes, thus H2O/–OH is always present in the system [8, 38, 44]. In the elucidation of the mechanism of the methane transformation on Au and Rh modified TNTs it was strongly
suspected that this crystallographic water or the surface OH- groups play an important role in the reaction. In addition, it was shown with electron paramagnetic resonance that the water and carbonates have got important roles in the overall photocatalytic reduction of carbon dioxide using TiO2 [69].
Water plays an also important role in the photocatalytic H2 production from ethanol–water mixtures over Pt/TiO2 and Au/TiO2 photocatalysts [70] and in alcohol-water mixtures on Au doped hydrogen TNT [10].
In order to prove the positive effect of water, in the pre- sent work we thoroughly investigated the photocatalytic CH4+H2O reaction on Au and Rh doped TNTs. The effect of CO2 addition to the system was also studied. We chose anatase TiO2 as reference catalyst instead of the more con- ventional P25 TiO2 because the incidental structural changes in TNTs under mild conditions generally led to the forma- tion of anatase phase [8, 33, 34]. First we characterized the catalysts with X-ray photoelectron spectroscopy (XPS) and high resolution transmission electron microscopy (HRTEM).
Then we performed photocatalytic reactions using a quartz reactor in continuous flow mode. We followed the photo ini- tiated reactions of CH4+H2O and CH4+CO2+H2O system as well. The surface of the catalysts during the photoreactions was monitored using diffuse reflectance infrared spectros- copy (DRIFTS). Physicochemical characterization including XPS and temperature programmed reduction (TPR) of the used catalysts were also performed.
2 Materials and methods
2.1 Preparation and characterization of the catalysts
Based on the literature results [8, 33, 71, 72] the nanotubu- lar structures could be obtained from different type of TiO2 precursors (including anatase and rutile). In the present work Degussa P25 TiO2; 80% rutile and 20% anatase (purity:
99.5%) was used. H-form TNT (H2Ti3O7·nH2O) were syn- thesized by an alkali hydrothermal method described previ- ously [8, 30, 32, 33, 38, 43, 61]. The as-synthesized TNT were analyzed with different methods including XPS, DTG- MS and DRIFTS. Hydrocarbon fragments were not detected, only adsorbed water and OH groups could be identified [38].
The gold nanoparticle decorated TNTs were synthesized with the sodium borohydride method [39, 61, 73]: 1 g nano- tube was added to 100 ml distilled water and suspended by ultrasonication. Then 5.2 ml of HAuCl4 solution was added to the nanotube suspension. The concentrations were calcu- lated to provide 1 wt% gold at the end of the synthesis. After this NaBH4 solution was added quickly to the suspension for rapid reduction of AuCl4− anions to small sized metallic gold particles. The reducing solution was made of 50 mg
NaBH4 dissolved in 5 ml distilled water. The suspension was kept stirred for an additional 20 min then filtered with a sintered glass filter (G4, 5–15 µm) and washed with distilled water. Then the sample was dried in an electric exsiccator at 350 K for 16 h. We tried to avoid the undesired phase trans- formation of TNT with this low-temperature method [39].
The Rh/TNT catalyst was synthesized by incipient wet- ness impregnating the TNT with RhCl3 solution to yield 1 wt% metal content [32, 38]. The impregnated powder was dried for 3 h in air at 383 K. The catalyst got further pre- treatment just before the photocatalytic measurements in order to form Rh0 state: the sample was annealed in oxy- gen flow for 1 h at 473 K and then flushed with argon then reduced in hydrogen flow for 1 h at 523 K, finally flushed with argon for 1 h at 523 K. In contrast to the Au/TNT com- posite the nanotube phase is stable up to 573 K in Rh/TNT hence the applied temperatures are in the safe range [38].
Anatase TiO2 (Hombikat UV-100; purity: 99.0%) pow- der was impregnated with HAuCl4 solution using the same method as for Rh/TNT to get Au/TiO2 with 1 wt% gold con- tent. The preparation procedure was identical with Rh/TNT.
The impregnation technique generally results in bigger sized nanoparticles than the reduction with NaBH4. Comparing this catalyst with the Au/TNT sample we can investigate the effect of the gold particle size on the mechanism.
We avoided the use of carbon containing compounds dur- ing the preparations in order to prevent incidental carbon contamination. These kinds of carbon contaminations could result in misleading conversions and artifact products [27].
The photocatalytic activity of both the pure supports and the composites were investigated with exactly the same reaction parameters.
At least 99.9 vol% pure gases were used in the pretreat- ment and preparation processes. In some cases further purification was applied with an in-line adsorption trap to remove carbon-dioxide and water contaminations. Triply distilled water was used for the catalyst preparation. The purities of the materials used in the synthesis were 99.9, 99.99 and 98 mol% for HAuCl4·nH2O, RhCl3·3H2O and NaBH4, respectively.
A Belcat A instrument (MicrotracBEL Corp.) was used to measure the BET surface areas of the materials. The instru- ment uses a single point method. The measured surface areas are the following: 278, 330, 264, 268 and 310 m2 g−1 ± 10%
for TiO2, TNT, Au/TiO2, Rh/TNT and Au/TNT, respectively.
The morphology of Au/TNT and Au/TiO2 catalysts was characterized by a FEI Tecnai G2 20 X-Twin transmis- sion electron microscope using 200 kV operation voltage,
×180,000 magnification and 125 pm/pixel resolution. The particle size distribution of the deposited metal was deter- mined by image analysis of the HRTEM pictures using the ImageJ software. The diameter distribution histogram was constructed from at least 100 individual nanoparticle
diameter measurements. Simple average calculation was applied in cases when not enough particles were detected.
XP spectra were collected with a SPECS instrument equipped with a PHOIBOS 150 MCD 9 analyzer, which was operated in the FAT mode with 20 eV pass energy. The Al Kα radiation (hν = 1486.6 eV) of a dual anode X-ray gun was used for excitation. The gun was operated at 210 W (14 kV, 15 mA) power. Five scans were summed to get a single high-resolution spectrum. The maximum of the Ti 2p3/2 peak (458.9 eV) was used as binding energy reference.
Self-supporting pellets were used in the XPS measurements.
SpecsLab2 and CasaXPS software packages were used for spectrum acquisition and evaluation.
The quantity and reactivity of the surface carbon deposits were analyzed with TPR method: The spent catalyst was placed into a 10 cm long quartz tube and heated up from room temperature to 1173 K linearly at 15 K min−1 rate in 40 ml min−1 hydrogen flow. The products were analyzed with gas chromatography (Agilent 7890, HP Carbonplot capillary column, FI and TC detectors).
2.2 Photocatalytic tests
A flow-type cylindrical photoreactor was used for the photocatalytic reactions. The structure of the reactor was described in detail previously [61]. A high pressure mer- cury-arc lamp (undoped TQ-718) operated at 500 W was used for irradiation. Typically 0.5 g catalyst was used in the reactions. The reactant gases were mixed by mass flow controllers: 0.9 cm3 min−1 methane was introduced into 28.2 cm3 min−1 argon then bubbled through water at 298 K at atmospheric pressure to get surplus 0.9 cm3 min−1 water vapor stream and to finally produce 30 cm3 min−1 CH4–H2O–Ar mixture (CH4:H2O = 1:1 molar ratio). For the other experiment 0.9 cm3 min−1 CH4 and 0.9 cm3 min−1 CO2 were introduced into 27.3 cm3 min−1 argon then bubbled through 298 K water to get CH4–CO2–H2O–Ar mixture with CH4:CO2:H2O = 1:1:1 molar ratio. A blank experiment was also carried out where 29.1 cm3 min−1 argon was bubbled through water at 298 K to get H2O–Ar mixture. The aver- age dwell time of the reactants was approximately 16 min considering the overall flow rate (v = 30 cm3 min−1) and the volume of the reactor (476 cm3).
The products formed in the photoreactions were analyzed with a Hiden HPR-70 mass spectrometer equipped with an electron ionizer source, a HAL3F-RC quadrupole mass selector and an 8-way batch inlet sampling system. Chroma- tographic separation was not used. Samples were taken from the gas stream at the inlet and the outlet of the reactor during the experiments and the signal differences (signal at inlet subtracted from the signal at outlet) were used further in the evaluations. The signal intensity (
yi(t)) at the 2, 15, 16, 18, 26, 27, 28, 29, 30, 31, 43, 44 and 45 m/z values ( yi(t) refers
to the differential signal) were followed. The spectrometer was previously calibrated for all expected products.
The photocatalytic measurement sequence consisted of a 6 h baseline section and 18 h UV-section where the irradia- tion was periodically paused for 3 h in every 6 h. The cata- lyst temperature (T) was around 403 K during the irradiation due to the undesirable heat effect of the lamp. The catalyst was heated to 403 K in the dark sessions too, to minimize the temperature fluctuation. The following photocatalytic reactions were performed: the CH4+H2O reaction and the CH4+CO2+H2O reaction. An additional blank experiment was also carried out with water–argon mixture. The blank experiment was applied to check the origin of the products.
The registered yi(t) functions were transformed to ri(t) func- tions (formation rate) in µmol h−1 g−1 units according to Eq. (1) where fi stands for the calibration factor (from signal to molar fraction) of the i-th component, v is the overall flow rate of reactants and mcat means the mass of the used catalyst.
The mean formation rates of the 9 h irradiation ( ri)
were calculated in µmol h−1 g−1 units for all the products and reactants according to Eq. (2).
The rates with negative sign correspond to the reactants.
Broadband apparent quantum yield (Z) was calculated in all experiments. First we measured the irradiance (Eλ1−λ2) at the distance of the catalyst with a thermal detector in the 200–350 nm and in the 350–2000 nm ranges. This gave 0.143 (± 16%) and 0.199 (± 6.5%) W cm−2 values [61].
Then we normalized the spectral power distribution (SPD) curve (M(λ)) of the lamp with the measured irradiance value according to Eq. (3).
The normalized SPD curve (M’(λ)) was then converted to spectral photon flux (Φ(λ)) in mol h−1 cm−2 nm−1 units using the Avogadro constant (NA) according to Eq. (4).
Then absolute incident photon flux was calculated for each catalyst according to Eq. (5) by integrating the spectral photon flux from 200 nm to the wavelength of the bandgap (Eg) which was determined previously [61].
(1) ri(t) = fiyi(t) p v
R T mcat
(2) ri= 1
9h
24h
∫
6h
ri(t)dt
(3) E200−350=
350
�
200
M(𝜆)d𝜆≡0.143 Wcm−2
(4) Φ(𝜆) = M�(𝜆)𝜆
h c NA
(5) Φ200−E
g=
Eg
∫
200
Φ(𝜆)d𝜆
Finally the broadband apparent quantum yield referring to the formation of the main product (hydrogen) was calcu- lated with Eq. (6) where A stands for the catalyst covered area (= 430 cm2).
This quantity represents UV-source specific data because a UV-source with multiline spectrum (a high pressure mer- cury arc lamp) was used for excitation. The AQY values should be determined at a discrete wavelength for better comparability hence care must be taken when comparing the actual ZH2 values with the more frequently used AQY values in the literature [74, 75]. Otherwise, for a precise real quantum yield determination we should use monochromatic light and should know the quantity of the absorbed photons instead of the incident photons [76, 77].
The surface of the catalysts was investigated in-situ by infrared spectroscopy. An Agilent Cary-670 FTIR spec- trometer was used with Harrick Praying Mantis diffuse reflectance system. The sample holder had BaF2 windows in the infrared beam path and an additional quartz window for UV-irradiation. A focused mercury lamp (Osram, HBO 100 W/2, short arc) was used for UV excitation. 16 scans were recorded at 2 cm−1 spectral resolution. The background was recorded just after the pretreatment. The applied tem- peratures and gases were the same as used in the photocata- lytic experiments. The UV irradiation was paused when the spectra were collected. After 1 h irradiation the reactants were flushed out from the sample space with inert gas and a final spectrum was collected after 30 min flushing in all experiments.
3 Results and discussion
3.1 Characterization of the supported Rh and Au catalysts
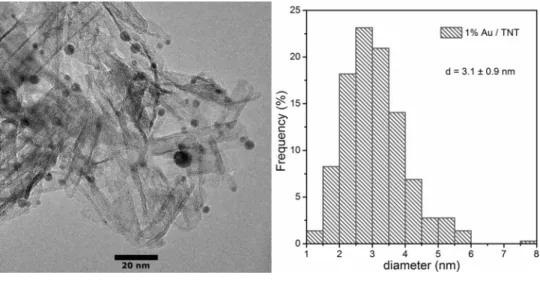
Au/TNT was characterized in detail by XPS previously [39, 61]. Symmetric Au 4f5/2 and 4f7/2 emissions were observed at 87.7 and 84.0 eV which correspond to Au0. An additional peak at 85.9 eV (Au 4f7/2) appeared, too. This peak at higher binding energies can be the result of core level shifts due to low particle size [39, 78]. Another possible explanation is that Aun+ ions may occupy some of the ion exchange posi- tions of TNT [39]. The TEM image on Fig. 1 shows the tubular morphology of the TNT support and the arrangement of the Au nanoparticles on it.
The average diameter of the nanotube channels is 7 nm.
Particle size distribution was calculated and plotted in Fig. 1.
The size of the identified Au nanoparticles is in the 1–8 nm (6) ZH
2 = rH
2mcat AΦ200−E
g
range. The average particle size is 3.1 ± 0.9 nm, and the most abundant size is 2.5–3.0 nm. Smaller than 1.5 nm sized par- ticles were found, too, where the molecular-like behavior of gold becomes dominant [79, 80]. The UV–Visible absorp- tion characteristics of Au/TNT was also studied previously with diffuse reflectance method: a strong absorption band at 2.31 eV (534 nm) appeared in the spectrum of Au/TNT which corresponds to the excitation of the local surface plas- mon resonance of gold nanoparticles [61, 81]. We identified the absorption bands of the molecular-like transitions, too.
UV absorptions were observed at 2.68, 2.93 and 3.19 eV [61]. Recently it was published that Au25 clusters exhibit multiple molecular-like transitions in its optical absorption spectrum: at least three well-defined bands at 1.8, 2.75 and 3.1 eV were observed in the UV–Vis spectrum [82].
XPS measurements of the pretreated Rh/TNT catalysts were performed recently [38]. The Rh 3d5/2 peak appeared at 309.3 eV in the case of 1% Rh content while at 308.3 eV on the catalyst with 2% Rh. These energies are higher than for Rh0 (307.1 eV) which suggest an oxidized state of Rh. On the other hand very small Rh clusters can result higher bind- ing energies, too. The average Rh particle size determined from TEM experiments resulted in 2.8 nm, but as small as 1 nm sized metal particles were detected, too [32, 38].
The pretreated Au/TiO2 catalyst was investigated with TEM. The corresponding TEM image is shown in Fig. 2.
The average particle size of Au was calculated from 13 diameter measurements and resulted in 7.4 ± 2.7 nm. This is in the range of the size of the support (Hombikat UV-100, anatase), and is significantly higher than in the case of Au/
TNT (Fig. 1). According to XPS analysis, the Au 4f7/2 peak appeared at 84.0 eV (not shown). No high energy side shoul- der was observed which could be attributed to very small clusters or positively charged Au. Due to the higher parti- cle size of gold the relative contribution of the plasmonic character of it is pronounced [61]. The most important
parameters of the catalysts of the recent work are collected in Table 1.
3.2 Photocatalytic test experiments
The methane can be photo-converted on all catalysts as the photocatalytic tests showed. Figure 3 depicts the methane conversion and product formation as a function of irradia- tion time observed in the CH4+H2O reaction. The non- zero values in the initial molar fractions of the products are due to the residual gas background of these molecules.
The molar fractions of the products are increases but the quantity of methane decreases in the UV periods as can be seen. Hydrogen, carbon dioxide and ethane were identi- fied as main products. Higher methane consumption and hydrogen formation were observed on Rh/TNT comparing to Au/TiO2 and Au/TNT, on the other hand decreasing molar fractions could be observed in this case. This drop
Fig. 1 TEM image (left) and the size distribution of Au particles (right) of Au/TNT
Fig. 2 TEM image of the Au/TiO2 catalyst
is assumed to be the result of activity loss because it is restricted to the UV active periods. In the case of Au/TNT and Au/TiO2 no activity loss was observed in the experi- ments but also smaller methane conversions occurred. The Au/TiO2 catalyst showed higher activity than the Au/TNT
as demonstrated in Fig. 3. A small amount of methanol was also detected on all catalysts (not shown).
These catalysts showed the same behavior when carbon dioxide was introduced into the system as reactant (Fig. 4).
The main products were hydrogen and ethane, and the same tendency was observed as in the CH4+H2O reaction: higher
Table 1 The most important parameters of the catalysts used in the present work
Catalyst Rh/TNT Au/TNT Au/TiO2
Support H2Ti3O7·nH2O tube H2Ti3O7·nH2O tube TiO2 anatase 10 nm Impregnation Incipient wetness In suspension Incipient wetness Metal reduction In situ, H2 With NaBH4 solution In situ, H2
Metal content (wt%) 1.0 ± 0.1 1.0 ± 0.5 1.0 ± 0.1
BET surface area (m2 g−1) 268 ± 27 310 ± 31 264 ± 26 Average metal particle size (nm) 2.8 ± 0.7 3.1 ± 0.9 7.4 ± 2.7
Bandgap (eV) [61] 3.08 3.03 3.04
Fig. 3 The changes in the molar fractions in time on Rh/TNT, Au/TNT and Au/TiO2 catalysts in the CH4+H2O reaction (the absolute signals at the reactor outlet after conversion to ppm are plotted)
Fig. 4 The molar fraction changes of the analyzed mol- ecules as a function of experi- ment time on Rh/TNT, Au/TNT and Au/TiO2 catalysts in the CH4+CO2+H2O reaction (The absolute signals at the reactor outlet after conversion to ppm are plotted)
methane consumption and hydrogen formation rates but activity loss occurred in the case of Rh/TNT. Carbon diox- ide transformation was not observed, on the contrary, CO2 formed as in the CH4+H2O reaction. Au/TiO2 again showed higher activity than Au/TNT.
We calculated the formation rates of the various prod- ucts for better comparison and to analyze the effect of CO2 introduction. Table 2 shows the mean formation rates of the identified products. Methane conversion values (KCH4) were calculated, too. We present in the table our earlier results on CH4 decomposition, too, for easier comparison. The main products of the methane transformation are H2 and ethane but some CO2, CO and methanol also form. The accurate analysis of water consumption or formation was not feasible in our experiment setup. Carbon-dioxide can be a product or reactant, too. As can be seen the pure supports had the lowest activity in the methane conversion. The addition of metal significantly increased the rate of methane consump- tion in all reaction types.
Au/TNT and Rh/TNT showed the same activity in meth- ane conversion when water was not present in the reactants.
The methane conversion values were 1–2%. Au/TiO2 was less active in these experiments (KCH4 < 1%). CO2 and CO formed which is the consequence of an oxygen source. Some adsorbed water is always present and can act as an oxygen source as we pointed out previously [61]. The addition of CO2 beside methane had negligible effect on the rates and on the methane conversion values [61]. One order of magni- tude more ethane formed on Au/TNT than in the other cases
when water was not used as reactant. It means that the oxida- tion of methane stops at the methyl stage more frequently on Au/TiO2 in dry conditions.
The introduction of water as a reactant had notable effect on the product distribution. The conversion of methane was the highest on Rh/TNT and the lowest on Au/TNT among the supported metals. The formation of hydrogen followed the same tendency, but generally higher formation rates were observed than in the dry experiments. The methane conver- sion and the rate of hydrogen formation were the highest on Rh/TNT in the CH4+CO2+H2O reaction.
Au/TiO2 worked better in the methane conversion than Au/TNT when water was present. On the contrary, Au/TNT showed higher activity under dry conditions. The values of the methane consumptions were practically alternated between Au/TNT and Au/TiO2 when water was introduced.
The most ethane formed on TiO2 and Au/TiO2. The deposi- tion of gold did not increase further the rate of ethane forma- tion which means that the methyl coupling also happens on the surface of the TiO2 under wet conditions. The introduc- tion of CO2 had a significant effect on the Rh/TNT system when water was present. The rates of the methane consump- tion and the hydrogen formation increased by approximately 50%. The conversion of CO2 was under our detection limit except in two cases when CO2 was formed in spite of its high initial concentration. Therefore CO2 rather forms than consumes in the experiments.
In order to examine if there is a carbon source or sink in the system a carbon balance (ΔC) was calculated from the
Table 2 The mean formation rates of the products (
ri) , the methane conversions (KCH4), the carbon balances (ΔC) and the broadband AQY values regarding to hydrogen formation (ZH2) in the different experiments
bdl below detection limit (The detection limit is unique for each case.)
a Estimated deviation is > 10% but ≤ 25%
b Estimated deviation is > 25% but ≤ 50%
c Estimated deviation is > 50% but < 100%
Reactants Catalyst r
i (µmol h−1 g−1) KCH4 (%) ΔC (µmol g−1) ZH2 CH4 C2H6 H2 CO2 CO CH3OH
CH4
[61] TNT − 8.7c 1.2a 1.4b 3.0a bdl bdl 0.23c bdl 1.1 × 10⁻⁶ Rh/TNT − 50a 1.9 115 11a 5.4b 0.14c 1.4 261b 9.4 × 10− 5 Au/TNT − 70b 12 116 18a 11a 1.0b 1.6b 143c 7.2 × 10⁻⁵ Au/TiO2 − 22c 1.5 48 9.3a 1.7b 0.11c 0.82c bdl 4.8 × 10⁻⁵ CH4
H2O TNT bdl 3.0 11a 6.2a 4.1b 0.19c bdl bdl 9.4 × 10⁻⁶
TiO2 − 24c 5.6 3.8b 6.0a 4.0b 0.44b 0.74c bdl 3.1 × 10⁻⁶ Rh/TNT − 108a 2.0a 296a 41a 13a bdl 3.0a 457c 2.3 × 10⁻⁴ Au/TNT − 25a 3.3 56a 13a 3.1b 0.57c 0.65b bdl 4.0 × 10⁻⁵ Au/TiO2 − 79b 5.8 191 36a 6.5b 0.40c 2.0a 222c 1.3 × 10⁻⁴ CH4
CO2 H2O
TNT − 16a 1.5 bdl bdl bdl 0.27c 0.66a 108b –
TiO2 bdl 6.9 6.0a bdl 4.1c 0.64b bdl bdl 3.9 × 10⁻⁶
Rh/TNT − 155a 2.8 446 128b 17b 0.21c 3.6a bdl 2.9 × 10⁻⁴ Au/TNT − 29c 3.6 63a bdl 3.5c 0.51c 0.79c 156c 4.6 × 10⁻⁵ Au/TiO2 − 61a 5.3 190 70c 4.9 c 0.36c 1.7a bdl 1.4 × 10⁻⁴
H2O Rh/TNT bdl bdl bdl 0.34c bdl bdl – – –
mean formation rates. The calculation was performed by Eq. (7) and the results are shown in Table 2.
In most of the cases the final error of ΔC is more than 100% (marked with “bdl” in Table 2) due to the error propagation. The detection limit fluctuates between 50 and 800 µmol g−1. The carbon balance is negative in some cases because some carbon is missing from the product stream and remained on the surface. The highest amount of surface carbon was about 3.7% respect to converted methane. The reason of the carbon sink can be some kind of carbon deposit or an undetected product. In most of the cases the experi- ments on Rh/TNT resulted in large ΔC values.
An additional blank experiment was performed in order to exclude that the products do not originates from surface contaminations: the experiment with water-argon mixture did not result in hydrogen, methane or ethane formation.
Only a trace amount of CO2 evolved. This means that the products generally originate from the reactants. In short, the introduction of water increased the degree of methane con- version and hydrogen production in the methane decomposi- tion reaction on Rh/TNT and on Au/TiO2. This effect was more pronounced when CO2 was also present as reactant.
The broadband AQY values regarding hydrogen forma- tion (ZH2) presented in Table 2 are quite low comparing to the AQY percentages reported in water splitting reactions (these are very often above 50%) [74]. Some high quan- tum yield values were reported in the CO2 photoreduction, too, but these values are not comparable directly with ours because the absorbed fraction of the incident photons is (7) ΔC=(
−rCH
4−2rC
2H6−rCO
2−rCO−rCH
3OH
)×9h
unknown in our case [26]. The difference between the val- ues within the column follows exactly the tendency of the hydrogen formation rates because of the similar bandgap values. The reason of the low yields could be studied by investigating the efficiency of the consecutive steps of the mechanism [74]. This requires different methods and the exact knowledge of the reaction mechanism.
3.3 In‑situ FTIR measurements
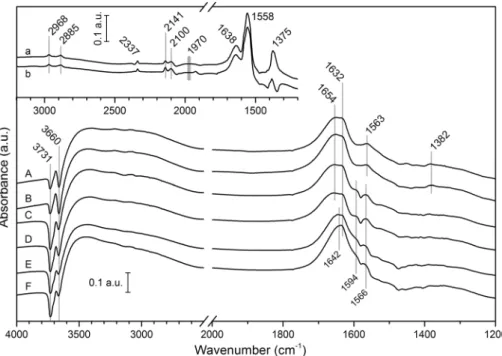
The infrared spectra collected after 1 h irradiation in the CH4+H2O and CH4+CO2+H2O reactions are shown in Fig. 5. The pretreatment of the catalysts were carried out in situ in DRIFTS cell [61]. Some peaks appeared due to the adsorption of the reactants. No effect of the irradiation on the spectra was observed in these two reaction types. The adsorption of water resulted in the appearance of a broad band between 2700 and 3700 cm−1 (H-bridged stretching), negative peaks were detected at 3731 and 3660 cm−1 (νas and νs of H2O), and absorptions around 1640 cm−1 (β(H2O)).
The evolution of the negative peaks means that the quan- tity of the isolated water molecules decreases as its surface concentration increases and H-bridged structure forms. The bending mode of two types of adsorbed water was observed at 1654 and 1632 cm−1 on the Rh/TNT and TNT catalysts.
The β(H2O) vibration appeared at 1642 cm−1 in the case of Au/TNT. The adsorption of CO2 ended up in small peaks at 1563 and 1382 cm−1 which are identified as surface bonded bidentate carbonates of the TNTs [83, 84]. The spectral absorptions of these surface carbonates were much stronger in the case of Rh/TNT when water was not applied as can be seen in Fig. 5. It means that water chemisorbs stronger than
Fig. 5 In-situ DRIFT spectra collected after 1 h UV irradia- tion: CO2+CH4+H2O reaction on Rh/TNT (A), on TNT (C) and on Au/TNT (E); CH4+H2O reaction on Rh/TNT (B), on TNT (D) and on Au/TNT (F);
CO2+CH4 reaction on Rh/TNT (a) [61], CH4 decomposition on Rh/TNT (b) [61]. The sample space was flushed with helium
CO2 on the surface of TNTs. The appearance of the band as a shoulder at 1594 cm−1 may indicate that formate can also form during the adsorption of the reactants when Rh is not present [83, 84]. This formate can act as an intermedi- ate which easily transforms to carbonate and probably to methanol in the presence of water [85, 86].
Bands were observed in the range of 1800–3000 cm−1 in the case of Rh/TNT when water was not present as reactant (inset in Fig. 5). These peaks appeared under irradiation and it was concluded previously that some of these features are due to important changes occurred on the catalyst surface (surface carbonaceous deposits and the re-oxidation of Rh particles) [61]. The lack of these peaks under wet conditions means that water just blocks these adsorption sites of CO and CO2 but not prevents the formation of surface deposits and the oxidation of Rh.
3.4 Study of spent catalysts
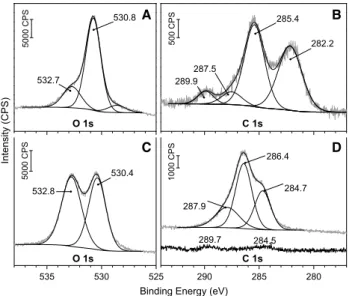
XPS measurements were made on the spent catalysts in the binding energy range of O 1s and C 1s orbitals from the Rh/TNT and Au/TiO2 catalysts used in the CH4+CO2+H2O reaction (Fig. 6). The used catalyst was placed in the prepa- ration chamber connected to the main analysis chamber.
After flashing with argon, the sample was introduced to the vacuum chamber (10−8 mbar) for XPS analysis [61].
The lattice oxygen of TiO2 is represented by the 530.8 eV O 1s peak (Fig. 6a) [38, 87]. The photoemission peak at 532.7 eV involves single fold oxygen or –OH species [38], oxygens of organic C=O or C–O–R bonds [88] and organic carbonate species [89]. The peak at 528.5 eV could not be
clearly identified. We could resolve the C 1s region into four peaks (Fig. 6b): The peak at 289.9 eV corresponds to car- bonate ions [87]. C–O–C carbon was detected at 287.5 eV [90]. Carbon with sp3 hybrid state (i.e. C, CH, CH2 or CH3) can be identified at 285.4 eV [88, 90]. Carbidic carbon at 282.2 eV was also identified [87]. C0 with sp2 hybrid state in the range of 284–285 eV was not detected [88, 90].
Figure 6c shows the O 1s XP spectra of the Rh/TNT catalyst spent in the CH4+CO2+H2O reaction. The lattice oxygen of TNT appeared at 530.4 eV (O 1s). The peak at 532.8 eV represents mainly –OH species which have got greater number in TNT comparing to TiO2 according to the peak areas [38]. This is in accordance with the main structural differences as TNT contains larger amount of ion exchangeable –OH groups than TiO2 [8, 44]. However the peak at 532.8 eV can also involve organic C=O and C–O–R oxygens [88]. The carbon 1s region could be deconvolved into three peaks (Fig. 6d): The peak at 284.7 eV corresponds to C0 with sp2 hybrid state [88, 90]. The peak at 286.4 eV is characteristic for the C–OH carbons [88]. The binding energy at 287.9 eV corresponds to C=O carbon which can originate from the Rh-chemisorbed carbon-monoxide molecules [90]. Carbonates and carbidic carbons were not clearly resolved in this sample. Additional C 1s spectrum (lower) shows the carbon region before use, just after reduc- tion (Fig. 6d). The observed intensity of this background is significantly lower than that was detected after reaction.
This gives a strong proof that the detected carbon signals originate from the reaction.
It can be assumed from the activity loss and from the XPS results that surface carbon forms during the reactions especially on the Rh/TNT catalyst. In order to measure the quantity and reactivity of this surface deposit TPR experi- ments were carried out. In TPR experiments we measured only Rh/TNT catalysts used in the different reactions. Two blank experiments were performed which confirmed that the pre-treated sample is free of reducible surface carbon and the thermal decomposition of methane is negligible. The for- mation of methane was detected on spent Rh/TNT catalyst.
The methane formation rate is plotted in Fig. 7 along with our earlier measurements on Rh/TNT obtained in similar way for easier comparison [61]. Small amount of ethane and carbon-dioxide also formed in these experiments. The detected methane and ethane means that the surface contains easily reducible carbonaceous deposits which formed under irradiation. The carbon dioxide originates from surface car- bonates which simply desorbs at elevated temperatures.
The formation rate of methane have got a maximum which is around 650 K in all cases. Additionally, a higher temperature peak can be observed around 900 K in the experiments where water was a reactant, too. This means that the structure of the carbonaceous deposits slightly differs under dry and wet conditions. XPS experiments
535 530 525 290 285 280
A
Intensity (CPS)
530.8
532.7
5000 CPS
O 1s
B
282.2 285.4
287.5 289.9
500 CPS
C 1s
C
Binding Energy (eV) 530.4
532.8
5000 CPS
O 1s
289.7 284.5
D
284.7 286.4
287.9
1000 CPS
C 1s
Fig. 6 The O 1s and C 1s XP spectra of Au/TiO2 (anatase) (a and b) and Rh/TNT (c and d) catalysts used in the CH4+CO2+H2O reaction.
Additional C 1s spectrum (lower) shows the carbon region before use, just after reduction (d)
showed several oxidized forms of surface carbon in the CH4+CO2+H2O reaction (Fig. 6d), more than in our previ- ous studies on CH4 transformation [61]. The higher tempera- ture TPR peak can represent the reduction of C=O carbon detected at 287.9 eV in XP spectra.
The overall quantity of methane formed related to cata- lyst unit mass in the TPR experiments was calculated by the time integral of the TPR curves. The values are 528, 354 and 384 µmol g−1 in the CH4+H2O, CH4+CO2 and CH4+CO2+H2O reactions, respectively. These results are in acceptable accordance with the ΔC values presented in Table 2 except in the case of the CH4+CO2+H2O reac- tion. The deviation is not understood yet. Generally 20–30 µmol g−1 methane formed in the TPR measurements made on the used Au/TNT and Au/TiO2 catalysts. So the detected easily reducible carbon containing surface deposits are the byproducts of the photoreactions and formed in larger quantities on Rh catalysts.
3.5 Presumed photocatalytic mechanism for Rh catalysts
It turned out in our photocatalytic experiments that the titan- ate (in nanotube form) and titania nanostructures are active in methane transformation. The photochemical activity of titanate and titania is appreciably enhanced by Au and Rh nanoparticle deposition. As we already mentioned in the introduction, depositing metal onto the semiconductor sur- face can considerably suppress the rate of exciton recombi- nation [24, 57, 60]. Dispersed Au and Rh crystallites serve as electron sinks in our case hence the increase in activity was expected. In case of gold nanoparticles the LSPR and the short-range (molecular-like Au clusters) interaction may
play an important role in photocatalysis [58, 61, 63–65, 91].
Gold clusters is small size (d < 3 nm) lose their bulk-like electronic properties; for example, they no longer show the plasmonic excitation character [82].
We offer different mechanisms for Au and Rh catalysts because the adsorption characteristics of these metals are distinct. The activity of Rh/TNT towards methane conver- sion is better when water is present in the system and the best when CO2 and H2O are both introduced as reactants besides methane (Table 2). The surface composition of the catalyst is quite different in the presence of water than without it as can be seen from the DRIFTS results (Fig. 5). Only minimal amount of surface carbonate was detected besides adsorbed water under wet conditions unlike in the dry experiments where more carbonate appeared. In addition Rh-bonded CO and surface –CH3 groups were also detected in the latter case. This means that water dominates the surfaces of both the support and the metal particles under wet conditions.
The rate of methane conversion and hydrogen formation slightly decreased over time on Rh/TNT catalyst (see Figs. 3, 4) because surface carbon deposits form in the reaction. The reactivity of the surface carbon is independent of the reac- tion type (Fig. 7). It contains mainly C–OR, additionally C0 (with sp3 hybrid state) and C=O carbons in the case of the CH4+CO2+H2O reaction (Fig. 6). M–C carbons were not clearly resolved in this sample. So oxidized carbon depos- its develop in the presence of water (C0–C2+ carbons), but the surface deposit consisted mainly of C0 (with more sp2 character), additionally M–C and C–OR carbons under dry conditions [61]. Rh is more able than Au to dissociate CH4 and –CHx groups to hydrogen and surface carbon. The slight thermal decomposition of methane proceeds even on 423 K on Rh catalysts [16]. This is in accordance with our previous TPR results which suggest that methane slightly decomposes at 403 K on Rh/TNT [61].
Water must have an important role in the mechanism because of its promoting effect. It is generally accepted that water adsorbed on the surface of titanates or TiO2 can pre- vent the electron–hole pair recombination by capturing the charges [71, 92]. The photogenerated holes can react with the adsorbed water resulting in OH radical and H+. These species can delocalize on the surrounding H2O (Eq. 8).
The electrons can be trapped by the proton formed as in (8) across the adsorbed water (9). The source of this electron can be the TNT support or the metal particle.
Methane reacts with the OH radicals (10) then contin- ues the oxidation to C0 on the surface of Rh (Eq. 11). It
(8) TNT(
h+)
+H2O(TNT) →TNT+OH∗(TNT)+H+(H
2O)
(9) TNT(e−)∕M(e−) +H+(H
2O) →TNT∕M+H∗
(H2O)∕H∗(M)
Fig. 7 The methane formation rates during the TPR measurements of the spent Rh/TNT, catalyst. The curves with filled square and filled circle symbols are from our previous work [61]. Blank experiment performed on pretreated catalyst is also shown
is generally accepted that the dehydrogenation process of methyl groups rather occurs on rhodium [93]:
The hydrogen radicals which are the results of electron trapping or methane oxidation recombine to molecular hydrogen on the Rh surface (12). The hydrogen and methyl radicals can also recombine and produce methane (13).
The conversion of CO2 was not observed at all in the experiments but it had a promoting effect in one case: this effect was observed only when water was present and CO2 must be in dissolved form. Dissolved CO2 in carbonate form can act as hole scavenger, hence can elongate the lifetime of the electron–hole pairs (14) [69]. Additionally, hydrogen carbonates trapped by a hole can generate OH radicals, too (15) which can be responsible for the increased activity.
3.6 Presumed photocatalytic mechanism for Au catalysts
We achieved higher methane conversions with Au/TNT under dry conditions than under wet conditions. The per- formance of the Au/TiO2 catalyst was exactly the opposite.
It operated better when water was a reactant, too. Addition- ally, more hydrogen formed in this case under wet conditions than with Au/TNT under dry conditions. Au/TNT and Au/
TiO2 differ not only in the support but also in their method of synthesis. The NaBH4 reduced Au/TNT contains smaller Au particles while the average Au particle size in Au/TiO2 is its double (Table 1). Both catalysts have gold particles with plasmonic or molecular like characters, too, as it was shown previously, but Au/TNT contains more molecular-like Au clusters [61]. Recently it was shown that this type of Au cluster sufficiently catalysis certain reaction; for example it can activate the CO in CO oxidation [94, 95]. We sug- gest that the molecular-like Au cluster may facilitate the activation of methane for transformation to dehydrogena- tion (13) and the coupling of methyl to ethane (16) which
(10) OH∗(TNT)+CH4(g)��������M→H2O(TNT)+CH∗3(M)
(11) CH∗3(M)��������M→CH∗2(M)+H∗(M)→→C(M)+3
2H2(g)
(12) 2H∗(M)��������M→H2(M) →H2(g)
(13) CH∗3(M)+H∗(M)��������M→CH4(M)→CH4(g)
(14) TNT(
h+)
+CO2−3(aq) →TNT+CO∗−3(aq)
(15) TNT(
h+)
+HCO−3(aq) →TNT+CO2(aq)+OH∗(aq)
dominates on Au/TNT as can be seen in Table 2. It is gener- ally accepted that the coupling of methyl radicals favored on gold [96]:
Excess water blocks this mechanism probably at the stage of methane chemisorption hence the lower methane con- versions. The scene of methyl coupling is relocated to the surface of the TNT or TiO2 when water is present in excess because the presence of metal had no effect on the forma- tion rate of ethane. The gold particles in Au/TiO2 are mainly plasmonic. This catalyst may operates better when water is present probably due to the plasmon assisted dissociation of water which produces OH radicals on the surface. The as generated OH* can react with methane in a radical type reaction. This mechanism is not blocked but enhanced by water implicitly.
Only a small amount of surface carbonaceous deposit was formed in these reactions comparing to the Rh/TNT catalyst as can be seen from the TPR measurements (Fig. 7) and in the XPS measurements (Fig. 6). The surface carbon found on Au/TiO2 is more oxidized than on Rh/TNT which can be the result of the more oxidative environment. No effect was observed on gold catalysts when CO2 was introduced as reactant.
The formation of methanol was also detected in all exper- iments. The formation rates of methanol and ethane shows strong correlation (Table 2). This means that the forma- tion of methanol (18) is a general side reaction of methyl coupling (16). CH3–OH may also coupling but it is very likely that methyl groups reacts with lattice oxygen of oxide support, the formed methoxy species (which could be an intermediates in several catalytic processes [97]) reacts with hydrogen atoms:
The rate of the further reaction of methyl radical deter- mines the ratio of different products.
4 Conclusions
In the present study we confirm the role of structural H2O/–OH of TNT in photocatalysis. For this purpose we investigated the photocatalytic conversion of methane with additional water.
It was demonstrated that methane can be photocatalyti- cally transformed to hydrogen with relatively large cross sec- tion. The presence of water and CO2 catalyzes this reaction.
The route of the transformation is strongly determined by (16) 2CH∗3��������M→C2H6→C2H6(g)
(17) CH∗3+O→CH3O
(18) CH3O+H→CH3OH