This is a post-peer-review, pre-copy edited version of an article published in the European Sociological Review.
The published version (Hajdu, G., Hajdu, T. [2018]: Intra-Couple Income Distribution and Subjective Well-Being: The Moderating Effect of Gender Norms. European
Sociological Review, 34(2), 138-156. https://doi.org/10.1093/esr/jcy006 ) is available online at:
https://academic.oup.com/esr/article-abstract/34/2/138/4934178
Intra-Couple Income Distribution and Subjective Well-Being: The Moderating Effect of Gender Norms
Gábor Hajdua,b,* – Tamás Hajduc
a Institute for Sociology, Centre for Social Sciences, Hungarian Academy of Sciences, 1097 Budapest, Tóth Kálmán u. 4., Hungary (hajdu.gabor@tk.mta.hu)
b MTA-ELTE Peripato Comparative Social Dynamics Research Group, 1117 Budapest, Pázmány Péter sétány 1/A, Hungary
c Institute of Economics, Centre for Economic and Regional Studies, Hungarian Academy of Sciences, 1097 Budapest, Tóth Kálmán u. 4., Hungary (hajdu.tamas@krtk.mta.hu)
* corresponding author at the Institute for Sociology, Centre for Social Sciences, Hungarian Academy of Sciences, 1097 Budapest, Tóth Kálmán u. 4., Hungary. E-mail: hajdu.gabor@tk.mta.hu
Abstract
This paper examines the relationship between intra-couple income distribution and subjective well- being, using nationally representative data from Hungary. We show that the association between the woman’s relative income (the woman’s share of the couple’s total income) and life satisfaction is negative not only for men, but for women as well. Because we control for financial disadvantages on the individual and household level, as well as for socio-economic and job characteristics of the respondent and their partner, the result can be interpreted as the impact of traditional gender roles and the persistence of the traditional male breadwinner mentality. In addition, we show that gender norms moderate this negative association. Among those with low levels of traditional norms, the woman’s relative income has no effect on life satisfaction, whereas among those who prefer traditional gender roles, the negative association is stronger. Our results suggest that conflicts between the gender norms and the social and economic reality reduce life satisfaction.
Keywords: intra-couple income distribution; life satisfaction; gender norms; relative income Funding
This research did not receive any specific grant from funding agencies in the public, commercial, or not- for-profit sectors.
1 1. Introduction
Over the last decades, subjective indicators of quality of life have gained growing significance in social sciences and social policy (Kahneman and Krueger, 2006; Dolan and White, 2007;
Diener et al., 2009; Stiglitz, Sen and Fitoussi, 2009; Helliwell, Layard and Sachs, 2015). The impact of income and income distribution on subjective well-being is especially widely researched. Evidence about the effect of income inequalities (Alesina, Di Tella and MacCulloch, 2004; Hajdu and Hajdu, 2014; Schröder, 2016; Kelley and Evans, 2017), absolute and relative income (Clark and Oswald, 1996; Ferrer-i-Carbonell, 2005; D’Ambrosio and Frick, 2012; Card et al., 2012) are well-known results of this research field. Although the effect of income comparison and different comparison groups are widely studied, intra-couple income distribution is a less researched area. The effect of intra-couple income distribution on the partners’ subjective well-being can be considered as a special type of comparison that is primarily influenced by the partners’ preferred contributions to the household budget and gender norms.
In this paper, we analyze the relationship between intra-couple income distribution and subjective well-being, using nationally representative data from Hungary. Our main research question is whether the partners’ life satisfaction is influenced by the intra-couple income distribution in the household. In addition, we also explicitly address the role of gender norms in this process.
This study might be especially interesting because in Hungary the prevalence of traditional values and gender roles is high, but in a European perspective the education and labor force participation gap between men and women is relatively low. Women’s education level is above men’s, and their activity rate is getting closer to men’s. This leads to some tension between attitudes/preferences and the economic reality. Analyzing the relationship between the woman’s relative income and her partner’s satisfaction provides interesting insights about the
2
effect of this tension, which is likely to be growing in the future, unless there is a substantial change in gender norms.
Previous research on this issue used Western European and American data (Rogers and DeBoer, 2001; Bonke, 2008; Furdyna, Tucker and James, 2008; Ahn, Ateca-Amestoy and Ugidos, 2014; Bertrand, Kamenica and Pan, 2015; Eirich and Robinson, 2017). It has found mostly negative associations between women’s relative income and men’s financial or marital happiness, whereas the results are mixed and less conclusive for women. In these papers, the negative associations are interpreted as the effect of the “male breadwinner mentality” or gender norms. However, most of these studies do not provide explicit empirical evidence: only a small number papers tested the moderating effect of traditional values, and only two of them found partial support for it.
The contribution of our paper is threefold. First, previous studies used data mostly from Western Europe and from the USA, but evidence from Eastern Europe is still missing, although, it is special region regarding traditional gender norms and values (Inglehart and Norris, 2003;
Lück, 2005). Our results could reveal interesting evidence about the dynamics of intra-couple income distribution and subjective well-being in a more traditional social environment. Second, the moderating effect of gender norms on the individual level is rarely tested. In this study, we analyze whether the association between intra-couple income distribution and satisfaction is indeed different for those who prefer equal gender roles and those who prefer traditional gender roles. Third, we investigate how the type of relationship (cohabiting vs. marriage) changes the effect of the woman’s relative income.
Our paper is structured as follows. First, we review the previous literature (Section 2), then, we briefly describe gender attitudes and gender gaps in terms of education and labor force participation in Hungary (Section 3). In Section 4, we present the data and the estimation method. In Section 5, we show our results, and how gender norms moderate the results, and
3
lastly, we show the estimations in the subsamples of married and cohabiting respondents.
Section 6 concludes.
2. Theoretical background and literature
One of the well-known results of the literature is that one’s income compared to the income of others (relative income) is an important determinant of subjective well-being (Clark and Oswald, 1996; Ferrer-i-Carbonell, 2005; Luttmer, 2005; Clark, Kristensen and Westergård- Nielsen, 2009). Co-workers and friends are considered the most common reference groups, but partners can be seen as a special type of comparison group.
The main mechanisms that connect relative income and subjective well-being are the effect of social comparison, i.e. status effect (Veblen, 1899; Clark, Frijters and Shields, 2008) and the effect of providing information about future prospects, i.e. signal effect (Hirschman and Rothschild, 1973; Senik, 2005; Clark et al., 2009). However, regarding within family income comparison these mechanisms seem to be less important.
Becker (1981) describes task specialization within family as the key to optimized functioning and marital quality. In Becker’s view, task specialization provides the highest utility for the household. Although this theory is “gender neutral”, according to the traditional roles the man specializes in market work and earns income and the women responsible for the domestic work and is not active on the market. This means that task specialization, i.e. men’s income share supposed to be positively correlated with the partners’ satisfaction. Stevenson and Wolfers (2007), however, argue that technological improvements, the growing service sector, and the increase in women’s accumulation of human capital reduced the benefits from task specialization and increased women’s labor force participation. Therefore, the role of task specialization is less important in the twenty-first century. Instead, subjective well-being of the partners is influenced mainly by the prefered contributions to the household budget and by the
4
actual situation (Brennan, Barnett and Gareis, 2001; Ahn et al., 2014; Zhang, 2015; Bertrand et al., 2015).
First, the partners’ contribution to the household budget results in higher satisfaction as the own contribution might determine the proportion of private consumption, might indicate higher rewards of her/his work, and also can result in more bargaining power. Someone with higher relative income compared to his/her partner might get more recognition from others (including recognition for work), might use more resources of the household, and might have greater influence on the decisions of the household (Blood and Wolfe, 1960; Lundberg and Pollak, 1996; Phipps and Burton, 1998; Halleröd, 2005).1 Consequently, the own income share could indicate higher satisfaction.
Second, for our paper, it is more important that gendern norms might moderate the relationship between relative income and subjective well-being (Greenstein, 1995; Brennan et al., 2001; Zhang, 2015; Eirich and Robinson, 2017). Preferred intra-couple income distribution is shaped by attitudes regarding gender roles, but the actual income distribution may differ from the preferred one due to a number of constrains (e.g. labor market opportunities). The tension between the preferences and the economic reality could result in lower satisfaction, but there might be a substantial heterogeneity. Traditional norms prescribe that the man should earn more than the woman, whereas egalitarian gender role attitudes reject the male breadwinner–women homemaker model. It means that the woman’s economic contribution could have different consequences on the partners’ satisfaction depending on their gender norms.
Only a handful of papers analyze the effect of intra-couple income distribution on subjective well-being. They use domain satisfactions, e.g. financial satisfaction or marital
1 For example, Browning et al (1994) using a sample of Canadian couples showed that higher-income partners receive more of the expenditures of the household. (For similar analysis see also Lundberg, Pollak and Wales (1997) or Ward-Batts (2008).) Friedberg and Webb (2006) analyzed directly who has “the final say” when making major decisions among older (aged 50+) American couples. They found that decision-making power depends on relative earnings.
5
happiness, as outcome variables, and most of these papers take into account gender norms for the theoretical interpretation of the results, but they do not provide empirical evidence for its moderating effect.
The vast majority of research concentrates on the USA and Western-Europe. Using data of 11 Western-European countries, Bonke (2008) found that wives’ financial satisfaction increases with their relative earnings, whereas husbands’ financial satisfaction declines the more their wife earns. Only in the Scandinavian welfare states do both women and men prefer more or less egalitarian intra-household income distribution. Ahn, Ateca-Amestoy, and Ugidos (2014) have analyzed Spanish and Danish data concluding that Spanish women’s financial satisfaction decreases as their own contribution to the household income increases, but men are more satisfied the higher their own contribution is. They interpret the result as evidence of the male breadwinner mentality among Spanish men and women. On the other hand, regarding Denmark, where gender attitudes are more egalitarian, they have found that the effect of an individual’s share of labor income on financial satisfaction is positive for men and for cohabiting women.2
Using American data, Rogers and DeBoer (2001) have found that married women’s marital happiness and psychological well-being are higher, but married men’s psychological well-being is lower when women’s relative contributions to the family income are increased.
The authors conclude that “it is possible that the persistence of breadwinning expectations for men leads them to feel distress when women’s proportional contributions increase, regardless of their own ability to contribute resources” (Rogers and DeBoer, 2001, p. 470). Using American married couples Bertrand et al (2015), in turn, examined how the wife’s relative income affects marriage quality. They have found that couples where the wife earns more than the husband tend to rate their marriage less happy, are more likely to think that their marriage
2 They have found an insignificant effect for married women.
6
is in trouble, and are more likely to report that they have discussed separation over the past year. This behavior is consistent with the social norm that “a man should earn more than his wife” (Bertrand et al., 2015, p. 572).
Only a small number of papers provide explicit empirical analysis about the role of traditional values in the process of within-household income comparison. Furdyna, Tucker, and James (2008) analyzed the relationship between marital happiness and wife-to-husband income ratio in a sample of employed American wives. They found that the woman’s higher income was strongly associated with lower marital happiness among religious African American wives (taking religiosity as an indicator of traditional values) and also among white wives with traditional gender values, whereas in other groups the relationship was less negative or was insignificant. They interpret the results “as illustrative of the expectations held for male economic behavior in traditional conceptions of marriage and the discontent that ensues when such expectations are unfulfilled” (Furdyna et al., 2008, p. 341). On the other hand, Eirich and Robinson (2017) found that full-time working married American individuals are more satisfied with their family’s financial situation when they earn more money than their spouse – whether they are women or men. However, the authors have also found that traditional gender ideology does not moderate this association, and they conclude that social comparison processes (relative deprivation) can trump the traditional prescription of the male breadwinning role. Similarly, Brennan, Barnett and Gareis (2001) found no evidence that gender-role ideology moderates the relationship between women’s relative earnings and marital quality in a sample of dual-earner American couples. In a sample of Chinese wives, Zhang (2015) found that feminine role attitudes moderated the relationship between wives’ relative income and marital happiness. For wives with a low egalitarian feminine role attitudes, wives’ relative income was negatively related to marital happiness, whereas it was unrelated to marital happiness for respondent with
7
a high egalitarian feminine role attitudes. However, in this study the moderating effect of breadwinner role attitudes was not supported.
To sum up, a negative association between the women’s relative income and the indicators of subjective well-being for women was found only in countries where traditional gender norms are stronger (Zhang and Tsang, 2013; Ahn et al., 2014; Zhang, 2015) or in social groups with traditional values (Furdyna et al., 2008). In other samples, the results seem to show rather the effect of subjective and objective rewards of income (or the effect of social comparison processes).
Evidence on this topic from outside Western-Europe and North-America is scarce, despite the fact that gender norms and preferred gender roles are different in other regions and countries (Lück, 2005), which might have consequences on the effect of intra-couple income comparison on subjective well-being.3
3. Gender attitudes and gender gaps in Hungary
Compared to Europe, in Hungary the acceptance of traditional values and traditional gender roles is high (Lück, 2005; Pongrácz, 2006; Takács, 2008). The widespread prevalence of traditional roles is reflected by the fact that the Hungarian gap between the employment rates of women with and without children under 12 is among the highest in Europe4, i.e. it is women who tend to take care of children, which is in accordance with the traditional role specialization (European Commission, 2012, p. 37). The traditional attitudes can also be illustrated with the
3 Studies on the division of employment among partners are also related to our research. Only one study, focused explicitly on the effect of specialization and hours-equity and analyzed the moderating effect of gender role attitudes (Blom, Kraaykamp and Verbakel, 2017). It found that egalitarian gender attitudes led to a more positive association between hours-equity and satisfaction and to a more negative association between specialization equity and satisfaction for men. Other papers found mixed results regarding the effect of the division of employment on relationship satisfaction (Amato et al., 2003; Keizer and Schenk, 2012; Hardie, Geist and Lucas, 2014). All of these papers used data form Western Europe and the United States.
4 In 2010, the average gap was 12.1 percentage points in the EU-27, whereas the gap was 28.8 percentage points in Hungary.
8
data of the 2010 European Social Survey. In Hungary, average agreement with two statements regarding gender roles (“When jobs are scarce, men should have more right to a job than women”, “A woman should be prepared to cut down on her paid work for the sake of her family”) is among the highest in the 27 participating European countries. On a 5-point scale, 53.5% and 54.0% of Hungarians answered that they “agree” or “strongly agree” with the statements, respectively. In addition, a recent Eurobarometer survey found that Hungary has one of the highest scores on the “gender stereotype” and on the “gender stereotype in politics”
indices, indicating a strong tendency to stereotype based on gender (European Union, 2017).
These traditional attitudes seem to have been quite stable over the last twenty years.
According to International Social Survey Programme (ISSP) data, the agreement with the statement “A man's job is to earn money; a woman's job is to look after the home and family”
was similar in 1988 and 2012 (40.6% and 43.3%, respectively) and it was relatively high compared to other European countries.
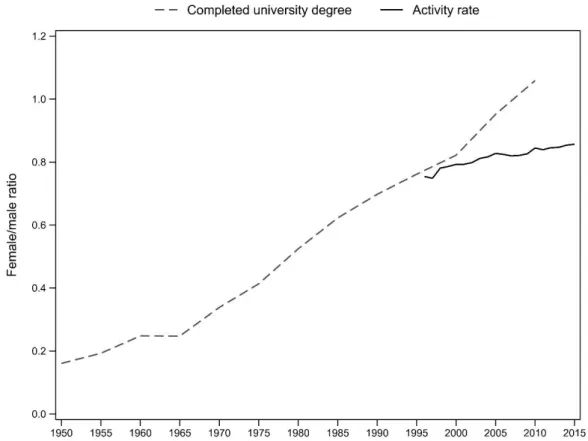
On the other hand, the economic reality seems to be (at least partially) contradicting the gender attitudes. The gender wage gap decreased between 1986 and 2003 in Hungary (Lovász, 2010). Men’s and women’s labor market participation rates and their education level were becoming increasingly similar over the 20th century. Figure 1 depicts the historical educational differences between women and men between 1950 and 2010 and activity rate differences between 1996 and 2015. In 1950, men were six times more likely to have a university degree than women; while in the 2000s the female/male gap diminished and in 2010 women have more university degrees than men. Between 1996 and 2015, the ratio of activity rate of women and men in the 25-59 age group increased from 0.75 to 0.86, which means that the female/male activity gap decreased by 15 percent. In sum, in Hungary women’s educational levels, skills and economic activity are close or similar to those of men.
9
Figure 1: Female/male ratio of completed university degree and activity rate
Dashed line: Female/male ratio of completed university degree (individuals above age 25), 1950-2010. Source:
authors’ calculation based on data of Barro and Lee (2013).
Solid line: female/male ratio in activity rate (individuals aged 25-59), 1996-2015. Source: authors’ calculation based on data of Eurostat (http://appsso.eurostat.ec.europa.eu/nui/show.do?dataset=lfsa_argan&lang=en).
The tension between gender attitudes and the economic reality is reflected in data from European Institute for Gender Equality’s (EIGE) Gender Equality Index Report (European Institute for Gender Equality, 2013). While traditional attitudes in Hungary are among the strongest in Europe, gender gap indicators related to labor force, the economy and education are around or below average in Hungary. For example, Hungary is below the EU-27 average and has the median value (the 14th position) regarding the gender gap in average monthly earnings. The country is also below the EU-27 average and in the lowest third among the EU- 27 countries regarding the gender gap in full-time equivalent participation in labor force, in the representation on boards of the largest companies, and in the representation in the central bank’s decision-making body. The gender gap in Hungary regarding the number of those with tertiary
10
education is also below average and has the median value among the EU-27. Klesment and Van Bavel (2015), using EU-SILC data, report that the share of women aged 25-45 years with a
„breadwinning role” (she earns 51-100% of the couple income) ranges from 14.5% to 33.9% in Europe with an average of 21.9%. In Hungary, 23.4% of the women earn more than their partners that places the country 11th out of 27 countries.
Using data from ISSP 1994, Lück (2005) provides additional evidence showing that in Eastern-Europe support for traditional gender roles and for female employment is high, which can be explained by economic necessities and the experience of socialism, that enforced female labor force participation. To sum up, it seems that Eastern-Europe (and Hungary) can be regarded as a special region where a significant group of people experience tensions between preferred gender roles and the economic reality, or between the cultural and structural phenomena of breadwinning (Zuo, 2004). This is also reflected in a “gender yo-yo effect”, where women are subjecting “to contradictory normative expectations about their ‘natural’
roles, while dragging them back and forth between work and home” (Takács, 2013, p. 200).
4. Data and empirical strategy
4.1. Data
Our analysis is based on the panel survey Turning Points of the Life Course conducted by the Hungarian Demographic Research Institute (HDRI). We use the second wave of the survey (2004-2005) since only this wave includes variables measuring both life satisfaction and income of the respondent’s partner.
In this survey, subjective well-being was measured with a global, single-item question about life satisfaction on an 11-point scale (ranging from 0 to 10): “How satisfied are you with the way your life’s worked out up till now?” Income of the respondent, income of her/his partner, and household income were measured also with single questions (“On the average what
11
is your monthly net income / the monthly net income of your spouse or partner?” and “What is the combined average monthly net income of your household?”).
The initial sample size is 13,542. We exclude respondents who did not have a partner (4,657 observations) or lived with a same-sex partner (3 observations). Respondents with missing life satisfaction and income variables are also excluded (26 and 842 observations, respectively). We also exclude respondents with partners below age 21 or above age 79 (142 observations). Two observations are excluded because of missing sampling weight variable.
The final sample size is 7,870.
Intra-couple income distribution is measured with the woman’s share in the couple’s total income (woman’s relative income):
M i W i
W i
i I I
WRI I
= + ,
where IiW is the woman’s total monthly net income, IiM is the man’s total monthly net income. WRIi is the woman’s relative income for individual i. If individual i is male, WRIi measures his partner’s share in his and his partner’s total income; if individual i is female, WRIi
measures her share in her and her partner’s total income. WRIi takes the value 0 if only the man has an income; it takes the value 1 if only the woman has an income; and it takes the value 0.5 if individual incomes are equal.
The mean of WRI is 0.414, and it is similar for female (0.418) and male (0.411) respondents. 33.0% of the respondents report that WRI is at least 0.5, and 21.2% report that the woman has higher income than her partner. Figure 2 shows the distribution of the variable.
12 Figure 2: The distribution of women’s relative income
4.2. Empirical strategy
We estimate a linear relationship between the woman’s relative income and satisfaction, using the following specification:
i i M
i i W
i i
i WRI D WRI D
S =
0 +
1 +
2 +
3X +
,where Si is the life satisfaction of individual i, WRIi denotes the woman’s relative income for individual i, DiW and DiM are indicator variables that take the value 1 for women and men, respectively.
X
i is a vector of the personal characteristics of individual i.5We focus on coefficients 1 and 2 that show the relationship between the woman’s share in the couple’s total income and life satisfaction for women and men, respectively. A negative 1 or 2 coefficient indicates that the higher the woman’s relative income, the lower
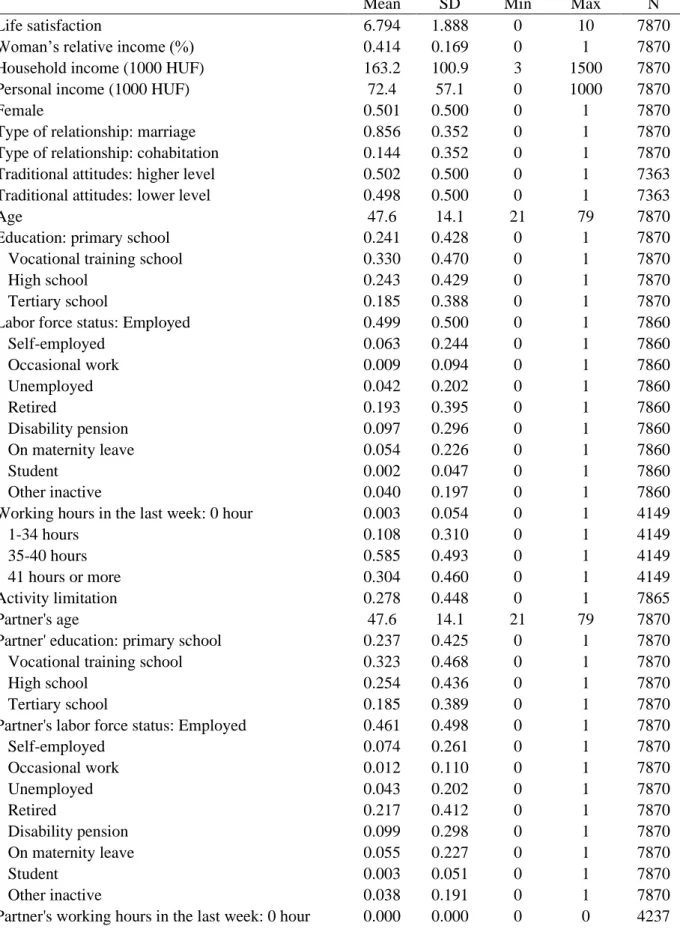
5 Summary statistics of these variables are shown in Table A1 in the Appendix.
13
the life satisfaction of the female or male member of the couple. Positive coefficients indicate reversed correlation.
The omitted variable bias could be a potential problem in our estimation, since the woman’s relative income correlates with several characteristics of the respondent and the household that might influence life satisfaction (e.g. health status of the household members, absolute income level, working hours).6 To address this endogeneity concern, in our models we use a rich set of control variables. These variables include the individual characteristics of the respondent’s and the partner’s: age, squared age, health status, education, labor force status, and working hours in the last week, as well as the respondent’s sex and personal total monthly net income. In addition, we control for other characteristics of the household: the household’s monthly net income, the number of adult household member (in addition to the respondent and her/his partner), the number of household members under aged 0-3, the number of household members under aged 4-17, indicators for health problems of other household members, arrears on utility bills in the last 12 months, flat size (square meters in a logarithmic form), and settlement type.
After controlling these variables, 1 and 2 reflect (i) the effect of subjective and objective rewards of income (e.g. recognition of others, personal advantages, consumption opportunities in the household), and (ii) the effect of failure or success of the fulfilment of the prescribed gender roles. The former effect depends on the personal contribution to the household budget, i.e. the partner who contributes more might use more resources of the household, or might have greater influence on the decisions of the household (Lundberg and
6 For example, respondents living in households where WRI is at least 0.5, i.e. the woman has equal or higher income than her partner, are more likely to have financial problems than respondents living in households where the man’s contribution is higher. They are more likely to have arrears on utility bills (17.5% vs. 13.2%, p=0.000), and report more often to have difficulties making ends meet (16.4% vs. 12.5%, p=0.000). In these households, the male partner is also more likely to have health problems (22.8% vs. 18.6%, p=0.000), and is more likely to be unemployed (10.3% vs. 0.9%, p=0.000).
14
Pollak, 1996; Phipps and Burton, 1998; Halleröd, 2005). Thus, the coefficient on the woman’s relative income is supposed to be positive for women and negative for men. On the other hand, traditional norms prescribe that the man should earn more than the woman. Evidently, these norms shape the intra-couple income distribution, however, the realized income distribution may differ from the preferred one due to a number of constrains. If a woman’s relative income is high, these traditional norms are violated (Furdyna et al., 2008), and the tension between the preferences and the economic reality could result in lower satisfaction. In this case the coefficient on the woman’s relative income is supposed to be negative both for women and men. In sum, 1 reflects the negative effect of gender norms and the positive effect of own income for women, whereas 2 reflects the negative effect of gender norms and the negative effect of the woman’s income for men.7 It means that if the point estimations of 1 and 2 are negative, we can interpret the results as the effect of preferred traditional gender roles.
We estimate OLS regressions. Weights provided by the HDRI are used to adjust for the unequal inclusion probabilities. The standard error estimates are robust to heteroscedasticity.
5. Results
Figure 3 shows the bivariate relationship between women’s relative income and life satisfaction for women and men.8 In both groups, life satisfaction decreases the higher the woman’s share in the couple’s total income. For men, if the woman’s relative income is above 0.5, i.e. when the woman’s income is higher than the man’s, the relationship is steeper. The negative correlation for women suggests that we might explain the results with the expectations about
7 Since we control for the effect of individual income (similar to Bertrand, Kamenica and Pan (2015)), we suppose that the effect of gender roles is stronger than the effect of personal power, advantages, and consumption opportunities. Moreover, since women do not seem to gain the same advantages from earnings that men do (Steil and Weltman, 1991; Tichenor, 1999), we can also assume that the effect of personal power, advantages, and consumption opportunities is weaker for women than men.
8 Non-parametric regressions using the lpoly function of Stata.
15
gender roles. If the woman’s income exceeds her husband’s, this might cause distress and conflicts.
Figure 3: Life satisfaction and women’s relative income
Note: Non-parametric regressions
The results of the regressions are shown in Table 1. Model 1 includes only the woman’s relative income and the respondent’s sex as right-hand side variables. In this model, coefficients on the woman’s relative income are negative. The coefficient is larger in absolute terms for male respondents than for female respondents – in accordance with the results of Figure 2.
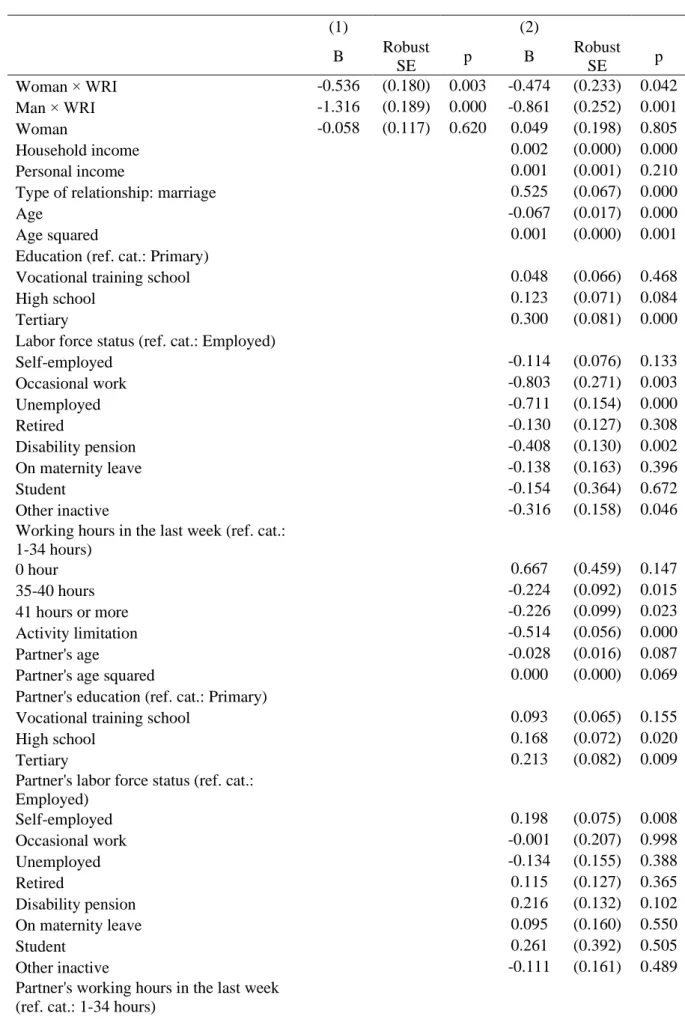
Model 2 includes the control variables.9 After controlling for the respondent’s characteristics, partner’s characteristics, household’s characteristics, the woman’s relative income correlates negatively with life satisfaction both for men and women. The estimated coefficient is −0.861 for male respondents, and −0.474 for female respondents. This means that if we compare two men with one standard deviation above and below men’s average income share (75% vs. 40%),
9 The detailed results are shown in Table A2 in the Appendix.
16
then we obtain a 0.30 point satisfaction difference.10 A similar comparison of two women with a 25% and 60% income share yields a 0.17 point difference.11
It is worth noting that the woman’s relative income correlates negatively with life satisfaction not only for men but also for women, in contrast to results from West-European and American samples (Rogers and DeBoer, 2001; Bonke, 2008; Ahn et al., 2014). However, our results are similar to those obtained in countries where traditional gender norms are stronger (Zhang and Tsang, 2013; Ahn et al., 2014).
Table 1: Life satisfaction and women’s relative income
(1) (2)
B Robust
SE p B Robust
SE p
Woman × WRI -0.536 (0.180) 0.003 -0.474 (0.233) 0.042
Man × WRI -1.316 (0.189) 0.000 -0.861 (0.252) 0.001
Controls No Yes
Adjusted R2 0.012 0.173
N 7870 7870
Dependent variable: Life satisfaction. WRI: Woman’s relative income. Controls: personal income; household income;
respondent’s sex, age, squared age, education, labor force status, working hours in the last week, health problems; partner’s age, squared age, education, labor force status, working hours in the last week, health problems; number of household members aged 0-3; number of household members aged 4-17; number of adult household members; health problems of other household members; type of relationship; flat size (in logarithmic form); arrears on utility bills in the last 12 months; settlement type.
Dummies are included for missing regressors.
Since our regression model includes the most important characteristics of the partners and the household, in accordance with the previous literature (Rogers and DeBoer, 2001;
Furdyna et al., 2008; Ahn et al., 2014) we can interpret the negative coefficients as the impact of traditional gender norms, i.e. as the impact of the prescription that a man should earn more than his partner. These traditional norms imply that the higher the woman’s economic
10 If the relative incomes are 75% and 40%, the women’s relative incomes (WRI) are 25% and 60%, respectively.
Therefore, the satisfaction difference is (0.25 − 0.60) × −0.861 = 0.30.
11 The difference is (0.25 − 0.60) × −0.474 = 0.17.
17
contribution the more the man’s breadwinning role is questioned which leads to lower life satisfaction.
5.1. Robustness of the results
Next, we test the robustness of the estimations. On the one hand, we use restricted (more homogeneous) samples, additional controls and alternative estimation methods (Table 2), on the other hand, we allow a non-linear association between life satisfaction and the woman’s relative income (Figure 4).
The results obtained from the restricted samples are shown in Table 2. Row 1 includes observations where both the respondents and their partners have positive incomes. Then, we restrict the sample to 25-60 year-old respondents with 25-60 year-old partners (Row 2). The next model includes observations where both the respondents and their partners are 25-60 year- old and have positive incomes (Row 3). In Row 4, we add a more extensive set of control variables. The model includes additional controls for characteristics related to financial situation of the household. We also add a variable measuring how housework is divided between the partners, since several studies find that women who earn more than their partners
“do gender”, i.e. there is a curvilinear relationship between woman’s relative income and housework for women (e.g. Brines, 1994; Bittman et al., 2003; Schneider, 2011) which might explain the negative coefficient among women in the main model (Mencarini and Sironi, 2012).
Variables controlling for fertility history (number of children the respondent has) and fertility intentions, and controlling for outsourcing of child care and housework are also included since these variables might be correlated both with life satisfaction and women’s relative income.
Next, we estimate the same model separately for women and for men (Row 5 and Row 6). With these specifications, we allow that the control variables have different coefficients by sex of the respondents. In every model, the main coefficients have similar signs and similar magnitudes
18
to the results reported in Table 1. However, most of the estimations are less precise because of the smaller sample sizes.
In Row 7, we estimate an ordered logit model rather than OLS. We also estimate a Probit-adapted OLS (POLS) model (van Praag and Ferrer-i-Carbonell, 2008) that considers the categorical life satisfaction variable as ordinal, and cardinalizes it by assuming that satisfaction is normally distributed. Using the cardinalized satisfaction variable, a standard OLS estimation can be applied (Row 8). The overall conclusion of this exercise is that the association of the woman’s relative income with life satisfaction is not altered by the alternative estimation methods.12
12 The estimated coefficients of the POLS method have a smaller magnitude because the variance of the cardinalized satisfaction variable is half the variance of the original variable.
19 Table 2: Life satisfaction and women’s relative income, robustness analyses
Woman × WRI Man × WRI
B SE p B SE p Adjusted R2 N
(1) Both partners have positive income -0.472 (0.272) 0.083 -0.890 (0.285) 0.002 0.175 7493
(2) Age: 25-60 -0.494 (0.264) 0.062 -0.908 (0.294) 0.002 0.200 5433
(3) Both partners have positive income, age:
25-60 -0.539 (0.316) 0.088 -0.783 (0.337) 0.020 0.204 5132
(4) With additional controls -0.483 (0.228) 0.035 -0.826 (0.247) 0.001 0.187 7870
(5) With additional controls, only women -0.498 (0.272) 0.067 - - - 0.169 4134
(6) With additional controls, only men - - - -0.770 (0.299) 0.010 0.200 3736
(7) Ordered logit -0.493 (0.253) 0.051 -0.904 (0.273) 0.001 0.049a 7870
(8) Probit-adapted OLS -0.245 (0.121) 0.043 -0.431 (0.129) 0.001 0.167 7870
Dependent variable: Life satisfaction. Robust standard errors are in parentheses. WRI: Woman’s relative income. All regressions include the same control variables as in Table 1. Additional controls in Row 4-6: household asset index (in logarithmic form), number of rooms in the flat (in logarithmic form), division of housework, division of housework × woman, fertility intentions, number of children of the respondent, the household make use of day care center or babysitter, the housework is (at least partially) done by someone not living in the household. Dummies are included for missing regressors.
a Pseudo R2
20
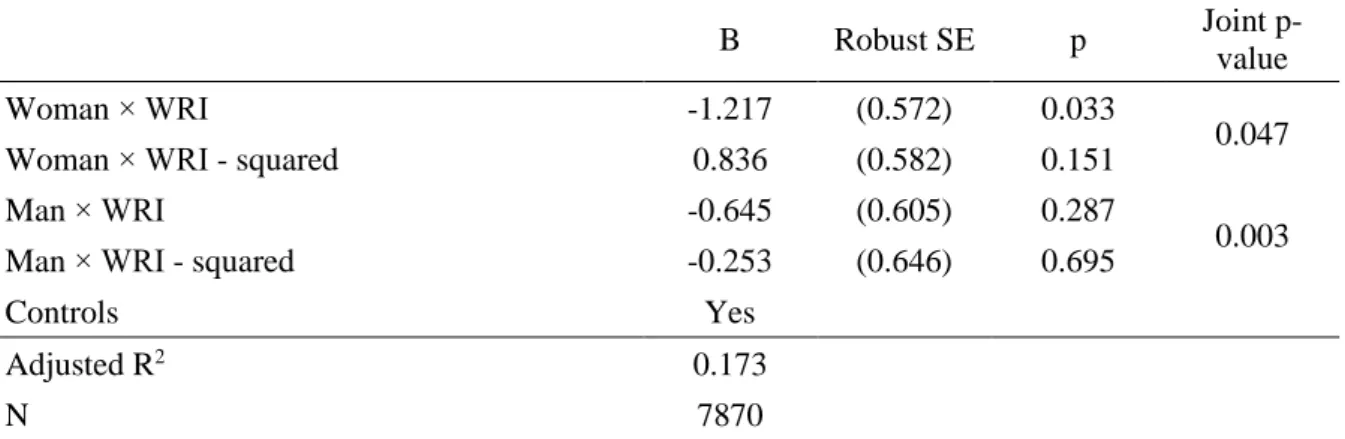
Next, we test whether the results remain similar if we allow the relationship between life satisfaction and the woman’s relative income to be non-linear. For example, if equal contribution is preferred, then we should observe a reverse U-shaped relationship. We check this in two ways. First, we include squared terms for the woman’s relative income in the models.
Second, we replace the original variable with ten categorical variables: they indicate if the woman’s relative income is between 0.0 and 0.1, 0.1 and 0.2, … 0.9 and 1.0. Figure 4 depicts the results.13 Allowing non-linear effects does not change the main conclusion: life satisfaction of both women and men is lower when the woman’s relative income is higher, and we do not observe a strong reverse U-shaped relationship. These results suggest that the relationship between woman’s relative income and satisfaction is close to linear.14
Figure 4: Woman’s relative income by respondents’ sex
13 Detailed results are in Table A3 and Table A4 in the Appendix.
14 Nevertheless, we also estimate a regression model with binary variables indicating that the woman’s relative income is at least 0.5. This estimation yields identical conclusions to the main model.
21 5.2. Heterogeneity
5.2.1. Preferred gender norms
If our interpretation is correct and the negative coefficients on the woman’s relative income is mainly caused by the impact of traditional gender norms, then the estimated coefficients should be stronger for those who prefer traditional gender roles and should be weaker (or even zero or positive) for those who prefer egalitarian gender roles. The moderating effect of traditional values has rarely been tested in the literature. Nevertheless, most papers that have found that the woman’s relative income had a negative effect interpreted these results as the effect of the male breadwinner mentality (e.g. Rogers and DeBoer, 2001; Bertrand et al., 2015).
To test the moderating effect of gender norms, we split the sample into two groups by gender values. We construct a variable that measures preference for traditional gender roles, using respondents’ agreement with the following five statements:
1. Overall, men make better political leaders than women.
2. A pre-school child is likely to suffer if his/her mother works.
3. If parents get divorced, it is better for the child to stay with the mother than with the father.
4. When jobs are scarce, men should have more right to a job than women.
5. Working for pay should be more important for the man, while looking after the home and children should be more important for the woman, even if both have jobs.
Respondents were asked to indicate their agreement with the first four statements on a 5-point scale (from 1 – ‘strongly disagree’ to 5 – ‘strongly agree’) and with the fifth statement on a 3-point scale (‘disagree’, ‘neither agree nor disagree’, or ‘agree’). The measure of attitudes toward gender norms is created as a principal component of these five variables.15 Then using
15 The results are similar when the variable is calculated as the mean of the five variables.
22
this new variable, we divide the sample into two groups: respondents above the average, who prefer more traditional gender norms, and respondents with below average traditional gender attitudes.16
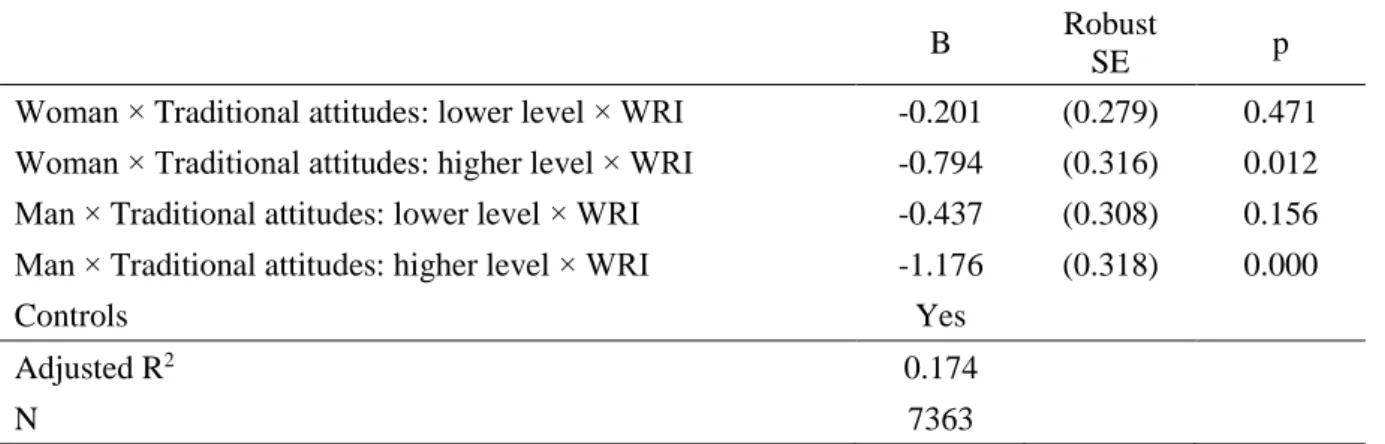
We regressed life satisfaction on the woman’s relative income interacted with the respondent’s sex and the indicator variables of the two gender norm groups.17 Table 3 reports the results. The estimated coefficient for women with below average traditional attitudes is close to zero (−0.201), whereas the coefficient for men with below average traditional attitudes is considerably smaller than in the whole sample (−0.437). For respondents with traditional gender attitudes, the estimated coefficients are considerably higher: −0.794 for women, and
−1.176 for men. These coefficients are significantly higher in absolute terms than coefficients for respondents with below average traditional gender attitudes both for women and men (p- values on the test of equal coefficients are 0.091 and 0.038, respectively).
These results confirm that preferred gender norms indeed play an important role in the explanation of the negative correlation between the woman’s relative income and life satisfaction. The woman’s relative income and life satisfaction correlate negatively primarily for those who prefer traditional gender roles; however, there are zero or negative but insignificant correlations for those with more equal gender norms. Our results corroborate the finding of Furdyna et al. (2008), who showed that dissatisfaction among those with traditional conceptions of gender role ensues when traditional male breadwinning expectations are unfulfilled.
16 We have decided to use this cut point to have a sufficient number of observations in both groups. The cut point is 3.45 on the original 1 to 5 scale.
17 Technically, the regression model consists of four three-way-interaction terms, the main effects of the sex of the respondent and the gender norm groups (two dummy variables), and the two-way interactions between the latter two variables (one interaction term). The direct effect of women’s relative income is excluded – as from the main model above. The four three-way-interaction terms measure the effect of women’s relative income for those women and men who prefer more equal gender roles, among those women and men who prefer more traditional gender roles. This specification is identical to a specification that consists of a three-way-interaction term and all the possible two-way-interaction terms and the three main effects. The advantage of our specification is that the four coefficients/effects and their significance we are interested in are presented without any additional calculation.
23
Table 3: The moderating effect of preferred gender roles
B Robust
SE p
Woman × Traditional attitudes: lower level × WRI -0.201 (0.279) 0.471 Woman × Traditional attitudes: higher level × WRI -0.794 (0.316) 0.012 Man × Traditional attitudes: lower level × WRI -0.437 (0.308) 0.156 Man × Traditional attitudes: higher level × WRI -1.176 (0.318) 0.000
Controls Yes
Adjusted R2 0.174
N 7363
Dependent variables: Life satisfaction. Robust standard errors are in parentheses. WRI: Woman’s relative income. Controls:
same control variables as in Table 1, and additional control variables: gender role attitudes, respondent’s sex × gender role attitudes. Dummies are included for missing regressors, except of gender role attitudes.
5.2.2. Type of relationship
There is evidence from previous research that cohabiters are less committed to their relationship and to their partner than married people (Nock, 1995; Smock, 2000; Stanley, Whitton and Markman, 2004). Thomson and Colella (1992) found that cohabiters define marriage individualistic rather than in couple terms (see also Rosenblatt and Budd, 1975). In a sample of Chinese married women, Zhang and Tsang (2013) found that women married to a husband with a lower income were less happy with their marriage than women married to a husband with a higher or equal income. However, this result is moderated by being more strongly committed to the relationship. Among those with higher commitments, there was no correlation between the woman’s relative income and marital happiness, whereas among those with lower commitments there was a negative correlation. They argue that a relation-oriented exchange model might explain the results. According to this model partners see themselves as a “mutually dependent dyad whose personal interests may be closely identified with the collective well- being” (p. 1577). Those who are more committed to their relationship consider not only the economic contributions to the marriage, but also the global contribution by their partner.
24
In this section, we test whether the effect of the woman’s relative income differs for cohabiting and married people. Weaker “couple identity” , i.e. the partners are less likely to think of “the relationship as a team, in contrast to viewing it as two separate individuals”
(Stanley and Markman, 1992, p. 596), might enhance the effect of preferred gender norms. On the other hand, higher commitment or stronger “couple identity” might make the source of household income less important. It is also possible that married women are more sympathizing when their partner’s ability to contribute resources is limited which has positive consequences on the satisfaction of both the female and the male partner. If commitment to the relationship and to the partner indeed tends to “overwrite” the effect of traditionally prescribed gender roles (and the effect of personal power, advantages, and consumption opportunities), then the estimated coefficients should be higher (i.e. negative but closer to 0, or positive) for married people. We examine this heterogeneity by regressing life satisfaction on the woman’s relative income in subsamples of married and cohabiting respondents.18
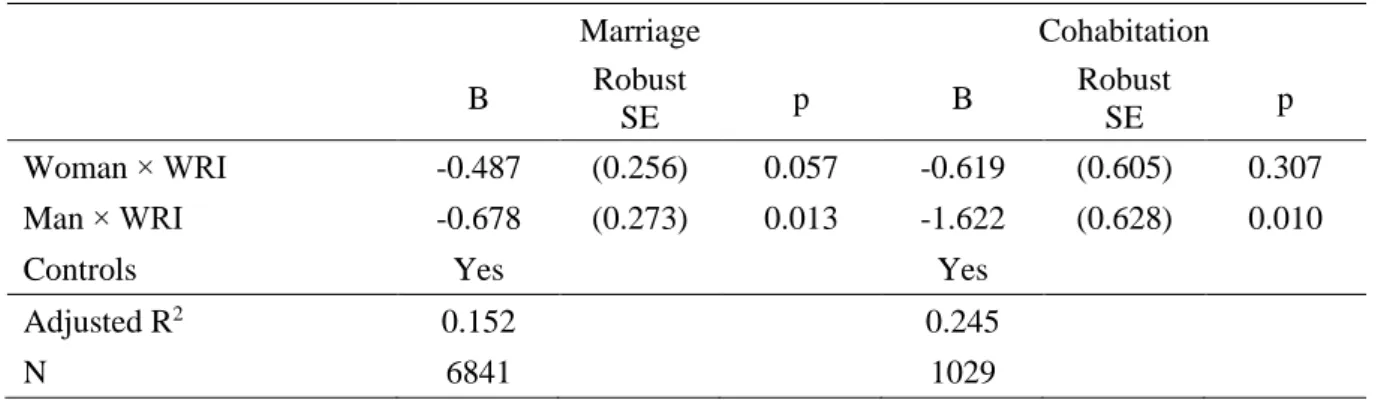
Table 4 presents the results. The estimated coefficient on the woman’s relative income is −0.487 for married women, and −0.678 for married men. The coefficients are significant at the 10 percent and at the 5 percent level, respectively. For cohabiting respondents, satisfaction correlates more negatively with the woman’s share in the couple’s total income: the estimated coefficients are −0.619 and −1.622 for women and men, respectively, however because of the smaller sample size, the estimations are less precise, and only the latter is statistically significant.19
18 One can also reasonably assume that gender norms of married respondents are more traditional than those of cohabiters. However, in our sample the difference between the two groups is small. The mean of the principal component measuring traditional gender norm (rescaled to the original 1-5 scale) is 3.48 among the married and 3.30 among the cohabiters.
19 Due to the large standard errors, the coefficients do not differ statistically between married and cohabiting respondents.
25
These results suggest that personal commitment might moderate the relationship of women’s relative income and life satisfaction. Higher commitment or stronger “couple identity” might eliminate in some degree the effect of the traditional gender roles. The lower coefficients for married respondents also fit well into the literature about the protective characteristics of marriage (Ross, Mirowsky and Goldsteen, 1990; Wilson and Oswald, 2005;
Rendall et al., 2011).20
Table 4: Life satisfaction and women’s relative income by type of relationship
Marriage Cohabitation
B Robust
SE p B Robust
SE p
Woman × WRI -0.487 (0.256) 0.057 -0.619 (0.605) 0.307
Man × WRI -0.678 (0.273) 0.013 -1.622 (0.628) 0.010
Controls Yes Yes
Adjusted R2 0.152 0.245
N 6841 1029
Dependent variable: Life satisfaction. Robust standard errors are in parentheses. WRI: Woman’s relative income. Controls:
same control variables as in Table 1. Dummies are included for missing regressors.
Next, we analyze the moderating effect of preferred gender roles by type of relationship.
We run similar models as in Table 3 for the subsamples of married and cohabiting respondents.
Table 5 shows the results of this exercise. The general pattern is similar to the patterns above.
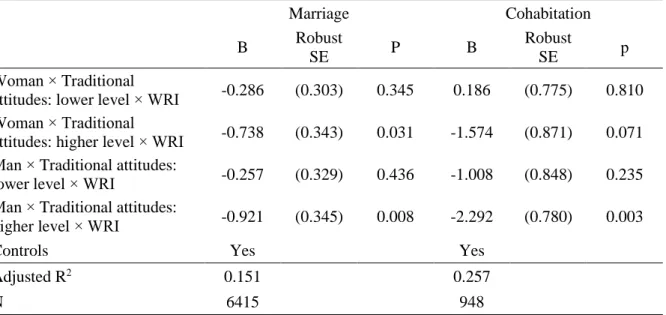
Coefficients for those with high levels of traditional attitudes are more negative than for those with low levels of traditional attitudes, and coefficients for cohabiters are more negative than for married people. For respondents with traditional values, the coefficients on the woman’s relative income are large in general, and are larger in absolute terms for cohabiters than for married people (−1.574 vs. −0.738 for women, and −2.292 vs. −0.921 for men). For respondents
20 There are alternative explanations. It is possible that cohabiters prefer one-earner families. Cohabiters might respond less supportively to the man’s (relative) income disadvantages. It is also possible that cohabiters care more for intra-couple income distribution, i.e. they are more likely than married people to compare their income to their partners’ income. However, these alternative explanations – especially the latter two – are related to the main explanation.
26
with low levels of traditional attitudes, estimated coefficients are close to zero and are insignificant (−0.286 for married women, 0.186 for cohabiting women, and −0.257 for married men). Only the coefficient for cohabiting men was negative but insignificant (−1.008). The larger negative coefficient in this group might be explained by the fact that this coefficient – beside the effect of failure or success of fulfilment of prescribed gender roles – also reflects the effect of personal power, advantages, and consumption opportunities, that are supposed to be negative for men.
Table 5: The moderating effect of preferred gender roles by type of relationship
Marriage Cohabitation
B Robust
SE P B Robust
SE p
Woman × Traditional
attitudes: lower level × WRI -0.286 (0.303) 0.345 0.186 (0.775) 0.810 Woman × Traditional
attitudes: higher level × WRI -0.738 (0.343) 0.031 -1.574 (0.871) 0.071 Man × Traditional attitudes:
lower level × WRI -0.257 (0.329) 0.436 -1.008 (0.848) 0.235 Man × Traditional attitudes:
higher level × WRI -0.921 (0.345) 0.008 -2.292 (0.780) 0.003
Controls Yes Yes
Adjusted R2 0.151 0.257
N 6415 948
Dependent variables: Life satisfaction. Robust standard errors are in parentheses. WRI: Woman’s relative income. Controls:
same control variables as in Table 1, and additional control variables: gender role attitudes, respondent’s sex × gender role attitudes. Dummies are included for missing regressors, except of gender role attitudes.
6. Limitations
This paper has a number of limitations. First, the income data are not ideal since they were measured with single questions. Second, due to the lack of dyadic data respondents were asked about their partner’s income which may be biased. Prefered contributions to the household budget might influence the reported income of the partner. However, it worth to note that there is no difference in WRI by respondent’s sex which suggest that reporting bias is not a serious
27
problem. Third, using cross-sectional data we are not able to establish a causal relationship between the woman’s relative income and life satisfaction. While we use a rich set of control variables and show empirically that gender norms can explain the negative coefficients, longitudinal data would be needed to estimate causal effects.
7. Summary
Using nationally representative data from Hungary, we have examined the association between intra-couple income distribution and subjective well-being. On the one hand, in Hungary the acceptance of traditional values and the prevalence of traditional gender roles are high compared to Europe. On the other hand, the support for female employment, labor force participation and relative education of women is also (relatively) high, providing some tension between attitudes and the economic reality, or in other words between the cultural and structural sides of equality between women and men.
We have shown that the association between the woman’s relative income (the woman’s share of the couple’s total income) and life satisfaction is negative for both men and women.
Because we control for financial disadvantages on the individual and household level, the socio- economic and job characteristics of the respondent and their partner, we can interpret the results as the impact of traditional gender roles and the widespread prevalence of the traditional male breadwinner mentality in Hungary. The higher the woman’s economic contribution the more the man’s breadwinning role is questioned, which leads to lower life satisfaction. These results are in line with the findings of previous research based on data from countries with traditional gender norms (Zhang and Tsang, 2013; Ahn et al., 2014).
We have shown that gender norms moderate the negative association. For those with low levels of traditional gender attitudes, the woman’s relative income is not or only moderately associated with life satisfaction, whereas for those who prefer traditional gender roles, the
28
negative association is much stronger. This finding supports the interpretation that gender norms explain the negative coefficients. Respondents with traditional values might feel distress and dissatisfaction when a woman’s proportional contribution increases and the man’s breadwinning role is questioned.
Comparing married and cohabiting respondents, we have found significant differences between the effects of the woman’s relative income. The coefficients were larger in absolute terms for cohabiting respondents, which suggests that personal commitment might moderate the effect.
Tension between gender norms and the economic reality is likely to be growing in the future, unless there is a substantial change in gender norms. The implications of our results relate to this tension. First, our paper might contribute to understanding why Eastern Europeans (Sanfey and Teksoz, 2007; Guriev and Zhuravskaya, 2009), and more specifically Hungarians are dissatisfied (Lelkes, 2006; Helliwell et al., 2015). Our results suggest that the widespread prevalence of traditional gender norms in the region contributes to this dissatisfaction. Second, there is evidence to suggest that over time a counter-normative gender structure (i.e. dual-earner households or strong breadwinning role of women) could induce changes in attitudes (Zuo, 2004), and qualitative results show that tension-free family life arrangements could be produced in families where the main breadwinner is the woman even in Hungary (Neményi and Takács, 2016). However, our results imply that espousing egalitarian attitudes regarding gender roles and breaking down gender stereotypes might be necessary or even essential to increase subjective well-being.
29 References
Ahn, N., Ateca-Amestoy, V. and Ugidos, A. (2014) Financial Satisfaction from an Intra- Household Perspective. Journal of Happiness Studies, 15, 1109–1123.
Alesina, A., Di Tella, R. and MacCulloch, R. (2004) Inequality and happiness: are Europeans and Americans different? Journal of Public Economics, 88, 2009–2042.
Amato, P.R., Johnson, D.R., Booth, A. and Rogers, S.J. (2003) Continuity and Change in Marital Quality Between 1980 and 2000. Journal of Marriage and Family, 65, 1–22.
Barro, R.J. and Lee, J.W. (2013) A new data set of educational attainment in the world, 1950–
2010. Journal of Development Economics, 104, 184–198.
Becker, G.S. (1981) A Treatise on the Family. Harvard University Press, Cambridge, MA.
Bertrand, M., Kamenica, E. and Pan, J. (2015) Gender Identity and Relative Income within Households. The Quarterly Journal of Economics, 130, 571–614.
Bittman, M., England, P., Sayer, L., Folbre, N. and Matheson, G. (2003) When Does Gender Trump Money? Bargaining and Time in Household Work. American Journal of Sociology, 109, 186–214.
Blom, N., Kraaykamp, G. and Verbakel, E. (2017) Couples’ Division of Employment and Household Chores and Relationship Satisfaction: A Test of the Specialization and Equity Hypotheses. European Sociological Review, 33, 195–208.
Blood, R.O. and Wolfe, D.M. (1960) Husbands and Wives. Free Press, Glencoe, IL.
Bonke, J. (2008) Income distribution and financial satisfaction between spouses in Europe.
Journal of Socio-Economics, 37, 2291–2303.
Brennan, R.T., Barnett, R.C. and Gareis, K.C. (2001) When She Earns More than He Does: A Longitudinal Study of Dual-Earner Couples. Journal of Marriage and Family, 63, 168–
182.
Brines, J. (1994) Economic Dependency, Gender, and the Division of Labor at Home. American Journal of Sociology, 100, 652–688.
Browning, M., Bourguignon, F., Chiappori, P.-A. and Lechene, V. (1994) Income and Outcomes: A Structural Model of Intrahousehold Allocation. Journal of Political Economy, 102, 1067–1096.
Card, D., Mas, A., Moretti, E. and Saez, E. (2012) Inequality at Work: The Effect of Peer Salaries on Job Satisfaction. American Economic Review, 102, 2981–3003.
Clark, A.E., Frijters, P. and Shields, M.A. (2008) Relative Income, Happiness, and Utility: An Explanation for the Easterlin Paradox and Other Puzzles. Journal of Economic Literature, 46, 95–144.
Clark, A.E., Kristensen, N. and Westergård-Nielsen, N. (2009) Job Satisfaction and Co-worker Wages: Status or Signal? The Economic Journal, 119, 430–447.
30
Clark, A.E. and Oswald, A.J. (1996) Satisfaction and comparison income. Journal of Public Economics, 61, 359–381.
D’Ambrosio, C. and Frick, J.R. (2012) Individual Wellbeing in a Dynamic Perspective.
Economica, 79, 284–302.
Diener, E., Lucas, R.E., Schimmack, U. and Helliwell, J.F. (2009) Well-Being for Public Policy.
Oxford University Press, New York.
Dolan, P. and White, M.P. (2007) How Can Measures of Subjective Well-Being Be Used to Inform Public Policy? Perspectives on Psychological Science, 2, 71–85.
Eirich, G.M. and Robinson, J.H. (2017) Does Earning More Than Your Spouse Increase Your Financial Satisfaction? A Comparison of Men and Women in the United States, 1982 to 2012. Journal of Family Issues, 38, 2371–2399.
European Commission. (2012) Progress on Equality between Women and Men in 2011.
Publications Office of the European Union, Luxembourg.
European Institute for Gender Equality. (2013) Gender Equality Index Report.
European Union. (2017) Special Eurobarometer 465. Gender Equality 2017.
Ferrer-i-Carbonell, A. (2005) Income and well-being: an empirical analysis of the comparison income effect. Journal of Public Economics, 89, 997–1019.
Friedberg, L. and Webb, A. (2006) Determinants and Consequences of Bargaining Power in Households. NBER Working Paper, No. 12367.
Furdyna, H.E., Tucker, M.B. and James, A.D. (2008) Relative Spousal Earnings and Marital Happiness Among African American and White Women. Journal of Marriage and Family, 70, 332–344.
Greenstein, T.N. (1995) Gender Ideology, Marital Disruption, and the Employment of Married Women. Journal of Marriage and Family, 57, 31–42.
Guriev, S. and Zhuravskaya, E. (2009) (Un)happiness in Transition. Journal of Economic Perspectives, 23, 143–68.
Hajdu, T. and Hajdu, G. (2014) Reduction of Income Inequality and Subjective Well-Being in Europe. Economics: The Open-Access, Open Assessment E-Journal, 8, 1–29.
Halleröd, B. (2005) Sharing of Housework and Money Among Swedish Couples: Do They Behave Rationally? European Sociological Review, 21, 273–288.
Hardie, J.H., Geist, C. and Lucas, A. (2014) His and Hers: Economic Factors and Relationship Quality in Germany. Journal of Marriage and Family, 76, 728–743.
Helliwell, J.F., Layard, R. and Sachs, J. (eds). (2015) World Happiness Report 2015.
Sustainable Development Solutions Network, New York.