Running title: Preparation of papers year Vol No 1
Evolution of Freight Villages and Dry Ports from the macro logistics perspective European Benchmarking 2020
Judit Oláh1 - Steffen Nestler2 - Thomas Nobel3 - József Popp4*
1 Institute of Applied Informatics and Logistics, Faculty of Economics and Business, University of Debrecen; TRADE Research Entity, Faculty of Economic and Management Sciences, North-West University, Vanderbijlpark 1900, South Africa, H-4032 Debrecen, Hungary (email: olah.judit@econ.unideb.hu)
2 Deutsche GVZ-Gesellschaft mbH, G-28359 Bremen, Germany (email: nestler@gvz-org.de)
3 Deutsche GVZ-Gesellschaft mbH, G-28359 Bremen, Germany, (email: nobel@gvz-org.de)
4 Faculty of Economics and Social Sciences, Szent István University; TRADE Research Entity, Faculty of Economic and Management Sciences, North-West University, Vanderbijlpark 1900, South Africa, H-210 Gödöllő, Hungary (email: popp.joszef@szie.hu)
* Corresponding author, e-mail: popp.joszef@szie.hu Abstract
Being the initiator of the German and European Freight Village ranking, Deutsche GVZ-Gesellschaft (DGG) has the methodical know how to create the benchmarking studies. In this ranking approximately 100 Freight Village locations were analysed and evaluated. The research was based on the generation of an uniform understanding, which was focused on intermodality and the significant distinctive management structures. This data lead to a qualitative and detailed overview. Because of the positive response, we were motivated to start the second ranking in 2015, as well as the update in 2019/2020. The results of the ranking show important basics and facts, which demonstrate the importance of the Freight Villages and strengthened their role as central, intermodal logistics nodes. Moreover, the responsible decision makers in the Freight Villages benefit from the results of the benchmarking. Many management companies use their placement in the ranking for public relations activities. Good placements or improvements are important instruments in marketing strategies.
Keywords
freight village, dry port, logistics services, benchmarking, macro logistics concept, hinterland
1 Introduction
For many years, the European Freight Villages have been playing an important role in the transport sector.
They are substantially involved in managing international supply chains (Kot, 2015, Svazas et al., 2019). Logistics trends have a huge impact on all freight villages located in Europe. Nowadays, the importance of issues like digitalization, the shortage of skilled employees, urban logistics and sustainability has increased.
Because of the fact, that the previous European Freight Village Ranking dated already five years ago an update was required. It was the goal of the ranking to gain more knowledge about the overall Freight Village (FV) development based on their benchmarking performance (Oláh et al., 2018a; Oláh et al., 2018b; Oláh et al., 2018c).
It was the intention of the ranking to demonstrate the development and constant change of the logistics landscape in the past five years. Furthermore, it was a chance to find out which suggestions for a successful further development of micrologic concepts in Europe can be derived from the data.
The evaluation criteria for the Freight Village locations were based on the European rankings in 2010 and 2015 (Oláh et al., 2018a; Oláh et al., 2018b). But there was a change of the evaluation criteria, which will be explained in the following chapter. Now the current third benchmarking is completed and available in this report. 100 out of 300 identified locations were selected for the evaluation.
1.1 Literature review
The development of dry ports, an important component of intermodal transport, could play a major role in promoting intermodal transport (Hanaoka and Regmi 2011).With the increase of containerised traffic, container terminals have started to develop in new locations in the hinterland of seaports (Korovyakovsky and Panova 2011, Jeevan et al., 2019). Development of dry ports reduces customs costs, improves rail-sea intermodal capacity, and minimizes transportation time (Ng and Cetin 2012; Wang et al., 2016;
Nguyen and Notteboom 2019).The emergence of
2 Period. Polytech. Transp. Eng. J. Oláh, S. Nestler, T. Nobel, J. Popp dry ports (offshore ports) is driven partly by
proximity to main population centres or industrial areas and partly by the need to support rapidly growing container flows (Beresford et al., 2012;
Ślusarczyk 2017). Several studies confirmed that dry ports play important roles infreight intermodal transport in terms of logistics integration and port regionalization (Notteboom and Rodrigue 2009;
Kovacs and Kot 2016; Shi and Li 2016; Kovács and Kot 2017; Wei et al., 2018).
One of the imperative issues of dry port development in developing economies is location planning (Monios and Wilmsmeier 2013; Oláh et al., 2018a). Roso (2013) reported that the main performance criteria of the port include geographic location by Nguyen and Notteboom (2016) and physical characteristics.In order to be successful, a dry port should be able to generate enough volume of traffic (Rodrigue and Notteboom 2009, Nguyen and Notteboom 2019). Thus, some dry ports are located near production bases or industrial centers in exports-driven economies, or are closely linked to supply chains (hereinafter called ‘supply chain- oriented’ dry ports) in the United States and the European Union (Ng and Cetin 2012).
A large number of studies has shown that port activities (transportation, handling, storage, treatment and distribution) make ports of crucial importance for the development of regions where they are located Deng et al. (2013) providing comparative advantages to them in terms of trade.
More particularly, the port function contributes to increased business activity, which is specialized in the shipping and transport services, while enhancing the business activity associated indirectly with this (banks, insurance companies, tourist agencies) de Langen (2004) and giving the opportunity to relevant stakeholders to invest (Dooms et al., 2015).
However, despite the emerging popularity of the dry port concept, very little research has been done on the assessment of development of dry ports in European countries. The goal of this paper is to support the transfer of positive effects on national and European level that are generated by dry ports on local and regional levels.
2 Methodology of the benchmarking process 2.1 Approach
The methodical approach includes the creation of questionnaires and an interview guideline as well as the new development of assessment criteria.
2.2 Definition
First, considerations on the selection of logistics locations were taken. The main issue was to verify the “transferability”, the use of the definition of the German “Bund-Länder-Grundsätze” on Freight Villages - which were largely shaped - in the European context:
A Freight Village is a building area where commercial transport companies, logistics service providers, complementary service facilities and logistics-intensive production and trade enterprises settle down as independent companies. A FV is linked to several, but at least two transportation modes. A spatial split into functionally structured subareas is permitted.
Freight Villages should contain a transshipment site for combined transport rail/road or waterway/road/rail, which has non-discriminatory access. It is sufficient if the transshipment site is located in proximity to the commercial area.
Minimum requirement is the designation of a suitable site for a combined transport terminal.
The establishment of suitable forms of organization (for example management or development companies) is recommended to develop potential synergies”.
Freight Villages are primarily macro logistics interfaces “road-rail” and distinguish therefore from classic (inland) ports. The same applies for unimodal logistics parks that are often found near motorways.
Due to the different forms of approaches in the various European countries, a direct transfer of the German definition is not possible. In order to cover a high number of potential Freight Villages and to realize the widest possible analysis of national development levels, a broad interpretation was firstly selected. For that reason, also the “Dry Port Approach” was taken into consideration:
A Dry Port is an inland intermodal terminal directly connected by road or rail to a seaport and operating as a centre for the transshipment of sea cargo to inland destinations. A recent academic definition of dry ports contends that for a fully developed dry port concept the
Running title: Preparation of papers year Vol No 3 seaport or shipping companies control the rail
operations (Roso et al., 2009). Furthermore, the authors contend that dry ports are used much more consciously than inland terminals (Roso et al., 2009). More recently, the term
„dry port” has been used in the industry as a marketing tool, perhaps to imply that an inland facility has reached a particular level of sophistication in terms of services offered, such as customs or the presence of Third Party Logistics (3PL) firms within the site and/or an adjoining dry port or similar (see also GVZ in Germany, ZAL in Spain, interporti in Italy) (Wilmsmeier et al., 2011).
In addition to their role in cargo transshipment, dry ports may also include facilities for storage and consolidation of goods, maintenance for road or rail cargo carriers and customs clearance services. The location of these facilities at a dry port relieves competition for storage and customs space at the seaport itself.
Aiming at realising a detailed analysis of national levels of development, a new under- standing of terms was created. It was the goal of the understanding of terms to reach a high number of potential freight villages. Moreover, by selecting
the locations the definition of the European Logistics Platforms Association „Europlatforms”
was considered.
The challenge for the selection was the delimitation to:
Ports: classic inland ports and functional only sea ports related areas.
Transport industrial parks without intermodal traffic (known as unimodal logistics parks).
Accordingly, the focus will be on following aspects and contents:
Intermodality with focus on road/rail.
Establishment of an intermodal transport terminal as key element of the Freight Villages with (if possible) non-discriminatory access.
Existence of a (neutral/central) management or development company.
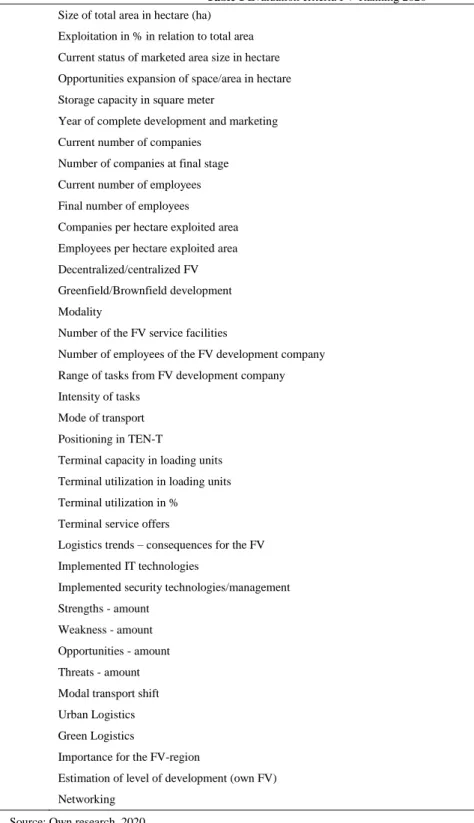
2.3 Development of benchmarking criteria Based on the stages of dissociation of benchmarking samples (process and index), 15 clusters were formed for the 2020 ranking. The clusters show a wide range of processes and index in the Freight Villages, which is why the ranking was created based on them (Fig. 1).
Fig. 1 Benchmarking Cluster with evaluation criteria
4 Period. Polytech. Transp. Eng. J. Oláh, S. Nestler, T. Nobel, J. Popp Source: Own research, 2020,
The quality of the ranking is shown by the fact that it has succeeded to include soft criteria in the benchmarking process.
These criteria (assigned to the SWOT Analysis) evaluate a varied process on located Freight Villages and accentual special success or deficits.
The evaluation criteria, created portray the benchmarking clusters. The criteria are shown in the Table 1.
Table 1 Evaluation criteria FV-Ranking 2020 1 Size of total area in hectare (ha)
2 Exploitation in % in relation to total area 3 Current status of marketed area size in hectare 4 Opportunities expansion of space/area in hectare 5 Storage capacity in square meter
6 Year of complete development and marketing 7 Current number of companies
8 Number of companies at final stage 9 Current number of employees 10 Final number of employees 11 Companies per hectare exploited area 12 Employees per hectare exploited area 13 Decentralized/centralized FV 14 Greenfield/Brownfield development
15 Modality
16 Number of the FV service facilities
17 Number of employees of the FV development company 18 Range of tasks from FV development company 19 Intensity of tasks
20 Mode of transport
21 Positioning in TEN-T
22 Terminal capacity in loading units 23 Terminal utilization in loading units 24 Terminal utilization in %
25 Terminal service offers
26 Logistics trends – consequences for the FV 27 Implemented IT technologies
28 Implemented security technologies/management 29 Strengths - amount
30 Weakness - amount
31 Opportunities - amount
32 Threats - amount
33 Modal transport shift
34 Urban Logistics
35 Green Logistics
36 Importance for the FV-region
37 Estimation of level of development (own FV)
38 Networking
Source: Own research, 2020
Running title: Preparation of papers year Vol No 5 The following factors form the basis on the
evaluation:
A total of clusters was formed for the 2020 ranking, which contain 38 evaluation criteria.
After aspects of sustainability were increasingly included in the ratings in 2015, also digitalization topics were highlighted in the current ranking. These include developments such as the use of Internet of things (IoT) solutions, Information Technology (IT) platforms and blockchain technology. In addition, applications in the field of security technologies were considered in the analyses and evaluations.
The evaluation criteria (38 factors) were rated/weighted by their importance. There was a range from “1” (low importance) to “6”
(extreme high importance). Consequently, it was possible to ensure, that the ranking focuses on important evaluation criteria, for example the current number of employees.
These very important criteria have a special position and relevance in the overall assessment.
The evaluation criteria were evaluated by reference to a four-stage scale (from 0 to 3), which was based on their characteristics of located Freight Villages. The characteristic
“0” complies an insufficient assessment, the characteristic “3” conforms the best assessment. The criteria characteristic de- notes different set of facts, which is why different definitions were created.
Freight Villages with excellent values “best in class” got special points in the SWOT evaluation. Consequently, it was possible to make a feasible distinction between Freight Villages which were rated close to each other.
The ascertained average values (benchmarking or Key Performance In- dicators (KPI)) result from information in the questionnaires as well as from inquiries, made by the projects team.
Creating the ranking, we placed high importance to the intermodality of the Freight Villages (“DNS of the freight villages”).
Moreover, the management performance gave important impetus to the ranking, which is
why some Freight villages could score highly or lose points.
The maximum performance to be achieved is 400 points.
3 Results
The following chapter shows the results of the current assessment (2020). It comprises 100 analysed Freight Villages. The ranking is divided in 15 different Clusters containing the individual criteria.
3.1 „Basic Data“- Cluster 1
Relevant for the assessment of the Freight Villages are numbers, related to the Freight Village area, the total area, the storage capacity and the area expansion options. Ancillary, the question of the expected time of the complete improvement of the location was also part of the ranking.
3.1.1 Criteria „Total area in hectare (ha)”
The ranking shows an average total area of 180 ha, regarding all 100 investigated Freight Villages. The Zaragoza PLAZA (Spain) can still be emphasized, because of its total area of 1.300 ha. In Germany, the Freight Villages in Bremen and Leipzig are with 503 ha and 640 ha of total area significantly above the European average.
3.1.2 Criteria „Development in % to total area”
This criterion shows the proportion of the developed and the total area. The average value of the developed area is about 144 ha. Because of that, the average development status is about 80 % for all European Freight Villages. However, some Freight Villages like the FV Nuremberg are completely developed. The portion of the developed area is here equal to the total area.
3.1.3 Criteria „Current status of marketed area size in hectare”
Here, the current settlement status in ha was prompted. It became clear, that with an average settlement status around 86%, the relation of this criterion compared to the developed area was quite high. The Freight Village Leipzig, for example has a developed area of 640 ha and a settled area of 639 ha.
6 Period. Polytech. Transp. Eng. J. Oláh, S. Nestler, T. Nobel, J. Popp 3.1.4 Criteria „Area expansion options in ha”
The Ranking (2020) shows, that many of the European Freight Villages have area expansion options at their disposal.
The average value of the expansion area is about 70 ha. But in general, it is difficult for Freight Villages in metropolitan areas to obtain sufficient expansion areas. For example, the Freight Villages Berlin City and Nuremberg do not have any possible potential for expansion area/ areal extent.
In contrast, the Freight Village Jade Weser Port has an area expansion option of 400 ha.
3.1.5 Criteria „Storage capacity in the FV”
The average storage capacity of the European Freight Villages is about 275.000 m². The location
„Zaragoza Plaza” in Spain is still „Best in class”
with a storage capacity of 4.270.000 m². The German frontrunner is the Freight Village Bremen with a storage capacity of 1.5 million m². The Interporto Torino bears mentioning in the European comparison with a storage capacity of 900.000 m².
3.1.6 Criteria „Complete
Development/settlement”
Incidentally, an assessment about the date of the completed development status, as well as an assessment about the complete settlement of the Freight Village area is in demand. Because of inadequate data the span 2020-2025 had to be estimated.
3.2 „FV settlers/employees” - Cluster 2
The current number of companies in a FV and the predicted number of companies on the final expansion are important indicators for the development of the European FV. Moreover, the current number of employees, as well as the current number of employees on the final expansion is considered. Finally, it is the goal to assess the number of employees per ha of settled area.
3.2.1 Criteria „Number of the current operating
companies” and Criteria „Number of the companies on the final expansion”
In 2020, the average number of companies in the European FV is about 60. Regarding the final expansion, the average is estimated to be 90 companies. In Germany, FV Nuremberg is noteworthy with 210 located companies. “Best in class” with 350 companies and a predicted number of 450 companies on the final expansion is the Zaragoza Plaza in Spain.
3.2.2 Criteria „Current number of employees”
and Criteria „Number of employees on the final expansion”
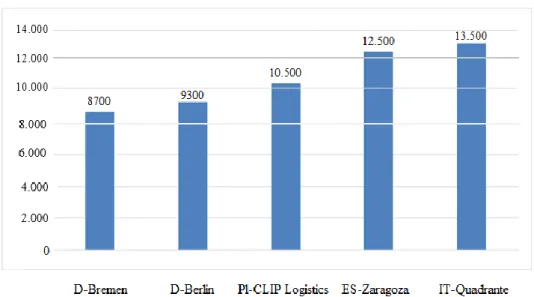
The average number of employees in the European Freight Villages is about 2.300 in 2020. In the “Top 5” of these criteria are two German FV locations (Fig. 2). The Interporto Quadrante Europe Verona (Italy) has 13.000 employees.
Fig. 2 „TOP 5” in the range of the current number of employees
Running title: Preparation of papers year Vol No 7 Source: Own research, 2020
In its final expansion, the average number of employees in Europe will be 4.000 employees. The ranking 2020 results, that there is an average number of 21 employees per ha of marketed settlement area.
Table 2 below shows the employment effects of
individual logistics facilities in Freight Villages. As expected, the overview shows that higher employment effects are achieved in practice at the property level.
Table 2. Area (warehouse) and employment key figures of logistics location types
Numbers
Import Export gateway
Central distribution
Regional distribution
Production supply
Network logistics
warehouse space in m2 25.000 13.200 20.900 12.800 6.900
Investment per 1.000 m2
in million € 1,43 1,78 1,34 1,80 1,38
Employees per 1.000 m2 8 10 10 9 15
Share of land plot
utilization % 48 43 39 42 35
Plot area in ha 5,2 3,0 5,4 3,0 1,9
Employees/ha plot area 37 43 39 37 53
Value contribution per
employee in 45.000 41.900 30.900 70.200 32.300
Value contribution/ha
plot area in Mio € p.a. 1,7 1,8 1,2 2,6 1,7
Source: Fraunhofer SCS, 2015
In this questionnaire, the distinction between a central and a decentralised FV and “brownfield” or
“greenfield”, as well as the modality issues were considered.
3.3.1 Criteria „decentralised/central FV”
The ranking 2020 shows, that central FV have a noticeable higher overall performance than decentralised FV. The reasons for this are the spatial agglomerate advantages and the higher synergetic effects. About 77% of the surveyed locations stated, that they have a central location structure of the FV.
Consequently, about 21% have a decentralised location structure.
3.3.2 Criteria „Greenfield/Brownfield“
The investigation of the FV areas shows, that a slight amount of the Freight Villages exhibited a
“brownfield development” (15%), despite the fact
that a “brownfield development” is very positive from the urban buildings point of view. 40% of the companies have a divided “greenfield/brownfield development” and just as many have a pure
“greenfield development”.
3.3.3 Criteria „Modality“
As expected, the assessment shows a noticeable higher amount of “bimodal” Freight Villages Locations (road rail). A third of the FV have three or more transport carriers.
3.4 „Services in the FV” - Cluster 4
Based on the cluster “Services in the FV”, the number of the activities and service facilities in the European locations were regarded. On average, there are 7 service facilities in the European FV (Table 3).
Table 3 Overview FV-Service facilities Filling station
Truck parking area if existing, specify level of classification of secure parking Customs office
Personnel services Hotel
Social facilities (e.g. sanitary facilities)
8 Period. Polytech. Transp. Eng. J. Oláh, S. Nestler, T. Nobel, J. Popp Waste collection
Environmental services (green keeping) Security services
Catering (e.g. restaurant, cafeteria) Shopping area
Mobility point (e.g. carsharing)) Public transport points Forwarding services
Landing spot/service for helicopters Repair service for trucks
Post office
Liquid gas station Banking Conference facilities
Refueling of freight trains Freight exchange Photovoltaic
Source: Own research, 2020.
3.5 „Structure FV management companies”
– Cluster 5
Within the cluster “Structure FV Management companies”, the responsible institutions for the FV development and establishment, for example the local authorities or FV development or operating companies of the European FV- locations were ascertained. Moreover, the numbers of employees inside these institutions were included.
The number of employees within these institutions is in Europe, on average, about 20. This number is higher than the concerning employment values in Germany. A reason for that is the fact that, many FV management companies outside of Germany are owner of areas, which means that they are responsible for the area management.
About 50 % of the management companies
funded as public private partnership (PPP). After, there are in equal shares “private” and “local”
management company’s models.
3.6 „Tasks of FV management companies” - Cluster 6
In the further course, the variety offer of the management company’s activities was received.
Also, the relevance of the respective activities was identified. On average, 9 tasks were inherited in Europe.
3.6.1 Criteria „Range of tasks”
The scope of work of the FV management companies can be widely spread and includes without limitation (Table 4).
Table 4 Overview tasks of the FV management companies Acquisition of new tenants/users
Site marketing (e.g. participation of trade fairs) Organization of stuff training and advanced qualification Development and tenancy of logistics real estates Collaborative logistics initiatives
Strengthening of non-logistics value-added-services (e.g. centralization of purchases)
Measures to encourage interaction between the companies based in the FV and government departments Technological projects and initiatives
Cooperation in research projects other activities
Financial support for professional schools and colleges for logistic Building management Cultural initiatives
Location planning (at one’s location) o Mobility management
Running title: Preparation of papers year Vol No 9 Source: Own research, 2020.
3.6.2 Criteria „Intensity of tasks”
Because of a self-assessment, the relevance of the practiced management activities and the intensity of tasks were examined. It was possible to ascertain a value from 7 (scale 0-10) Europe-wide.
Accomplishing a Europe wide comparison about the intensity of tasks of the FV management companies, a comparison of the German with the Italian and Spanish FV management companies was made.
In all three countries the support of the planning process of the area, the acquisition of new settlers and the location marketing were very important.
Mostly by the Italian management companies, the support of the implementation process and the operational phase play an important role.
In addition to that, it is notable, that in Italy the organisation of training and further education offers play an essential role.
3.7 „Connection to various modes of transport”
- Cluster 7
This cluster shows the “direct and indirect”
connection to various modes of transport. The assessment was based on the quality, the number and problems of the transport modes.
This criterion is divided in different modes of transport like motorway, railway siding, seaport, inland port, airport and public transport. After the statement of the number of modes of transport an own assessment was created. This assessment was based on a scale of 0 (bad) to 10 (excellent). The majority of the locations have all six mentioned modes of transport and on average, their quality is estimated with an eight.
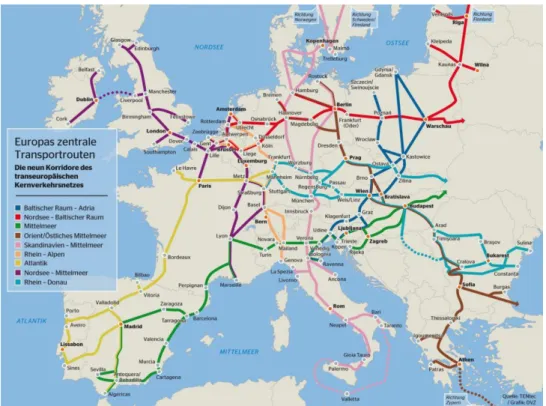
3.8 „Positioning in TEN-T” - Cluster 8
By the positioning in the trans-European network, respectively in the corridor, it was ascertained, if there are one or several corridors on each FV- location (Fig. 3).
Only about 20% of the locations are situated outside of the trans-European network. About 80%
of the European locations are located inside one or several corridors. On average, the locations are integrated in two corridors.
Fig. 3 TEN - Trans-European network Source: Internet 1
10 Period. Polytech. Transp. Eng. J. Oláh, S. Nestler, T. Nobel, J. Popp 3.9„Intermodel terminal“ - Cluster 9
Intermodality is for FV essential. Intermodal transshipment terminals are a definitional characteristic of Freight Villages. It is also a condition for an intermodal transport connection of the FV and the realisation of combined traffic.
3.9.1 Criteria „Terminal capacity”
Analysing the terminal capacity, the enpacity of the loading units (TEU converted in LTE) was indicated.
These may include containers swap bodies and semi- trailers. Impressive in the capacity volume of the Interporto Quadrante Europe Verona (Italy) with 800.000 loading units. The average value in Europe is a terminal capacity of 135.000 loading units (LU).
3.9. 2 Criteria „Terminal workload in loading unit”
The terminal workload, measured with the help auf the absolute number of loading units, the average value of the European FV locations lays around 75.000 LU. Taking into account, the terminal capacity, the location “Quadrante Europe” (Italy) is leading with 730.000 LU.
3.9.3 Criteria „Terminal workload/utilization in
%”
The terminal workload in percentage was calculated in relation to capacity. An average of 55% was determined. Various locations, for example the FV Leipzig and the FV Augsburg show a utilization of up to 100%.
3.9.4 Criteria „Terminal service“
Furthermore, data for supplementary services in the combined traffic were deter-mined. This offers, which provide the terminal service, consists of a container depot, container repair, container packing, trucking and the storage of dangerous sub-stances or the purification of tank container. On average, five of the six services, mentioned in the questionnaire, are offered in Europe. It becomes clear, that in the most FV a good developed service exists.
Furthermore, there are some locations, which offer all services, including some auxiliary services like plugs for refrigerated containers or bulk handling.
Table 5 shows the listing of all stated services for the combined traffic of the European locations, including the six-recorded services.
Table 5. Terminal services in the European FV (TOP services) Terminal services
Container depot Container repair Container packing
Trucking (Pre- and On-Carrying) Storage of hazardous materials Cleaning of tank containers Other services
Load securing/weight (SOLAS agree) Reefer plugs
RoRo equipment Fumigation container Bulk loading Agency services Wagon repair
Cargo exchange in combined traffic Source: Own research, 2020
3.10„Logical trends and their impacts on the FV” - Cluster 10
This cluster contains the logistics trends and their
impacts on the individual Freight Village. For example, this cluster is about the risk assessment regarding the cybercrime and the risks on the basis of climate change.
Running title: Preparation of papers year Vol No 11 3.10.1 Criteria „Relevance of trends fort he own
location”
Incidentally, the persons responsible for the FV were encouraged to assess the relevance of the trends for their own location. The scale was from 0 (no importance) to 10 (high relevance). On average, 6 points were determined in Europe. The assessment of the criteria took place individually, for example in dependence on the number of trends and on the assessment of importance of each trend. Generally speaking, a low importance gave a positive assessment. Because of the fact, that a high importance could be positive (Green logistic) as well as negative (nature risks), the importance was assessed individually.
The trends indicated in the ranking were:
Increasing volatility within the flows of goods
Demographic change through aging societies (e.g. effects on labour-intensive logistics operations or lack of skilled workers like drivers)
Sustainability („Green Logistics”)
Rising risks from natural catastrophes (climate change)
Rising risks from cybercrime
New challengers and competitors
The data collection showed that the topic of
"sustainability" ("green logistics") is of great importance to the respondents. Many FV managers have also assessed the topics "demographic change"
and "increasing volatility within the flow of goods"
with a high degree of importance.
3.11„Innovative technologies and digital transformation“ - Cluster 11
The digital transformation in the past years has also found his way in the logistics sec-tor. In this cluster, for example new technologies were prompted as well as the status quo of their current implementation.
3.11.1 Criteria „Implementation of digital and innovative security technologies”
On average, in Europe, about 7 (0-10 scale) points were ascertained. The evaluation of the criteria was followed individually but in dependency on the numbers of the mentioned technologies as well as in the assessment of each technology.
Innovative technologies, which are listed in this topic:
Free WIFI service,
Optical Fibre development,
IoT,
Big Data Processing,
Blockchain systems,
Integration in a data interchange platform,
Security technologies.
The relevance of the "optical fiber development"
was striking here. This was mentioned by the majority of respondents and was rated with a high to very high score in terms of its importance.
3.12 „SWOT-analysis“ - Cluster 12
The SWOT analysis contributes to visualise the strengths (Criteria 28) and the weak-nesses (Criteria 29), as well as the chances (Criteria 30) and risks (criteria 31) Regarding the analysis of criteria the strengths and weaknesses as well as the chances and risks were ascertained and provided with additional points. It was the goal of this cluster to identify and emphasize special developments/tendencies and assumptions. Overall, the inquiry shows different predictions. The four most frequently mentioned statements were summarised in the Table 6. It illustrates in which areas the FV responsible of the
“Top 20” see strengths/ weaknesses and chances/risks at their own location.
Regarding the weaknesses, the consequences of an increasing shortage of areas of the FV have to be mentioned. Because of the limited expansion option, a cluster formation is taken into account. Inside of the risks analysis, it becomes clear, that the local competitive (area) just off the FV is assumed as being problematic.
3.13„Self-assessment of
effects/contributions/importance of the FV” - Cluster 13
Finally, the interviewees were asked for a self- assessment of effects, contributions and importance of the respective FV location. By reference to a scale from 0(no or limited) to 10 (very high), an assessment in the criteria “modal shift”, “Urban logistics”, “Green logistics” and “Importance of the FV for the region” was delivered.
3.13.1. Criteria „Modal shift“
12 Period. Polytech. Transp. Eng. J. Oláh, S. Nestler, T. Nobel, J. Popp The modal contributions of the modal shift from road
to rail, respectively inland water-way was on average, evaluated with an 8.2, which means that the contributions find greater acceptance. The modal shift manifest one of the most important “brand essence” of the European FV thought.
3.13.2 Criteria „Urban logistics“
The reduction of traffic in the urban area was on average, assessed with a 7.4, by reference to a scale from 0 (very low) to 10 (very high). Occasionally, the increasing activities of the locations fall within
the scope “Urban logistics”.
Projects/initiatives show that the topic of "Urban logistics" - against the background of the current climate protection discussions - has already gained in concrete importance in the FV.
3.13.3 Criteria „Green logistics“
The importance of the “Green Logistics” was given a low valuation. On average, the contribution, which FV locations award themes like energy efficiency is about 6.6 on a scale of 1 to 10.
Nevertheless, the significance is noticeable, because not only concrete measures, but also the position of the FV play a role.
3.13.4 Criteria „Importance of the FV as a whole for the region”
The importance of the FV as a whole, that means his impact on traffic, employment and environment for the region, was on average, evaluated with an 8.6.
This shows the high significance of the FV inside the region and that they wield influence of the region. It is often spoken about the location as a “lighthouse function”, for the region.
3.14 „Development assessment” - Cluster 14 The FV management company assessed the development status of their location, in-side their own country and inside Europe. The average self- assessment is quite high with a score of 8.2 (on a scale of 1 to 10).
Table 6. SWOT-analysis of the European FV Criteria „Strengths”
Centrality/position of the FV Good traffic connection/infrastructure Intermodal hub/services
Services (e.g. security parking)
Criteria „Weaknesses”
Missing/limited area expansion options
Missing/defective infrastructure (e.g. highway, electrification) Low economic power
Missing/defective services
Criteria „Chances”
Network expansion/interior Expansion options of areas Terminal expansion/refurbishment
Criteria „Risks”
Shortage of skilled workers Trade conflicts
Increasing competition because of other locations Climate impacts/risks (e.g. tidal, low water) Source: Own research, 2020.
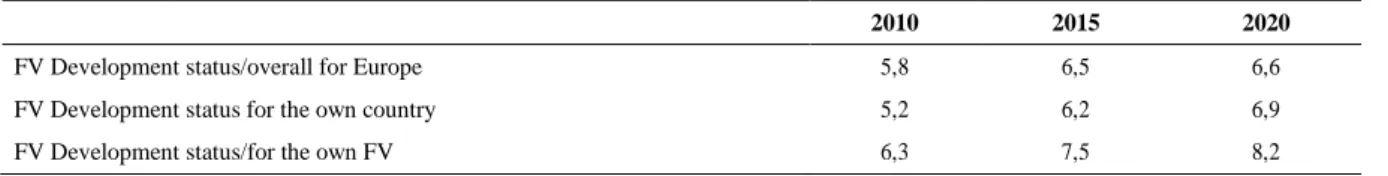
The Table 7shows the comparison of the average assessment of the development status in the years
2010, 2015 and 2020 (Nestler and Nobel 2013, Nestler and Nobel 2014, Nestler and Nobel 2016).
Running title: Preparation of papers year Vol No 13 A positive tendency, including the contribution of
the development status assessment of the own FV (+0.7) can be indicated.
Table 7. Development status in comparison of the years 2010/2015/2020
2010 2015 2020
FV Development status/overall for Europe 5,8 6,5 6,6
FV Development status for the own country 5,2 6,2 6,9
FV Development status/for the own FV 6,3 7,5 8,2
Source: Own research, 2020 3.15. „Networking“ - Cluster 15
At this point of the assessment, the membership in a national FV- association was asked for.
4 Conclusion and recommendation
The knowledge gained in the ranking of the European FV locations is presented in the Table 8.
Compared to the first two European rankings in 2010 and 2015, there was a shift in the 2020 ranking among the “Top 3”. The top locations in Europe were and are currently GVZ Bremen (rank 1), Interporto Verona (rank 2) and GVZ Nuremberg (rank 3).
Seven German locations were able to establish themselves under the "TOP 20": GVZ Berlin Süd Großbeeren (5), the GVZ Berlin West Wustermark (12), the GVZ Leipzig (15), the GVZ Jade Weser Port (16) and the GVZ Erfurt (19).
In addition to the German FV, the Italian Interporti are among the leading lo-cations in Europe and thus continue the successful international performance standards.
Spain and Austria are still considered one of the pioneers of the successful establishment of the freight village idea. Furthermore, there has also been a strong development in Poland, Hungary and Finland.
Among the "league climbers" of the ranking is the Polish Freight Village CLIP Poznan.
The ranking demonstrates that the European freight village landscape is constantly changing and continues to develop. It is worth noting that more European countries are currently in the final 'TOP 10'. If Italian and German locations dominated the field in the past, five countries are currently
represented there.
Compared to the previous rankings, the level of development of the freight village locations has increased once again in the individual countries, but also in Europe as a whole.
It also became clear that many Freight Village sites in Europe are significantly relevant for the logistics operation of their surrounding region.
Therefore, it is not surprising that the Freight Village managers often spoke in the survey about their location as a "lighthouse function" for the region.
The positive development of the European Freight Villages is reflected in many individual aspects. In particular, high employment figures, existence of logistics-oriented service facilities and, last but not least, the excellent work of many committed Freight Village management institutions are to be mentioned.
Despite all the positive findings of the ranking, however, it cannot be disregarded that it is necessary to address some challenges in the future and also cannot close the view to risks and possible negative influences. For example, the lack of area expansion options for the sites is an enormous handicap for further development. The shortage of skilled employees in logistics is now also regarded as a European challenge, as well as negative effects due to climate change and possible trade conflicts caused.
On the other hand, Freight Villages benefit from intensive networking among themselves, existing as well as future synergy effects and therefore will continue to position themselves successfully in the logistics market.
Table 8. "TOP 20" of the 2020 Ranking
Freight Villages Performance points (max. 400)
14 Period. Polytech. Transp. Eng. J. Oláh, S. Nestler, T. Nobel, J. Popp
1 D – Bremen 362
2 IT- Quadrante Europa Verona 361
3 D – Nürnberg 347
4 ES – Zaragoza 346
5 D – Berlin Süd Großbeeren 336
6 PL – CLIP Logistics 333
7 IT – Parma 328
8 IT – Bologna 322
9 A – Cargo Center Graz 305
10 IT – Padova 302
11 IT – Nola 301
12 D – Berlin West Wustermark 300
13 FIN – RRT Kouvola 297
14 IT – Torino 294
15 D – Leipzig 292
16 D – JadeWeserPort 291
17 A – Ennshafen Port 280
18 H – BILK 279
19 D – Erfurt 275
20 ES – ZAL Barcelona 273
Source: Own research, 2020
References
Beresford, A., Pettit, S., Xu, Q., Williams, S. (2012) "A study of dry port development in China", Maritime Economics &
Logistics, 14(1), pp. 73–98.
https://doi.org/10.1057/mel.2011.17
de Langen, P. (2004) "The Performance of Seaport Clusters; A Framework to Analyze Cluster Performance and an Application to the Seaport Clusters of Durban", Rotterdam and the Lower Mississippi, (No. ERIM PhD Series; EPS- 2004-034-LIS). ERIM Ph.D. Series Research in Management. Erasmus University Rotterdam.
Deng, P., Lu, S., Xiao, H. (2013) "Evaluation of the relevance measure between ports and regional economy using structural equation modeling", Transport Policy, 27, pp.
123–133. https://doi.org/10.1016/j.tranpol.2013.01.008 Dooms, M., Haezendonck, E., Verbeke, A. (2015) "Towards a
meta-analysis and toolkit for port-related socio-economic impacts: a review of socio-economic impact studies conducted for seaports", Maritime Policy & Management,
42(5), pp. 459–480.
https://doi.org/10.1080/03088839.2014.944238
Hanaoka, S., Regmi, M. B. (2011) "Promoting intermodal freight transport through the development of dry ports in Asia: An environmental perspective", IATSS Research, 35(1), pp.
16–23. https://doi.org/10.1016/j.iatssr.2011.06.001 Jeevan, J., Chen, S.-L., Cahoon, S. (2019) "The impact of dry port
operations on container seaports competitiveness", Maritime Policy & Management, 46(1), pp. 4–23.
https://doi.org/10.1080/03088839.2018.1505054
Korovyakovsky, E., Panova, Y. (2011) "Dynamics of Russian dry ports", Research in Transportation Economics, 33(1), pp.
25–34. https://doi.org/10.1016/j.retrec.2011.08.008 Kot, S. (2015) "Cost Structure in Relation to the Size of Road
Transport Enterprises", Promet-Traffic & Transportation, 27(5), pp. 387–394. https://doi.org/10.7307/ptt.v27i5.1687 Kovacs, G., Kot, S. (2016) "New logistics and production trends
as the effect of global economy changes", Polish Journal of Management Studies, 14(2), pp. 115–126.
https://doi.org/10.17512/pjms.2016.14.2.11
Kovács, G., Kot, S. (2017) "Economic and social effects of novel supply chain concepts and virtual enterprises", Journal of International Studies, 10(1), pp. 237–
254.https://doi.org/10.14254/2071-8330.2017/10-1/17 Monios, J., Wilmsmeier, G. (2013) "The role of intermodal
transport in port regionalisation", Transport Policy, pp.
161–172. https://doi.org/10.1016/j.tranpol.2013.09.010 Nestler, S., Nobel, T. (2013) "Grüne Güterverkehrszentren (GVZ)
in Deutschland – Ein erster Einblick. Makrologistische Knoten", Berlin, Germany. 3.
Nestler, S., Nobel, T. (2014) "Anforderungen an das GVZ des 21.
Jahrhunderts Makrologistische Knoten", Berlin, Germany.
4.
Nestler, S., Nobel, T. (2016) "Freight Villages (FV) in Europe – Results of the second European Ranking 2015 Makrologistische Knoten", Berlin, Germany. 6.
Ng, A. K., Cetin, I. B. (2012) "Locational characteristics of dry ports in developing economies: some lessons from Northern India", Regional Studies, 46(6), pp. 757–773.
https://doi.org/10.1080/00343404.2010.532117
Nguyen, L. C., Notteboom, T. (2016) "A Multi-Criteria Approach to Dry Port Location in Developing Economies with
Running title: Preparation of papers year Vol No 15 Application to Vietnam", The Asian Journal of Shipping
and Logistics, 32(1), pp. 23–32.
https://doi.org/10.1016/j.ajsl.2016.03.003
Nguyen, L. C., Notteboom, T. (2019) "The relations between dry port characteristics and regional port-hinterland settings:
findings for a global sample of dry ports", Maritime Policy
& Management, 46(1), pp. 24–42.
https://doi.org/10.1080/03088839.2018.1448478 Notteboom, T., Rodrigue, P. (2009) "Inland terminals within
North American and European supply chains", Transport and communications bulletin for Asia and the Pacific, 78(1), pp. 1–39.
Oláh, J., Nestler, S., Nobel, T., Harangi-Rákos, M., Popp, J.
(2018a) "Development of dry ports in Europe", International Journal of Applied Management Science,
10(4), pp. 269–289.
https://doi.org/10.1504/IJAMS.2018.10010622
Oláh, J., Nestler, S., Nobel, T., Popp, J. (2018b) "International characteristics of the macro-logistics system of Freight Villages", Periodica Polytechnica Transportation
Engineering, 46(4), pp. 194–200.
https://doi.org/10.3311/PPtr.11656.
Oláh, J., Nestler, S., Nobel, T., Popp, J. (2018c) "Ranking of dry ports in Europe-Benchmarking", Periodica Polytechnica Transportation Engineering, 46(2), pp. 95–100.
https://doi.org/10.3311/PPtr.11414
Rodrigue, J.-P., Notteboom, T. (2009) "The terminalization of supply chains: reassessing the role of terminals in port/hinterland logistical relationships", Maritime Policy &
Management, 36(2), pp. 165–183.
https://doi.org/10.1080/03088830902861086
Roso, V. (2013) "Sustainable intermodal transport via dry ports–
importance of directional development", World Review of Intermodal Transportation Research, 4(2-3), pp. 140–156.
https://doi.org/10.1504/WRITR.2013.058976
Roso, V., Woxenius, J., Lumsden, K. (2009) "The dry port concept: connecting container seaports with the hinterland", Journal of Transport Geography, 17(5), pp. 338–345.
https:/doi.org/ 10.1016/j.jtrangeo.2008.10.008
Shi, X., Li, H. (2016) "Developing the port hinterland: Different perspectives and their application to Shenzhen Port, China", Research in Transportation Business & Management, 19, pp. 42–50. https://doi.org/10.1016/j.rtbm.2016.05.004.
Ślusarczyk, B. (2017) "Prospects for the shared services centers development in Poland in the context of human resources availability", Polish Journal of Management Studies, 15, pp. 218–231. https://doi.org/10.17512/pjms.2017.15.1.21 Svazas, M., Navickas, V., Krajnakova, E., Nakonieczny, J. (2019)
"Sustainable supply chain of the biomass cluster as a factor for preservation and enhancementof forests", Journal of International Studies, 12(2), pp. 309–321.
https://doi.org/10.14254/2071-8330.2019/12-2/20 Wang, G. W., Zeng, O., Li, K., Yang, J. (2016) "Port connectivity
in a logistic network: The case of Bohai Bay, China", Transportation Research Part E: Logistics and Transportation Review, 95, pp. 341–354.
https://doi.org/10.1016/j.tre.2016.04.009
Wei, H., Sheng, Z., Lee, P. T.-W. (2018) "The role of dry port in hub-and-spoke network under Belt and Road Initiative", Maritime Policy & Management, 45(3), pp. 370–87.
https://doi.org/10.1080/03088839.2017.1396505
Wilmsmeier, G., Monios, J., Lambert, B. (2011) "The directional development of intermodal freight corridors in relation to inland terminals", Journal of Transport Geography, 19(6),
pp. 1379–1386.
https://doi.org/10.1016/j.jtrangeo.2011.07.010