Article
The Transcription Factor STAT6 Mediates Direct Repression of Inflammatory Enhancers and Limits Activation of Alternatively Polarized Macrophages
Graphical Abstract
Highlights
d
IL-4-activated STAT6 acts as a transcriptional repressor in macrophages
d
IL-4-STAT6-repressed enhancers associate with reduced LDTF and p300 binding
d
Inflammatory responsiveness of the IL-4-repressed enhancers is attenuated
d
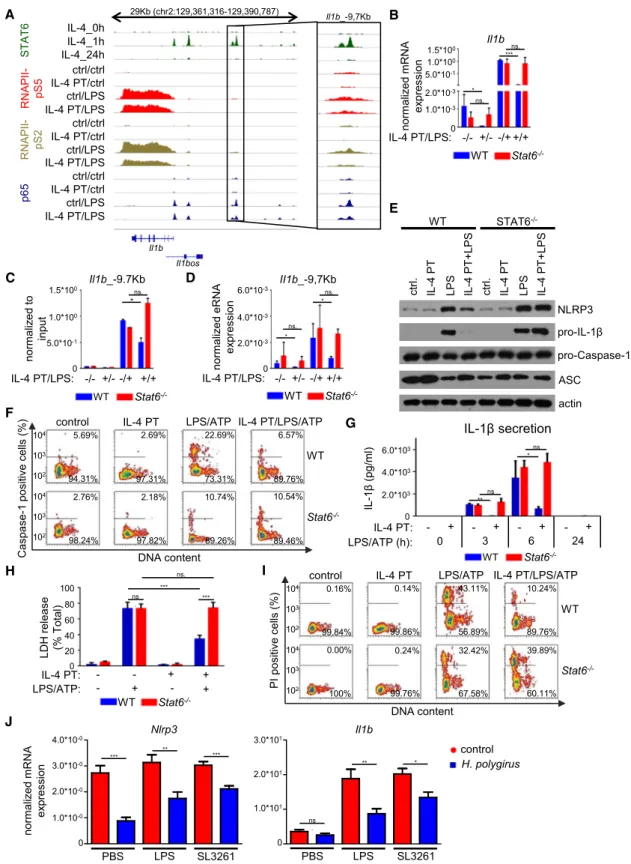
IL-4 limits the LPS-induced inflammasome activation, IL-1b production, and pyroptosis
Authors
Zsolt Czimmerer, Bence Daniel, Attila Horvath, ..., Judith E. Allen, Szilvia Benko, Laszlo Nagy
Correspondence
lnagy@sbpdiscovery.org
In Brief
The molecular bases of repressive transcriptional mechanisms contributing to macrophage polarization are not well understood. Czimmerer et al. show that in alternatively polarized macrophages, IL- 4-activated STAT6 represses a large set of enhancers modulating the
transcriptional program. STAT6- repressed enhancers are characterized by reduced chromatin accessibility, eRNA expression, LDTF, and p300 binding. IL-4-STAT6-mediated repression limits the inflammatory responsiveness including inflammasome activation, IL-1b production, and
pyroptosis. Thus, the IL4-STAT6 pathway establishes an epigenomic signature to selectively repress the macrophage inflammation program.
LDTFs
RNAPII STAT6
+LPS
Blunted inflammasome activation and pyroptosis
Il-1β Nlrp3
P300 HDACs
Inflammasome IL-1β secretion Basal state
AAAAAA AAA
Enhancer Gene
Repressedstate
AAA
Enhancer Gene
Pyroptosis
AAAmRNA eRNA
+IL-4
Tlr2 Nlrp3 Cd14 etc.
Tlr2 Nlrp3 Cd14 etc.
Czimmerer et al., 2018, Immunity48, 75–90
January 16, 2018ª2017 The Authors. Published by Elsevier Inc.
https://doi.org/10.1016/j.immuni.2017.12.010
Immunity
Article
The Transcription Factor STAT6 Mediates Direct Repression of Inflammatory Enhancers and Limits Activation of Alternatively Polarized Macrophages
Zsolt Czimmerer,1,15Bence Daniel,2,15Attila Horvath,1,15Dominik R€uckerl,3,15Gergely Nagy,1,14Mate Kiss,1
Matthew Peloquin,2Marietta M. Budai,4Ixchelt Cuaranta-Monroy,1Zoltan Simandi,2Laszlo Steiner,5Bela Nagy, Jr.,6 Szilard Poliska,7Csaba Banko,8Zsolt Bacso,8Ira G. Schulman,9Sascha Sauer,10,11,12Jean-Francois Deleuze,13 Judith E. Allen,3Szilvia Benko,4and Laszlo Nagy1,2,14,16,*
1Department of Biochemistry and Molecular Biology, Faculty of Medicine, University of Debrecen, Debrecen, Hungary
2Sanford-Burnham-Prebys Medical Discovery Institute, 6400 Sanger Road, Orlando, FL 32827, USA
3Faculty of Biology, Medicine and Health, School of Biological Sciences, University of Manchester, Manchester, UK
4Department of Physiology, Faculty of Medicine, University of Debrecen, Debrecen, Hungary
5UD-Genomed Medical Genomic Technologies Ltd., Debrecen, Hungary
6Department of Laboratory Medicine, Faculty of Medicine, University of Debrecen, Debrecen, Hungary
7Genomic Medicine and Bioinformatic Core Facility, Department of Biochemistry and Molecular Biology, Faculty of Medicine, University of Debrecen, Debrecen, Hungary
8Department of Biophysics and Cell Biology, Faculty of Medicine, University of Debrecen, Debrecen, Hungary
9Department of Pharmacology, University of Virginia, Charlottesville, VA, USA
10Otto Warburg Laboratory, Max Planck Institute for Molecular Genetics, Berlin, Germany
11CU Systems Medicine, University of W€urzburg, W€urzburg, Germany
12Max Delbr€uck Center for Molecular Medicine (BIMSB and BIH), Berlin, Germany
13Centre National de Ge´notypage, Institut de Ge´nomique, CEA, Evry, France
14MTA-DE ‘‘Lend€ulet’’ Immunogenomics Research Group, University of Debrecen, Debrecen, Hungary
15These authors contributed equally
16Lead Contact
*Correspondence:lnagy@sbpdiscovery.org https://doi.org/10.1016/j.immuni.2017.12.010
SUMMARY
The molecular basis of signal-dependent transcrip- tional activation has been extensively studied in macrophage polarization, but our understanding re- mains limited regarding the molecular determinants of repression. Here we show that IL-4-activated STAT6 transcription factor is required for the direct transcriptional repression of a large number of genes during
in vitroand
in vivoalternative macrophage polarization. Repression results in decreased line- age-determining transcription factor, p300, and RNA polymerase II binding followed by reduced enhancer RNA expression, H3K27 acetylation, and chromatin accessibility. The repressor function of STAT6 is HDAC3 dependent on a subset of IL-4- repressed genes. In addition, STAT6-repressed enhancers show extensive overlap with the NF-kB p65 cistrome and exhibit decreased responsiveness to lipopolysaccharide after IL-4 stimulus on a subset of genes. As a consequence, macrophages exhibit diminished inflammasome activation, decreased IL-1b production, and pyroptosis. Thus, the IL-4- STAT6 signaling pathway establishes an alternative polarization-specific epigenenomic signature result- ing in dampened macrophage responsiveness to inflammatory stimuli.
INTRODUCTION
Macrophage plasticity is ensured by dynamic and partially reversible responsiveness to pathogen-derived molecules as well as the cytokine and lipid microenvironment. The two well- characterized extreme functional outcomes of macrophage polarization are T helper 1 (Th1) cell-type cytokine interferon- gamma (IFN-g)-induced classical or M(INF-g)-type polarization with enhanced bactericidal capacity and Th2 cell-type cytokine interleukin-4 (IL-4)-induced alternative or M(IL-4)-type polariza- tion with anti-inflammatory properties, but complex molecular cues can generate an entire spectrum of different activation states (Gordon and Martinez, 2010; Murray et al., 2014).
The major determinant of macrophage plasticity is their spe- cific transcriptional program dictated primarily by lineage-deter- mining transcription factors (LDTFs) including ETS-domain transcription factor PU.1, CCAAT/enhancer binding proteins (C/EBPs), activator protein 1 (AP-1), or Runt-related transcription factor 1 (RUNX1) as well as extracellular signal-dependent tran- scription factors (SDTFs) including LPS-activated nuclear factor kappa-light-chain-enhancer of activated B cells (NF-kB) or AP-1, IFN-g-activated signal transducer and activator of transcription 1 (STAT1), or IL-4- and IL-13-activated STAT6; for a review see Glass and Natoli (2016). Despite the fact that polarization signals repress large sets of genes, the repressive activity of polariza- tion-specific transcription factors has not been studied in detail (Bhatt et al., 2012; Martinez et al., 2013). Recently, a whole new spectrum of next-generation sequencing-based methods has evolved, enabling the characterization of the molecular Immunity48, 75–90, January 16, 2018ª2017 The Authors. Published by Elsevier Inc. 75
A
log2FC (IL-4 vs. ctrl.)
<-3 -2 -1 0 1 2 >3
0.0 -0.1 -0.2 -0.3 -0.5-0.4
tnemhcirnEscore Cluster E
Thio-Mac Ne-Mac
NES: -2.38 FDR q-value˂0.1
Cluster A
Cluster B
Cluster C
Cluster D
Cluster E
1 3 6 24 (h)
D
B
log2FC (IL-4 vs. ctrl.)
1
0
-1
-2
-3 1 3 6 24 1 3 6 24 (h)
WT Stat6-/- Cluster E
normalizedmRNA expression
2.0*10-2
1.0*10-2 5.0*10-3
0 ctrl IL-4 Abca1
1.5*10-2 ns.**
***
ns.
2.5*10-0 2.0*10-0 1.5*10-0
5.0*10-1
0 ctrl IL-4 Cd14
1.0*10-0 ns.*
**
ns. 1.5*10-1
1.0*10-1 5.0*10-2
0 ctrl IL-4
ns.Tlr2
**
***
ns.
4.0*10-1 3.0*10-1 2.0*10-1
0 ctrl IL-4
ns.Fos
***
***
ns.
1.0*10-1 6.0*10-2
4.0*10-2 2.0*10-2
0 ctrl IL-4 Nlrp3
ns.
*
***
ns.
8.0*10-1 6.0*10-1 4.0*10-1 2.0*10-1
0 ctrl IL-4 Clec4d
ns.
***
***
ns.
normalizedmRNA expression
WT Stat6-/-
E Abca1
Thio- Mac
Ne- Mac
10 0 20 30 40
50 ***
Clec4d
Thio- Ne-
50 0 100 150 200 250 ***
Ne- Mac Tlr2
Thio- Mac
5 0 10 15 20 25
*
Fos
Thio- Ne-
100 0 200 300 ***
Cd14
Thio- Mac
Ne- Mac
100 0 200 300 400 500 ***
RPKM
Nlrp3
Thio- Ne-
1 0 2 3 4
5 ***
RPKM
C
normalizedmRNA expression IL-4:
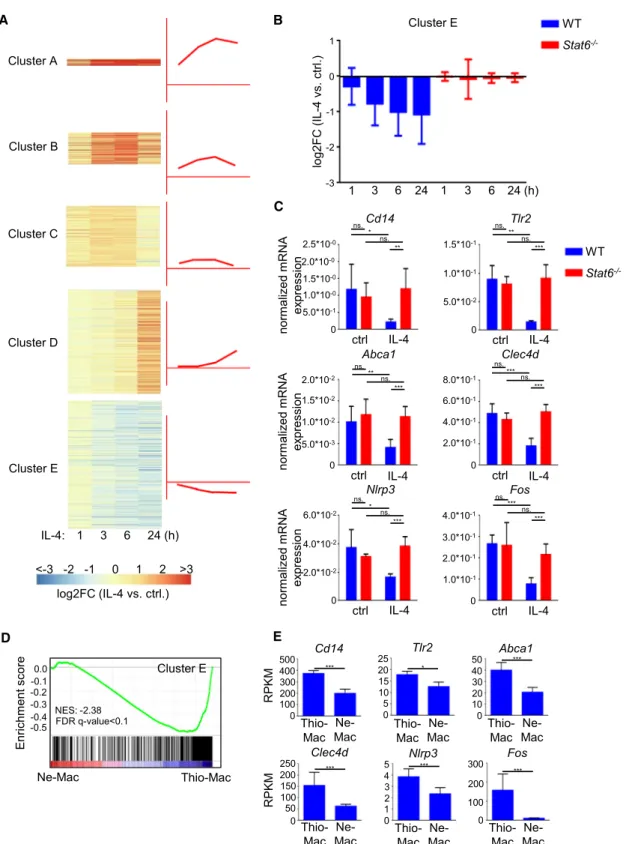
Figure 1. The IL-4-STAT6 Signaling Pathway Induced Gene Expression during Mouse Alternative Macrophage Polarization
(A) Heatmap of IL-4-regulated (p value%0.05, FCR2) gene expression clusters in WT murine BMDMs. Data represent the average fold changes of four individual animals.
(B) The average fold change from the IL-4-repressed gene cluster at the indicated time points following IL-4 stimulation in WT (n = 4) andStat6/(n = 2) BMDMs.
Error bars represent means ± SD.
(C) RT-qPCR analysis of gene expression on a set of IL-4-repressed genes in WT andStat6/BMDMs. BMDMs were treated with IL-4 for 6 hr. Data are representative of five individual animals per genotype from two independent experiments. *p < 0.05, **p < 0.01, ***p < 0.001, ns, not significant change. Error bars represent means ± SD.
(legend continued on next page)
features of transcriptional repression in macrophages at an unprecedented level (Hah et al., 2015; Kang et al., 2017).
IL-4- or IL-13-induced alternative macrophage polarization occurs in a number of pathological processes including nema- tode infection, tumor development, lung inflammation, and fibrosis (Gordon and Martinez, 2010). Given the complex immu- nological milieu that characterizes each of these conditions, alternatively polarized macrophages are likely to encounter inflammatory stimuli as well (Fort et al., 2001; Ruffell et al., 2012). It has been shown thatin vitromodeling of complex immu- nological microenvironment by IL-4 and IFN-g co-stimulation leads to the attenuation of IFN-g-induced transcriptional activa- tion due to the effects of IL-4 on restrictive set of auxiliary transcription factors in mouse macrophages (Piccolo et al., 2017). These results suggest that alternatively polarized macro- phages exhibit an altered responsiveness to inflammatory signals. The underlying crosstalk at the epigenomic and tran- scriptional levels remained largely unexplored. One of the effector functions of macrophages is the integration of different danger signals with NLRP3 inflammasome activation (Rathinam and Fitzgerald, 2016). Inflammasomes play key roles in the gen- eration of secreted forms of proinflammatory IL-1band IL-18 from their precursors. In parallel, macrophages undergo active NLRP3 inflammasome-dependent cell death termed ‘‘pyropto- sis’’ (Rathinam and Fitzgerald, 2016). The integration of this pro- cess to inflammatory epigenomic signaling is also not known.
We sought to address these questions regarding the integra- tion and regulation of the alternatively polarized macrophage phenotype by carrying out systemic genome-wide studies.
RESULTS
IL-4 Induces Transcriptional Activation and Repression via STAT6
We determined the STAT6-dependent IL-4-regulated genes in a time course in wild-type (WT) andStat6/bone marrow-derived macrophages (BMDMs) using RNA-seq (Figure S1A). First, we examined the gene expression pattern of the 1,614 IL-4-regu- lated genes (FcR2, p value < 0.05) and identified four IL-4- induced gene expression clusters based on expression dynamics and fold induction (Figures 1A andS1B; Table S1).
We also found that a high proportion of IL-4-responsive genes (39%) were repressed. Repression by IL-4 was observed after 3 hr and remained attenuated at later time points (6, 24 hr) (Figure 1A, cluster E;Table S1). IL-4-mediated repression is dependent on STAT6 (Figure 1B). For validation, we measured the mRNA level of six IL-4-repressed (Abca1, Clec4d, Fos, Tlr2,Cd14, and Nlrp3) and three activated (Klf4, Hbegf, and Edn1) genes with RT-qPCR, and we confirmed the IL-4-medi- ated and STAT6-dependent regulation (Figures 1C andS1C).
Filarial nematode infection is associated with the accumulation of alternatively polarized macrophages, exhibiting elevated expression ofYm1andFizz1/RELM-a(Anthony et al., 2006). In or-
der to determine whether transcriptional repression in response to alternative polarization signals occursin vivo, we compared the gene expression profile of peritoneal macrophages fromBru- gia malayinematode-implanted mice (Ne-Mac) and thioglycol- late-elicited peritoneal macrophages (Thio-Mac) utilizing publicly available RNA-seq data (Thomas et al., 2012). Gene set enrich- ment analysis (GSEA) showed that the in vitro IL-4-repressed gene set was significantly enriched (FDR q-value < 0.1, NER:
2.38) among the genes that were downregulated in response to nematode infection in peritoneal macrophages (Figure 1D).
In addition, all selected IL-4-STAT6-repressed genes were significantly downregulated duringBrugia malayi-inducedin vivo alternative macrophage polarization compared to thioglycollate- elicited peritoneal macrophages (Figure 1E).
Next, we determined whether IL-4-STAT6 signaling represses gene expression at the transcriptional or post-transcriptional level. We assessed the immediate early effect of IL-4 on two serine phosphorylated forms of RNA polymerase II (RNAPII), the active histone mark H3K27Ac using chromatin immunoprecipita- tion sequencing (ChIP-seq), and nascent RNA expression by Global Run-On sequencing (GRO-seq) after 1 hr of exposure.
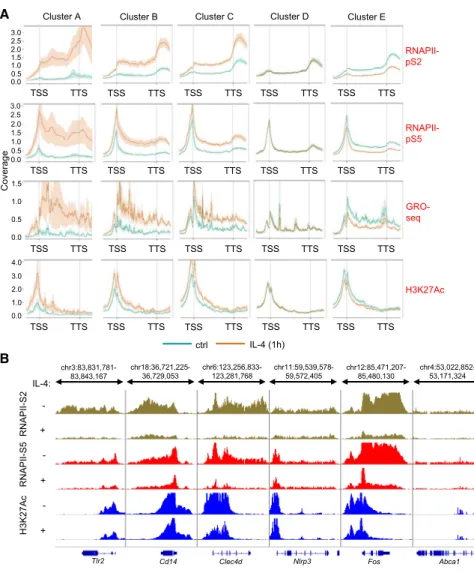
Elongation-specific RNAPII-pS2 ChIP-seq revealed 5,931 gene bodies, exhibiting significantly changing read enrichments (3,008 downregulated and 2,923 upregulated, p % 0.1) (Fig- ure S2A andTable S2). RNAPII-pS2 binding showed positive cor- relation with transcription initiation-specific RNAPII-pS5 binding, H3K27Ac enrichment, and nascent RNA expression at the gene bodies (Figure S2B). Importantly, the gene bodies of IL-4- repressed genes (cluster E) showed attenuated RNAPII-pS2, RNAPII-pS5, and H3K27Ac enrichment and nascent RNA expres- sion (Figures 2A, 2B, andS2C). In contrast, IL-4-dependent in- duction of RNAPII-pS2, RNAPII-pS5, and H3K27Ac enrichment as well as nascent RNA expression was detected at gene bodies of IL-4-induced genes (clusters A–C) (Figures 2A,S2C, and S2D).
These results indicate that IL-4-STAT6 signaling directly re- presses gene expression, primarily at the transcriptional level dur- ing alternative macrophage polarizationin vitroandin vivo.
IL-4-Activated STAT6 Binding Is Required for Transcriptional Repression
We also determined the STAT6 cistrome using a time course of 1, 6, and 24 hr of IL-4 stimulation (Figure S1A). STAT6 binding was negligible in unstimulated BMDMs (Figure 3A), but as little as 1 hr of stimulation dramatically induced the binding of STAT6, which was followed by a decline after 24 hr (Figure 3A).
Comparing the STAT6 cistrome (20,119 genomic regions in IL-4-stimulated cells) to the RNAPII-pS5-positive genomic re- gions revealed that 60.5% of STAT6 peaks overlapped with the union of those genomic regions bound by RNAPII-pS5 in resting or IL-4-treated BMDMs (Figure 3B), suggesting that transcription could be directly regulated by STAT6 at these sites. Therefore, we next classified the RNAPII-pS5-positive STAT6 peaks based on IL-4-dependent regulation of RNAPII-pS5 binding, and we
(D) GSEA analysis of IL-4-repressed genes (in vitro) against a ranked list of genes regulated in theBrugia malayi-implanted mice-derived macrophages (Ne-Mac) compared to the intraperitoneal thioglycollate-administrated mice-derived peritoneal macrophages (Thio-Mac).
(E) Expression of IL-4-repressed genes in theBrugia malayi-implanted mice-derived macrophages (Ne-Mac) and the intraperitoneal thioglycollate-administrated mice-derived peritoneal macrophages (Thio-Mac). Reads per kilobase per million values (RPKM) are presented as the mean and SD of three individual animals per group quantified by RNA-seq. *p < 0.05, **p < 0.01, ***p < 0.001.
divided the STAT6-bound genomic regions into three different clusters: ‘‘repressor,’’ ‘‘neutral,’’ and ‘‘activator’’ STAT6 peak clusters (Figure 3C andTable S3). We noted that repressor and neutral STAT6 peaks showed typically lower occupancies if compared to the IL-4-induced RNAPII-pS5-associated activator STAT6 peaks (Figure S3A). Interestingly, IL-4-dependent regula- tion of RNAPII-pS2 binding as well as H3K27Ac enrichments showed similar patterns to RNAPII-pS5 in all three STAT6 clusters (Figures 3C and 3D). These findings support the conclusion that IL-4-activated STAT6 can be associated with either transcrip- tional activation or repression at different genomic loci.
Next we assigned STAT6-bound genomic regions to genes in order to assess the correlation between IL-4-repressed enhancer activity (RNAPII-pS5 by ChIP-seq) and gene expres- sion (mRNA by RNA-seq). For this analysis, we predicted the sub-topologically associated domains (subTADs) in which gene regulation by STAT6 might take place, using CTCF and RAD21 ChIP-seq datasets from BMDM, utilizing a previously described algorithm (Daniel et al., 2014; Rao et al., 2014). As shown inFigure 3E, we found that repressor STAT6 peaks were tightly associated with the IL-4-repressed gene cluster (cluster E). In contrast, activator STAT6 peaks were associ-
TSS TTS
H3K27Ac
TSS TTS
TSS TTS
0.0 1.0 2.0 3.0 4.0
TSS TTS TSS TTS
ctrl IL-4 (1h)
TSS TTS
GRO- seq
TSS TTS
TSS TTS
TSS TTS
0.0 1.0 1.5
TSS TTS
0.5
TSS TTS
RNAPII- pS5
TSS TTS
TSS TTS
TSS TTS
TSS TTS
0.0 0.5 1.0 1.5 2.0 2.5 3.0
B A
Tlr2 Cd14 Clec4d Nlrp3 Fos Abca1
IL-4:
IIPANR-S2IIPANR-S5cA72K3H
- + - + - +
chr3:83,831,781- 83,843,167
chr18:36,721,225- 36,729,053
chr6:123,256,833-
123,281,768 chr11:59,539,578- 59,572,405
chr12:85,471,207- 85,480,130
chr4:53,022,852- 53,171,324 Cluster E
TSS TTS
Cluster D
TSS TTS
Cluster C
TSS TTS
TSS TTS
0.00.5 1.0 1.5 2.0 2.5 3.0
Cluster B
TSS TTS
egarevoC
Cluster A
RNAPII- pS2
Figure 2. Changes in RNAPII and H3K27Ac Enrichments as well as Nascent RNA Tran- scription Are Immediate Early Markers of IL-4-STAT6-Regulated Transcription (A) Metagene plot of RNAPII-pS5-, RNAPII-pS2-, and H3K27Ac-specific ChIP-seq enrichments and GRO-seq signals on the gene bodies of regulated gene clusters (Figure 1A) in the presence of IL-4 in WT BMDMs (TSS, transcription start site; TTS, transcription termination site). Coverage is defined as read count per million mapped reads.
Data (H3K27Ac, RNAPII-pS2, and RNAPII-pS5) are combined from two independent biological replicates.
(B) H3K27Ac, RNAPII-pS5, and RNAPII-pS2 ChIP- seq signals at the selected IL-4-repressed gene bodies. ChIP-seq signals are visualized by the Integrative Genomics Viewer. Data are represen- tative of two independent biological replicates.
BMDMs were treated with IL-4 for 1 hr.
ated with the immediate early IL-4- induced genes represented by clusters A–C (Figure 3E). These results suggest a tight connection between STAT6- dependent regulation of enhancer activ- ity and neighboring gene expression in the same genomic compartment or transcription unit.
To understand the IL-4-STAT6 signaling- mediated transcriptional regulation in more detail, we carried out analyses on individual genes and enhancers. For the selected repressed and activated genes, we identi- fied at least one STAT6-bound enhancer showing reduced and induced H3K27 acetylation and RNAPII binding, respec- tively (Figure 3F). Enhancer RNA (eRNA) expression is a reliable marker of enhancer activity (Natoli and Andrau, 2012). Therefore, we measured eRNA expression at the repressor and activator STAT6 peaks by RT-qPCR. The expression of eRNAs were regu- lated in a similar manner as the enrichment of RNAPII-pS5 and RNAPII-pS2 and changes of H3K27Ac levels at the repressor and activator STAT6 sites in WT BMDMs (Figures 3F, 3G, and S3B). Importantly, IL-4-mediated regulation of eRNA expression was abolished in the absence of STAT6 at the examined en- hancers (Figures 3G and S3B). Taken together, these results show that IL-4-activated STAT6 is required for the transcriptional repression characterized by decreasing RNAPII binding, histone acetylation, and consequently enhancer activity.
STAT6 Binds to Repressed Sites in the Absence of a Canonical Binding Motif
In order to investigate whether the functional characteristics of STAT6 peaks (activator versus repressor) are influenced by their genomic localization and/or the DNA sequences they are asso- ciated with, we analyzed the genomic distribution of STAT6 peak clusters. We found only minor differences between the distinct STAT6 peak clusters regarding genomic localization
2.0*10-4 1.5*10-4 1.0*10-4 5.0*10-5
0 ctrl IL-4 Nlrp3_-1.3Kb
**ns.
***
ns.
***
2.0*10-3 **
1.5*10-3 1.0*10-3 5.0*10-4
0 ctrl IL-4 Fos_-5Kb
ns.
***ns.
IL-4-repressed enhancers
Tlr2_
-21Kb Cd14_
+25Kb Fos_
-5Kb Clec4d_
-9Kb Abca1_
-27Kb Nlrp3_
-1.3Kb Klf4_
-34Kb Hbegf_
+43Kb Edn1_
-42Kb
IL-4-activated enhancers IL-4:
RNAPII-S2 - + +- RNAPII-S5
- STAT6 +
- H3K27Ac +
STAT6
motifscore
0 5 10 0h
1h 6h 24h
STAT6 peaks (20119)
-2000
Distance from STAT6 summit (bp)-1000 0 1000 2000
0 10 20 30
dezilamroNreadcount
40
A B STAT6 peaks
12175 7944
RNAPII-pS5+ RNAPII-pS5-
ctrl C
repressor (2677)
neutral (7064)
activator (2434)
STAT6 RNAPII- pS5
IL-4 ctrl IL-4
H
I
0 10 20 30 40
STAT6 motif positivepeaks(%)
Bg: 9.51%
STAT6 motif:
-1-0.500.51
Associationcoefficient
G
2.0*10-4 1.5*10-4 1.0*10-4 5.0*10-5
0 ctrl IL-4 Abca1_-27Kb
ns.
2.0*10-3 1.5*10-3 1.0*10-3 5.0*10-4
0 ctrl IL-4 Clec4d_-9Kb
ns.
*
*
dezilamroneRNAnoisserpxe ns.
2.0*10-3 1.5*10-3 1.0*10-3 5.0*10-4
0 ctrl IL-4 Cd14_+25Kb
* ns.
ns.
** 3.0*10-4 2.0*10-4 1.0*10-4
0 ctrl IL-4 Tlr2_+29Kb
ns.
***
* ns.
* ns.
WT Stat6-/-
D
0 5 10 15
ctrl IL-4 ctrl IL-4 ctrl IL-4
repressor neutral activator
RNAPII-pS2
MKPR
0 20 40
ctrl IL-4 ctrl IL-4 ctrl IL-4
repressor neutral activator
H3K27Ac
RPKM
# # #
#
ns.
ns.
F
IL-4 detalugergene sretsulc A
repressor activator
B C D E E
ctrl IL-4
0
RPKM10
20
ctrl IL-4
0
RPKM10
20
ctrl IL-4
0
RPKM10
20
IL-4:
neutral
(legend on next page)
relative to genes (Table S4). The majority of STAT6 peaks were localized in intergenic and intronic regions in the genome in all three clusters, and only about 10% of STAT6 binding sites were detected in promoter-proximal regions (Table S4). We also examined the enrichment of active histone mark H3K4m1 at the STAT6-bound genomic regions using a publicly available ChIP-seq dataset (Ostuni et al., 2013). Although H3K4m1 enrich- ment was observed at more than 98% of STAT6-bound genomic regions, it was not influenced by IL-4 treatment (Table S4,Fig- ure S3C). These findings suggest that STAT6 primarily binds enhancers and that the functional characteristics of different STAT6 peak clusters cannot be explained by their genomic local- ization relative to genes.
Next, we carried outde novomotif enrichment analysis of the sequences under the STAT6 peaks. PU.1, TRE, RUNX, and C/EBP motifs were enriched under all three clusters (Figure S3D).
However, the canonical STAT6 motif was significantly under- represented under repressor and neutral STAT6 peaks if compared to the activator STAT6 peaks (Figures 3H andS3D).
Plotting the motif scores for PU.1, TRE, RUNX, and C/EBP re- vealed no significant differences between the different STAT6 peak clusters (Figure S3E). In contrast, motif score for STAT6 was lower in the repressor and neutral STAT6 peak clusters compared to the activator STAT6 peak cluster (Figure 3I).
Considering that the presence of STAT6 is needed for repression (Figure 1B), these findings raise the possibilities that STAT6 is bound without direct DNA contact or that it recognizes non-ca- nonical STAT6-binding motifs at repressed enhancers.
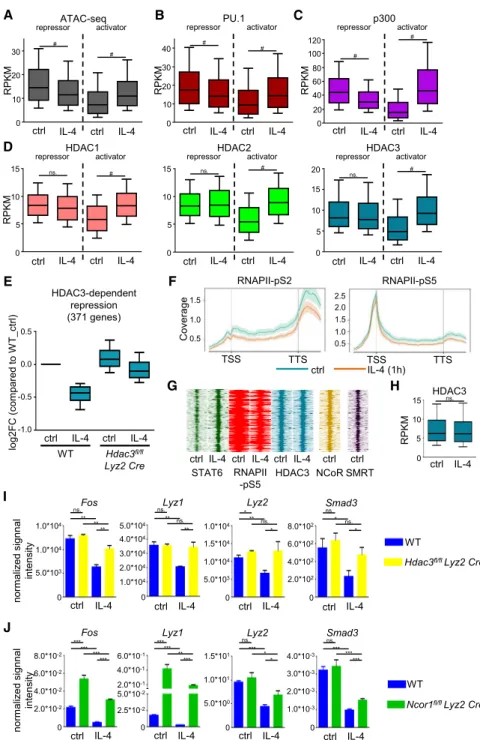
STAT6-Mediated Repression of Enhancer Activity Is Accompanied by Decreased Chromatin Accessibility and Lineage-Determining Transcription Factor Binding We investigated whether chromatin accessibility is affected at the STAT6-bound genomic regions by performing Assay for Trans- posase-Accessible Chromatin using sequencing (ATAC-seq) experiments. Our genome-wide analyses showed increased chro- matin accessibility at the activator STAT6-bound sites (Figure 4A), while significant reduction was detected in chromatin accessibility
at the repressor STAT6-bound genomic regions (Figure 4A). These results suggest that both STAT6-mediated enhancer activation and repression are associated with the modification of chromatin structure during alternative macrophage polarization.
Chromatin openness determines enhancer activity in different cell types (Shlyueva et al., 2014). Moreover, binding of macro- phage LDTFs, PU.1, JUNB, IRF8, and C/EBPaare associated with active enhancers in macrophages (Glass and Natoli, 2016). In addition, their binding motifs were among the most enriched transcription factor motifs under STAT6 peaks (Fig- ure S3D). Therefore, we decided to determine whether IL-4- STAT6 signaling-mediated repression is associated with modi- fied binding of LDTFs and examined their binding at repressed enhancers in the presence or absence of IL-4 using ChIP-seq.
A high portion of the STAT6 cistrome overlapped with the exam- ined LDTF cistromes except for JUNB, which showed moder- ated overlap (Table S4). Intriguingly, PU.1, JUNB, and C/EBPa binding was significantly decreased, while IRF8 binding was not modulated at the repressed STAT6-bound genomic regions after 1 hr IL-4 treatment in BMDMs (Figures 4B andS4A). In contrast, all four LDTFs showed significantly elevated binding at the IL-4-activated enhancers following IL-4 stimulation (Fig- ures 4B and S4A). These findings suggest that IL-4-STAT6 signaling pathway modulates the binding of LDTFs at STAT6- activated and -repressed enhancers to opposite directions.
IL-4-STAT6 Signaling Pathway-Mediated Repression of Enhancers Is Characterized by an Altered
p300:HDAC Ratio
The acetylation status and thus the activity of enhancers are tightly controlled by histone acetyltransferase (HAT) and histone deacetylase (HDAC) enzymes (Calo and Wysocka, 2013). There- fore, we examined the binding of the histone acetyltransferase p300 as well as classical histone deacetylases, including HDAC1, 2, and 3 at the STAT6-bound genomic regions after 1 hr of IL-4 exposure by ChIP-seq. We found that the majority of STAT6-bound genomic regions were either pre-loaded by p300 and classical HDACs or recruited these factors upon IL-4
Figure 3. RNAPII-pS5-Based Characterization of IL-4-Activated STAT6 Cistrome in Mouse Macrophages (A) Histograms of the average coverage of STAT6 peaks at the indicated period of time following IL-4 treatment in WT BMDMs.
(B) Pie chart of the RNAPII-pS5-positive and -negative STAT6-bound regulatory regions, 1 hr of IL-4 stimulation.
(C) Read distribution plot of ChIP-seq intensities for STAT6 and RNAPII-pS5 around the summit of the detected STAT6 peaks in a 4 kb window (left). Clustering of STAT6-RNAPII-pS5 co-bound genomic regions was based on the usage of DiffBind analysis (p%0.05). Boxplots of the average RPKM values for RNAPII-pS5 in each cluster (right). Boxes encompass the 25thto 75thpercentile RPKMs. Whiskers extend to the 10thand 90thpercentiles.
(D) Boxplots of RNAPII-pS2 and H3K27Ac read enrichments (RPKM) around the identified STAT6 peak clusters in WT BMDMs. Boxes encompass the 25thto 75th percentile RPKMs. Whiskers extend to the 10thand 90thpercentiles.
(E) Heatmap of correlations between STAT6 peak (C) and IL-4-regulated gene clusters (Figure 1A) based on genomic proximity and functional chromatin domain prediction.
(F) Integrative Genomics Viewer snapshots of STAT6, H3K27Ac, RNAPII-pS5, and RNAPII-pS2 ChIP-seq signals on a set of IL-4-repressed and activated genomic loci.
(G) RT-qPCR measurements of eRNA expression at IL-4-repressed enhancers in WT andStat6/macrophages.
(H) Bar plots showing the percentage of the STAT6 motif-positive STAT6 peaks in the clusters on (C). The STAT6 binding motif was used for targeted search.
Dashed line indicates background (Bg: 9.51%).
(I) Boxplot of STAT6 motif scores at the functionally distinct STAT6 peak clusters. Boxes encompass the 25thto 75thpercentile motif scores. Whiskers extend to the 10thand 90thpercentiles.
BMDMs (B–D, F, and G) were treated with IL-4 for 1 hr. Data in (A)–(D) are combined from two independent biological replicates. Changes in (D) were considered significant at p < 0.00001 using paired t test and an average fold change cut off value ofR1.15 was used between control and IL-4-treated samples. # means significant difference, n.s. indicates not significant change. Data in (F) are representative of two independent biological replicates. Data in (G) are representative of five individual animals per genotype from two independent experiments. *p < 0.05, **p < 0.01, ***p < 0.001, ns, not significant change. Error bars represent mean ± SD.
stimulation (Table S4). The binding of p300 was significantly increased at STAT6-activated enhancers, but significantly reduced at STAT6-repressed enhancers upon IL-4 treatment (Figure 4C). Interestingly, genome-wide analysis of IL-4-modu- lated HDAC binding showed significantly enhanced HDAC1, 2, and 3 occupancy at STAT6-activated enhancers, while STAT6- repressed enhancers showed no effect to IL-4, but exhibited HDAC binding at the basal state (Figure 4D). Collectively, these results show that STAT6-repressed enhancers are bound by both HATs and HDACs at the steady state and that p300 binding is selectively reduced by IL-4, resulting in a changed equilibrium favoring HDAC activity.
The Presence of HDAC3 Is Required for IL-4-STAT6- Mediated Repression on a Subset of Genes
Direct interactions between classical HDACs and STAT tran- scription factors have been observed previously in numerous cell types influencing STAT-mediated direct transcriptional regu- lation (Icardi et al., 2012; Nusinzon and Horvath, 2003). In addi- tion, HDAC3 has been shown to participate in the regulation of alternative macrophage polarizationin vitroandin vivo(Mullican et al., 2011). Thus, we hypothesized that HDAC3, which is pre- sent at repressed enhancers (Figure 4D), might also contribute to IL-4-STAT6-induced repression. Therefore, we decided to examine the role of HDAC3 using a dataset fromMullican et al.
HDAC3
ctrl IL-4
RPKM
0 5 10 15
D
E A
WT
(CF2golderapmoctoWT_ctrl)
ctrl IL-4 ctrl IL-4 0.5
0.0
-0.5
HDAC3-dependent repression (371 genes)
Hdac3fl/fl Lyz2 Cre -1.0
ns.
8.0*102 Lyz2
ns. * ns.
I
** **
1.0*104
1.0*104
5.0*103
0 ctrl IL-4 Fos
**
** ns.
5.0*104
2.0*104 1.0*104
0 ctrl IL-4 Lyz1
**
3.0*104 4.0*104
** ns.
1.0*104
1.0*104 5.0*103
0 ctrl IL-4
* 1.5*104
* ns.
2.0*102 0 ctrl IL-4
Smad3
*
4.0*102 6.0*102 dezilamronlanngis intensity
WT
Hdac3fl/flLyz2 Cre
ns.
*** * 1.5*101
5.0*100
0 ctrl IL-4 Lyz2
*
1.0*101
J
***
******
8.0*10-2 6.0*10-2 4.0*10-2 2.0*10-2
0 ctrl IL-4 Fos
***
***
*** **
6.0*10-1
2.0*10-1 5.0*10-2 2.5*10-2
0 ctrl IL-4 Lyz1
***
4.0*10-1
ns.
*** ***
4.0*10-3 3.0*10-3 2.0*10-3 1.0*10-3
0 ctrl IL-4 Smad3
***
dezilamronlanngis intensity
WT
Ncor1fl/flLyz2 Cre
F
G
RNAPII-pS5
TTS TSS
0.5 1.0 1.5 2.0 2.5 RNAPII-pS2
TSS TTS
0.5 1.0 1.5
Coverage
ctrl IL-4 (1h)
H
STAT6 RNAPII -pS5
HDAC3 NCoR SMRT ctrl IL-4 ctrl IL-4 ctrl IL-4 ctrl ctrl 0
20
ctrl IL-4 ctrl IL-4 repressorATAC-seqactivator
MKPR
30
10
#
#
B
0 20
ctrl IL-4 ctrl IL-4 repressorPU.1activator
RPKM
30
10
# #
40
0 40
ctrl IL-4 ctrl IL-4 repressorp300activator
RPKM
60
20
#
#
80 100 120
C
0 10
ctrl IL-4 ctrl IL-4 repressorHDAC1activator
MKPR
15
5
ns. #
0 10
ctrl IL-4 ctrl IL-4 repressorHDAC2activator 15
5
ns. #
0 10
ctrl IL-4 ctrl IL-4 repressorHDAC3activator
15
5
ns. #
20
ns.
Figure 4. IL-4-Induced Changes at Repressor and Activator STAT6 Sites and the Role of HDAC3 in IL-4-STAT6-Mediated Repression
(A–D) Boxplots of ATAC-seq (A) and ChIP-seq (B–D) signals for PU.1 (B), p300 (C), HDAC1 (D), HDAC2 (D), and HDAC3 (D) on the repressor and activator STAT6 sites in WT BMDMs. Boxes encompass the 25thto 75thpercentile RPKMs.
Whiskers extend to the 10thand 90thpercentiles.
(E) Boxplots of the expression of IL-4-HDAC3- dependent repressed genes in WT (n = 3) and Hdac3fl/flLyz2 Cre(n = 3) BMDMs using publicly available microarray results. Boxes encompass the 25th to 75th percentile changes. Whiskers extend to the 10thand 90thpercentiles.
(F) Metagene plots of RNAPII-pS5 and RNAPII- pS2 signals at the gene bodies of IL-4-HDAC3- dependent repressed genes. Coverage is defined as read count per million mapped reads.
(G) Read distribution plot of ChIP-seq intensities for RNAPII-pS5, STAT6, HDAC3, NCoR, and SMRT around the summit of the detected STAT6 peaks at the IL-4-repressed enhancers (n = 325) in the subTADs of HDAC3-dependent repressed genes, 1 hr of IL-4 stimulation.
(H) Boxplot of the average HDAC3 binding in- tensity on the genomic regions (G). Boxes encompass the 25thto 75thpercentile RPKMs.
Whiskers extend to the 10thand 90thpercentiles.
(I) Normalized microarray signal intensity ofFos, Lyz1,Lyz2, andSmad3in control or IL-4-stimu- lated WT andHdac3fl/flLyz2 CreBMDMs.
(J) RT-qPCR measurements ofFos,Lyz1,Lyz2, andSmad3expression in control or IL-4-stimu- lated WT andNcor1fl/flLyz2 CreiBMDMs.
BMDMs were treated with IL-4 for 1 hr (A–D, F–H) or 24 hr (E, I, and J). Data (A–D, F, and H) are combined from two independent biological repli- cates. Changes (A–D and H) were considered significant at p < 0.00001 using paired t test and an average fold change cut off value ofR1.15 was used between control and IL-4-treated samples.
# means significant difference, ns indicates not significant change. Data (I) represent the mean and SD of three independent biological replicates.
*p < 0.05, **p < 0.01, ***p < 0.001, ns, no significant difference. Error bars represent means ± SD. Data (J) represent the mean and SD of three indepen- dent biological replicates. *p < 0.05, **p < 0.01,
***p < 0.001, ns, no significant difference. Error bars represent means ± SD.
(2011). Applying K-mean clustering method, we found 1,628 IL- 4-repressed genes (p%0.05) in WT BMDMs (Figure S4B) and identified an IL-4-repressed gene cluster (cluster III, 371 genes) that showed attenuated repression inHdac3fl/flLyz2 CreBMDMs following IL-4 treatment (Figures 4E and S4B). Although the basal expression of these genes did not show major differences between WT andHdac3fl/flLyz2 CreBMDMs, the IL-4-induced repression was partially or completely abolished in the absence of HDAC3 (Figures 4E and S4B). In addition, enrichments of RNAPII-pS5 and RNAPII-S2 were reduced at these gene bodies after 1 hr of IL-4 treatment in WT BMDMs (Figure 4F). Interest- ingly, 325 STAT6-repressed enhancers were found within the subTADs of IL-4-HDAC3-repressed genes (Figure 4G). These enhancers were bound by HDAC3, but HDAC3 occupancy was not altered by IL-4 stimulation (Figures 4G and 4H). Our results indicate that HDAC3 is required for the IL-4-induced repression of a specific subset of genes.
Due to the fact that HDAC3 is one of the key components of NCoR and SMRT corepressor complexes (Karagianni and Wong, 2007), we decided to determine whether the NCoR- SMRT complex itself participates in IL-4-STAT6-HDAC3-medi- ated repression as well. First, we determined the occupancy of NCoR and SMRT at HDAC3-bound enhancers using ChIP-seq data generated by others (Barish et al., 2012). We found that the IL-4-STAT6-HDAC3-repressed enhancer set was bound by both NCoR and SMRT in unstimulated BMDMs (Figure 4G).
Next, we investigated the requirement of NCoR in the IL-4- STAT6-HDAC3-mediated repression using Ncor1fl/fl Lyz2 Cre immortalized bone marrow-derived macrophages (iBMDMs).
We selected four genes for this analysis (Fos,Lyz1,Lyz2, and Smad3) based on their IL-4-STAT6-HDAC3-dependent repres- sion (Figures 4I,S4C, and S4D) and due to the fact that their en- hancers were bound by HDAC3, NCoR, and SMRT (Figure S4C).
Gene expression analysis showed thatFosandLyz1were ex- pressed at a significantly higher level in unstimulated iBMDMs in the absence of NCoR compared to WT iBMDMs, while the basal expression of Lyz2 and Smad3 were not affected by NCoR (Figure 4J). In addition, IL-4-mediated repression of these genes was diminished inNcor1fl/flLyz2 CreiBMDMs (Figures 4J andS4E). In contrast, the basal expression and IL-4-induced repression of HDAC3-independent genes were not affected by NCoR, except forAbca1(Figure S4F). Taken together, our find- ings suggest that IL-4-activated STAT6 mediates transcriptional repression via the NCoR-HDAC3 complex at a subset of genes representing one of the molecular mechanisms for STAT6- dependent transcriptional repression.
IL-4-STAT6-Mediated Direct Transcriptional Repression Affects the LPS-Induced Inflammatory Program of Macrophages
Next we were wondering whether the repressive action of IL-4- STAT6 leaves its footprint on the epigenome and affects the sub- sequent response of the cells to other stimuli. Using KEGG pathway analysis, we identified 12 signaling pathways whose overrepresentation was specific to IL-4-repressed genes (Fig- ure S5A). NOD-like receptor signaling and Toll-like receptor signaling among the top hits, which are known to be two major regulators of the inflammatory response (Figure S5A; Chen et al., 2009; Takeda et al., 2003). In addition, upstream transcrip-
tional regulator analysis with Ingenuity Pathway Analysis (IPA) software revealed that the LPS-activated p65 (RelA) is one of the most significantly inhibited transcriptional regulators upon IL-4 stimulation (Figure S5B). Interestingly, the majority of IL-4- STAT6-repressed genes included several members of NOD- like and Toll-like receptor signaling pathways showing attenu- ated mRNA expression following 24 hr of IL-4 stimulation and reduced STAT6 binding at the repressed enhancers (Figures 1A, 1B,S5C, and S5D). These results raised the possibility that IL-4 is able to modulate the subsequent inflammatory response of the macrophage epigenome via directly repressed enhancers following the dissociation of STAT6.
In order to determine whether prior activation of IL-4-STAT6 signaling is able to influence the inflammatory program of mac- rophages, we performed RNA-seq as well as RNAPII-pS5-, RNAPII-pS2-, and p65-specific ChIP-seq experiments on IL-4- pretreated and LPS-activated BMDMs (Figure 5A). Our global transcriptome analysis identified 1,350 LPS-activated genes (p
%0.05) in BMDMs (Figure 5B,Table S5). Intriguingly, 520 genes showed significantly attenuated (p%0.05) LPS responsiveness following IL-4 pretreatment including the above examinedTlr2, Cd14, Clec4d, and Nlrp3 (Figure 5B, Table S5). In addition, LPS-mediated induction of 686 genes was not influenced signif- icantly by IL-4 pretreatment, while 144 genes showed signifi- cantly elevated LPS activation in IL-4-pretreated BMDMs (Fig- ure 5B andTable S5), suggesting that the interaction between the two pathways is not a general interference or attenuation, but it takes place on selective genomic regions. Interestingly, 6 out of 12 IL-4-repressed signaling pathways were also signifi- cantly overrepresented among the genes that were less induced by LPS following IL-4 pretreatment, including NOD-like receptor and Toll-like receptor signaling pathways (Figure S5E). Next, we investigated whether IL-4-STAT6 signaling modulates LPS- dependent activation of inflammatory genes at the transcrip- tional or post-transcriptional level. We examined the IL-4- and LPS-regulated binding of RNAPII-pS2 at the gene bodies of LPS-induced genes using ChIP-seq. RNAPII-pS2 binding showed a similar pattern to ‘‘steady-state’’ mRNA level in all three gene expression clusters, suggesting that IL-4 pretreat- ment modulates LPS-induced gene expression primarily at the transcriptional level (Figure 5C). In order to investigate whether the IL-4-attenuated inflammatory response is STAT6 dependent, we measured the expression ofTlr2,Cd14,Clec4d, andNlrp3in WT andStat6/BMDMs after 24 hr of IL-4 pretreatment fol- lowed by 3 hr of LPS activation. As expected, IL-4 pretreatment failed to inhibit the LPS response of these genes in the absence of STAT6 (Figure 5D), raising the possibility that IL-4-activated STAT6 can directly modulate LPS responsiveness in macro- phages via transcriptional repression of certain components of the inflammatory program.
To determine whether the crosstalk between IL-4-STAT6 signaling and inflammation-activated signaling pathways can also be observed at the enhancer level, we compared the IL-4- activated STAT6- and LPS-activated p65 cistromes in the sub- TADs of IL-4-attenuated LPS-responsive genes. 961 genomic regions were identified with overlapping STAT6 and p65 peaks revealing a partial overlap between the STAT6 and p65 cis- tromes (Figures 6A and 6B). Next, we decided to investigate whether IL-4-STAT6 and inflammatory signaling pathways are
able to interact with each other using RNAPII-specific ChIP-seq analysis. 641 out of 961 genomic regions were associated with significantly elevated RNAPII-binding following LPS activation (Figure 6B). Intriguingly, 70% (448/641) of LPS-activated en- hancers showed significantly reduced basal and LPS-induced RNAPII binding after 24 hr of IL-4 pretreatment (Figures 6B–6E). To further explore the mechanism of IL-4-STAT6-atten- uated inflammatory responsiveness, we determined LPS- induced p65 binding at this enhancer set in IL-4-pretreated and unstimulated BMDMs. Based on p65 binding, we could
identify two subsets of these enhancers including IL-4-insensi- tive and IL-4-attenuated p65 binding-associated enhancers (Fig- ures 6E and 6F). LPS-induced p65 binding was significantly reduced at 74 IL-4-repressed enhancers, while IL-4-repressed inflammatory response was not associated with modulated p65 binding at 374 enhancers (Figures 6E and 6F). To investigate the STAT6 dependency of IL-4-repressed enhancer activity and p65 binding, we selected three enhancers for both analyses.
RT-qPCR-based eRNA expression analysis confirmed IL-4- mediated and STAT6-dependent repression of basal and
LPS untreated
LPS untreated
untreated LPS ctrl A
B
+/- IL-4 pre-
treatment (24 h) +/-
LPS
ChIP-seq (1h LPS): RNAPII-pS5, RNAPII-pS2, p65 RNA-seq (3h LPS)
dezilamronto detaertnu/ctrl(log2 FC)
-2 0 2 4
IL-4 PT ctrl IL-4 PT Cluster 1 (520)
ctrl
-2 0 2 4
IL-4 PT ctrl IL-4 PT Cluster 2 (686)
-2 0 2 4
ctrl IL-4 PT ctrl IL-4 PT
6 Cluster 3 (144)
C
0.5 1.0 1.5 2.0 2.5
TSS TTS
3.0
0.0
TSS TTS
egarevoC
RNAPII-pS2
Cluster 1 Cluster 2
TSS TTS
Cluster 3
ctrlIL-4 PT LPSIL-4 PT + LPS
LPS:
IL-4 PT: - + - +
- - + +
2.0*100 1.5*100 1.0*100 5.0*10-1 0
Cd14
- + - +
- - + +
4.0*10-1
2.0*10-1 1.0*10-1 0
Tlr2
- + - +
- - + +
3.0*100 2.0*100 1.0*100 0
Clec4d dezilamronmRNA expression
- + - +
- - + +
8.0*10-1 6.0*10-1
2.0*10-1 4.0*10-1
0
Nlrp3
3.0*10-1 WT
Stat6-/-
ns.
*
ns.
**
**
***
ns.
ns.
**
**
ns.
ns.
ns.
ns.
**
**
D
Figure 5. Selective Repression of LPS-Activated Inflammatory Program by IL-4-Activated STAT6 (A) Schematic representation of the experimental system.
(B) Boxplot of the fold changes of LPS-activated genes (RNA-seq). Clustering was based on the different LPS-induced gene expression effects on IL-4-pretreated and untreated BMDMs (p < 0.05). Data represent the average fold changes of three individual animals from two independent experiments. Boxes encompass the 25thto 75thpercentile changes. Whiskers extend to the 10thand 90thpercentiles.
(C) Metagene plot of RNAPII-pS2 signals over the gene bodies of the genes in the clusters (B). Coverage is defined as read count per million mapped reads. Data are combined from two independent biological replicates.
(D) RT-qPCR measurements of basal and LPS-induced expression of the inflammation-associated genes in IL-4-pretreated and unstimulated WT andStat6/ BMDMs. Data are cumulative of four individual animals per genotype from two independent experiments. *p < 0.05, **p < 0.01, ***p < 0.001, ns, no significant difference. Error bars represent means ± SD.
BMDMs were pretreated with IL-4 for 24 hr followed by LPS exposure for 3 hr (B and D) or 1 hr (C).
A B C overlapped
STAT6/LPS-induced p65 peaks: 961
LPS-activated RNAPII- binding (pS2 and/or
pS5): 641
IL-4 pretreatment- dependent repression of
LPS response: 448 12778
1424961 STAT6 peaks
(2385)
LPS-induced p65 peaks
(13734)
D
F
RNAPII-pS5 RNAPII-pS2
IL-4 PT/LPS: -/- +/- -/+ +/+ -/- +/- -/+ +/+
#
#
IL-4 PT/LPS: -/- +/- -/+ +/+0 10
20 30
RNAPII-pS5
-/- +/- -/+ +/+
0 10 20 30
RNAPII-pS2
40
#
#
# #
#
#
RPKM
ns.
-/- +/- -/+ +/+
0 20 40 60
IL-4-insensitive p65 binding (374)
80 100
IL-4 PT/LPS: -/- +/- -/+ +/+0 20
40 60
IL-4-attenuated p65 binding (74)
80 100
E
#
# #
ns.
#
#
RPKM
Cd14_
+6.8Kb Tlr2_
-21Kb
Cxcl11_
-6.7Kb
Cxcl11_
-11Kb Bcl6_
-4.7Kb Fcgr1_
-7.7Kb Il18_
+25Kb
6TATSIIPANR-pS5IIPANR-pS2p65
IL-4_0h IL-4_1h
IL-4_24h ctrl/ctrl IL-4 PT/ctrl ctrl/LPS IL-4 PT/LPS ctrl/ctrl IL-4 PT/ctrl ctrl/LPS IL-4 PT/LPS ctrl/ctrl IL-4 PT/ctrl ctrl/LPS IL-4 PT/LPS IL-4_6h
ns.
IL-4-insensitive p65 binding IL-4-attenuated p65 binding
Figure 6. Attenuated Inflammatory Response Is Conferred by the Repressive Action of IL-4-STAT6 Signaling on a Subset of Enhancers (A) Venn diagram of the overlap between the STAT6-bound regulatory regions associated to IL-4-inhibited LPS-responsive genes and the LPS-activated p65 cistrome.
(B) Flowchart of the identification of IL-4-repressed, LPS-inducible inflammatory enhancers. Significant changes in RNAPII binding were identified by DiffBind analysis (p%0.05).
(C) Read distribution plot of ChIP-seq intensities for RNAPII-pS5 and RNAPII-pS2 around the summit of STAT6 peaks on the identified 448 overlapping STAT6 and p65-bound regulatory elements exhibiting IL-4-dependent attenuation of LPS response.
(D) Boxplot of the average coverage (RPKM) for RNAPII-pS5 and RNAPII-pS2 binding at the regulatory regions presented on the read distribution plot on (C), exhibiting attenuated LPS response in IL-4-pretreated BMDMs. Boxes encompass the 25thto 75thpercentile RPKMs. Whiskers extend to the 10thand 90th percentiles.
(E) Boxplot of the average coverage (RPKM) for p65 binding at the regulatory regions presented on the read distribution plot on (C), exhibiting attenuated LPS response in IL-4-pretreated BMDMs. Regulatory regions showing repressed (left) and not influenced (right) p65 binding are shown. Boxes encompass the 25thto 75thpercentile RPKMs. Whiskers extend to the 10thand 90thpercentiles.
(legend continued on next page)