A R T I C L E O p e n A c c e s s
The thiosemicarbazone Me 2 NNMe 2
induces paraptosis by disrupting the ER thiol redox homeostasis based on protein disul fi de isomerase inhibition
Sonja Hager 1,2, Katharina Korbula1,2, Björn Bielec2,3, Michael Grusch 1, Christine Pirker1, Markus Schosserer 4, Lisa Liendl4, Magdalena Lang4, Johannes Grillari4,5,6, Karin Nowikovsky7, Veronika F. S. Pape 8,9, Thomas Mohr1,10, Gergely Szakács1,9, Bernhard K. Keppler2,3, Walter Berger 1,2, Christian R. Kowol2,3and Petra Heffeter1,2
Abstract
Due to their high biological activity, thiosemicarbazones have been developed for treatment of diverse diseases, including cancer, resulting in multiple clinical trials especially of the lead compound Triapine. During the last years, a novel subclass of anticancer thiosemicarbazones has attracted substantial interest based on their enhanced cytotoxic activity. Increasing evidence suggests that the double-dimethylated Triapine derivative Me2NNMe2differs from Triapine not only in its efficacy but also in its mode of action. Here we show that Me2NNMe2- (but not Triapine)-treated cancer cells exhibit all hallmarks of paraptotic cell death including, besides the appearance of endoplasmic reticulum (ER)-derived vesicles, also mitochondrial swelling and caspase-independent cell death via the MAPK signaling pathway.
Subsequently, we uncover that the copper complex of Me2NNMe2 (a supposed intracellular metabolite) inhibits the ER-resident protein disulfide isomerase, resulting in a specific form of ER stress based on disruption of the Ca2+and ER thiol redox homeostasis. Ourfindings indicate that compounds like Me2NNMe2 are of interest especially for the treatment of apoptosis-resistant cancer and provide new insights into mechanisms underlying drug-induced paraptosis.
Introduction
α-N-Heterocyclic thiosemicarbazones (TSCs) are a promising class of therapeutics, which have been exten- sively investigated for their anticancer activity1,2. The most prominent and best-studied drug candidate is 3- aminopyridine-2-carboxaldehyde TSC, also known as Triapine. Triapine displayed promising results in clinical phase I and II trials against hematological cancers3–6and has also been tested against diverse solid tumors7,8. In
addition, several new TSC derivatives have been devel- oped over the last years. Two of them, namely Coti-2 and DpC, have recently entered clinical phase I trials (www.
clinicaltrials.gov). Coti-2, DpC as well as the predecessor Dp44mT showed highly improved anticancer activities compared to Triapine with IC50values in the nanomolar concentration range (hence, called "nanomolar TSCs")9,10. Our group has recently synthesized a new nanomolar TSC derivative, Me2NNMe2, characterized by dimethyla- tion of both primary amino groups of the Triapine molecule(Fig.1)2,11.
Based on promising clinical trials, it is of interest to better elucidate the reasons for the greatly improved anticancer activity of nanomolar TSCs. There are several indications that nanomolar TSCs differ in their mode of
© The Author(s) 2018
Open AccessThis article is licensed under a Creative Commons Attribution 4.0 International License, which permits use, sharing, adaptation, distribution and reproduction in any medium or format, as long as you give appropriate credit to the original author(s) and the source, provide a link to the Creative Commons license, and indicate if changes were made. The images or other third party material in this article are included in the article’s Creative Commons license, unless indicated otherwise in a credit line to the material. If material is not included in the article’s Creative Commons license and your intended use is not permitted by statutory regulation or exceeds the permitted use, you will need to obtain permission directly from the copyright holder. To view a copy of this license, visithttp://creativecommons.org/licenses/by/4.0/.
Correspondence: Petra Heffeter (petra.heffeter@meduniwien.ac.at)
1Institute of Cancer Research and Comprehensive Cancer Center, Department of Medicine I, Medical University of Vienna, Borschkegasse 8a, A-1090 Vienna, Austria
2Research Cluster“Translational Cancer Therapy Research”, Vienna, Austria Full list of author information is available at the end of the article.
Edited by: P. Salomoni
1234567890():,; 1234567890():,; 1234567890():,; 1234567890():,;
Fig. 1(See legend on next page.)
action from Triapine2,12,13. In particular, their interaction with intracellular copper ions might be important, as intracellularly formed copper complexes have been sug- gested to be the active metabolites of nanomolar TSCs12–14. In this regard, during our recent studies, we have dis- covered that treatment with Me2NNMe2 as well as Dp44mT resulted in the formation of perinuclear cyto- plasmic vesicles11that are characteristic for paraptosis, a recently described new type of programmed cell death15,16. Further hallmarks of paraptosis include mito- chondrial swelling and damage, caspase-independent cell death and the absence of membrane blebbing/DNA condensation or fragmentation. Moreover, disruption of endoplasmic reticulum (ER) homeostasis, activation of MAPK signaling as well as protection by the thiol- containing radical scavengerN-acetylcysteine (NAC) and the MEK inhibitor U0126 have been reported15,16. How- ever, the exact molecular mechanisms underlying para- ptosis induction are widely unexplored.
So far, mainly diverse natural compounds have been identified as paraptosis inducers. Interestingly, the list also includes some copper complexes17–19, supporting the idea that nanomolar TSCs could also induce this novel form of cell death. Therefore, in this study, we investigated the role of apoptotic and paraptotic cell death in the mode of action of Triapine and Me2NNMe2. Our experiments revealed that treatment with Me2NNMe2 induces all of the main hallmarks of paraptotic cell death. In addition, we identified the inhibition of the ER-resident protein disulfide isomerase (PDI) as a potential target of the intracellularly formed Me2NNMe2 copper metabolite.
Results
Anticancer activity of Triapine and Me2NNMe2
Cytotoxicity and morphological changes induced by Triapine and Me2NNMe2 were investigated in SW480 and HCT-116 cells at different time points (Fig. 1a). In general, HCT-116 cells proved to be more sensitive to TSC treatment than SW480. Moreover, in accordance with previous results11, double-dimethylation of Triapine resulted in markedly higher activity in a time-dependent manner. The two drugs had distinct effects on cell mor- phology, as shown in Fig. 1b, c. Especially, Triapine- treated cells were characterized by increased cell area (up to 500%) and flattening (Fig. 1c). In contrast, treatment with Me2NNMe2led to formation of cytoplasmic vesicles
(see black arrows in Fig. 1b), which dose- and time- dependently increased in size and number (Fig.1b, Suppl.
Figure 1). These observations were consistent in both cell lines. Comparable vesicle formation was also observed with the other nanomolar TSCs, DpC, Dp44mT, and Coti-2 (Suppl. Figure 2).
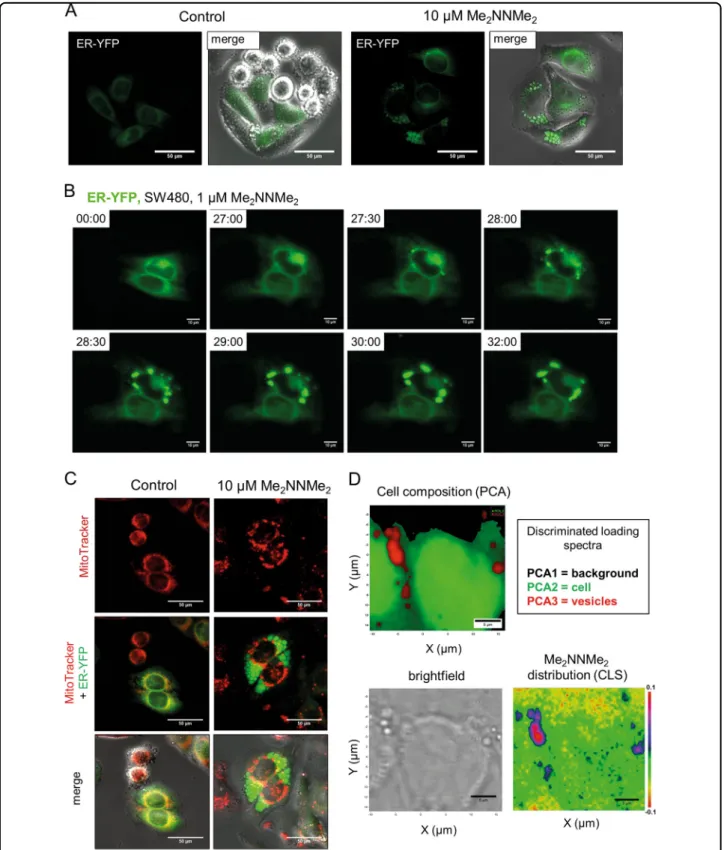
Me2NNMe2accumulation in the ER-derived vesicles Several groups have reported that paraptosis induction is associated with the appearance of cytoplasmic vesicles originating from the ER15,16. To investigate whether the cytoplasmic vesicles seen in Me2NNMe2-treated cells also arise from the ER, transfection experiments with ER- localized YFP were performed (Fig. 2a). As visualized by live-cell microscopy, ER-derived vesicles formed around the nucleus and rapidly increased in size (by fusion) (Fig. 2b). Moreover, no overlap of these vesicles with mitochondria or lysosomes was found (Fig.2c and Suppl.
Figure 3). Consequently, we concluded that the observed cytoplasmic vesicles after Me2NNMe2 treatment origi- nated solely from the ER.
Mapping cells by Raman microspectroscopy and sub- sequent principal component analysis (PCA) revealed a unique biochemical composition of these vesicles com- pared to the rest of the cell (Fig.2d). Component spectra suggested enrichment of lipids (bands at ~1295 cm−1, 1435–1480 cm−1, and ~1650 cm−1) in these vesicles, while bands corresponding to nucleic acids (~715 cm−1,
~775 cm−1, ~1090 cm−1, and ~1570 cm−1) were weaker compared to the rest of the cell (Suppl. Figure 4A)20. Furthermore, classical least squares (CLS) fitting of the spectrum of the pure substance (Suppl. Figure 4B) to the Raman map revealed that Me2NNMe2 appears to accu- mulate in these vesicles (Fig. 2d), indicating that the compound might have its intracellular target in the ER.
Impact of the TSCs on mitochondrial integrity
Paraptotic cell death is frequently associated with changes of mitochondrial morphology and function- ality21–27. Consequently, JC-1 staining was conducted to evaluate the impact of both drugs on mitochondrial membrane potential. Upon treatment with Triapine, only slight, non-significant effects were detected in both cell lines (Fig.3a), while Me2NNMe2had a profound impact.
In detail, in SW480 cells, at all investigated concentrations
~10% of the cells displayed depolarized mitochondria. In
(seefigure on previous page)
Fig. 1 Activity of Triapine and its derivative Me2NNMe2. aTime-dependent cell viability of SW480 and HCT-116 cells treated with either Triapine or Me2NNMe2, determined by MTT assay after 24, 48, and 72 h. Values given in the graph are the mean ± standard deviation of triplicates from one representative experiment out of three, normalized to the untreated control of the same time-point. IC50values (µM) ± standard deviations (SD) are given in the table .bMorphological changes in SW480 cells induced by 24 and 48 h treatment with the indicated concentrations of Triapine or Me2NNMe2. Cytoplasmic vacuoles were mainly seen with Me2NNMe2(arrows). Scale bar: 100 µm.cIncrease in cell size of SW480 and HCT-116 cells treated with the indicated concentrations of Triapine and Me2NNMe2for 48 h
Fig. 2 Me2NNMe2accumulation in the ER-derived vesicles. aRepresentativefluorescence microscopy images and overlaid differential interference contrast images of the ER lumen of ER-YFP-transfected SW480 cells treated with 10 µM Me2NNMe2for 24 h (scale bar: 50 µm).bLife-cell fluorescence imaging of ER-located YFP-transfected SW480 cells treated with 1 µM Me2NNMe2. Time after treatment is indicated as hh:mm (scale bar:
10 µm).cRepresentativefluorescence microscopy images of mitochondria (MitoTracker) showing no overlap with vesicles in ER-YFP-transfected SW480 cells treated with 10 µM Me2NNMe2. (scale bar: 50 µm).dRaman microspectroscopy of SW480 cells treated with 10 µM Me2NNMe2for 24 h.
Principal component analysis (PCA) of Raman spectra can differentiate between background (black), cell (green) and vesicles (red). CLSfitting of Me2NNMe2Raman spectrum to the spectral map of the cell revealed accumulation of the drug inside the vesicles
Fig. 3(See legend on next page.)
contrast, 30% of HCT-116 cells showed mitochondrial depolarization at 0.05 and 0.1 µM Me2NNMe2, which decreased to about 10% at higher concentrations. In parallel to mitochondrial depolarization, Me2NNMe2, but not Triapine, induced mitochondrial fragmentation or swelling (a main hallmark of paraptosis) already at 0.1 µM (Suppl. Figure 5). In order to investigate whether this observed swelling is accompanied by increased intra- mitochondrial Ca2+ levels, Rhod-2 AM stains were per- formed. Indeed, distinct accumulation of mitochondrial Ca2+ together with organelle swelling was observed in Me2NNMe2-exposed cells (Fig. 3b). In contrast, thapsi- gargin, a well-known SERCA (ER-localized Ca2+ATPase) inhibitor and ER stress inducer, initiated mitochondrial Ca2+ accumulation but no organelle swelling. Together with the lack of organelle swelling, Triapine had also no impact on mitochondrial Ca2+levels (Fig. 3b).
In agreement with the suggested contribution of mito- chondria to Me2NNMe2 activity, HCT-116 cells with a BAX knockout18 were (in contrast to Triapine) sig- nificantly less sensitive to the methylated derivative (Fig. 3c). Interestingly, Me2NNMe2 activity was accom- panied by a decrease of both pro-apoptotic BAX as well as anti-apoptotic Bcl-xL protein levels in BAX wild-type cells, which argues against induction of apoptosis via the intrinsic (mitochondrial) pathway (Fig. 3d). Taken toge- ther, this indicates that Me2NNMe2distinctly impacts on mitochondrial integrity already at very low drug con- centrations and disruption of mitochondrial Ca2+home- ostasis is a key event in Me2NNMe2-induced paraptosis.
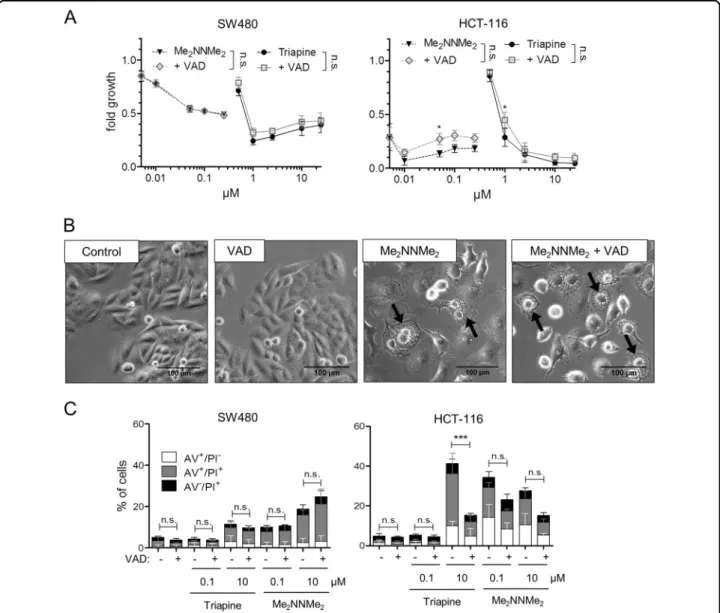
Caspase independence of Me2NNMe2anticancer activity As paraptosis is often described as a caspase-indepen- dent process15,16, as a next step the impact of the pan- caspase inhibitor z-VAD-FMK on the activity of the two TSCs was investigated. As shown in Fig.4a, there was no relevant effect of z-VAD-FMK on the anticancer activity of the tested TSCs, in contrast to TRAIL, which was used as a positive control (Suppl. Figure 6). In addition, treat- ment with the pan-caspase inhibitor did not prevent the formation of cytoplasmic vesicles induced by Me2NNMe2
(Fig. 4b). To confirm the caspase independence of Me2NNMe2-induced cell death, annexin V (AV) stains
were performed in the presence and absence of the pan- caspase inhibitor (Fig. 4c). Caspase inhibition had no significant impact (calculated to control by one-way ANOVA and Bonferroni’s multiple comparison test) on the AV+cell fractions after Me2NNMe2treatment in both cell lines. In contrast, Triapine-induced cell death in HCT-116 was strongly diminished upon addition of z- VAD-FMK, suggesting cell line-dependent apoptosis induction by this compound.
The role of MAPKs in Me2NNMe2-induced paraptosis There are indications that MAPK signaling plays an important role in the execution of paraptotic cell death16,28. However, whether and how Me2NNMe2
activity impacts on this pathway is so far unknown.
Consequently, as a first step, we compared gene sig- natures of whole-genome gene expression arrays per- formed with 0.1 µM and 1 µM Me2NNMe2 treatment or untreated cells. Gene set enrichment analysis (GSEA) of these data showed significant upregulation of MAPK signaling pathway genes in treated as compared to untreated cells at both concentrations (Fig. 5a). A more detailed illustration of the genes up- (red) or down- (blue) regulated in this KEGG pathway is shown in Fig. 5b.
When comparing these mRNA data with Western blot analysis of MEK and ERK, interestingly, both Triapine and Me2NNMe2 treatment had a tendency to stimulate the MAPK signaling at higher drug concentrations (Fig. 5c).
However, at lower doses strongly reduced phosphoryla- tion (especially of MEK1/2) was observed, indicating that stimulation of the MAPK pathway could be due to a compensatory feedback loop.
To gain more insight into the role of the MAPK path- way in the activity of our TSCs, several MEK inhibitors (U0126, PD98058, trametinib, and selumetinib) with dif- ferent affinities for MEK1 and MEK2 were used. As seen in Fig.6a and Suppl. Table 1, all inhibitors were able to protect cells against Me2NNMe2-induced cytotoxicity.
However, only U0126 distinctly reduced vesicle formation in Me2NNMe2(Fig.6b, c). The effects of U0126 were also confirmed in HCT-116 cells (data not shown). In contrast to Me2NNMe2, Triapine activity was largely unaffected by the MEK inhibitors. As U0126 is the only inhibitor that
(seefigure on previous page)
Fig. 3 Mitochondrial involvement in the activity of Triapine and Me2NNMe2. aMitochondrial membrane potential depolarization measured by the percentage of cells with decreased JC-1fluorescence (red). SW480 or HCT-116 cells were treated with the indicated concentrations of Triapine or Me2NNMe2
for 24 h. Values given are the mean ± standard deviation of three independent experiments.bFluorescence microscopy of increased calcium levels (Rhod-2 AM in red) specifically in the mitochondria (MitoTracker in green) after thapsigargin (Tg, 1 µM), Me2NNMe2(0.1 µM) or Triapine (1 µM) treatment of SW480 cells for 48 h (scale bar: 50 µm). White arrows indicate co-localization.cCell viability of HCT-116 wild-type (wt) and BAX knockout (KO) cells measured by MTT after 72 h treatment with indicated concentrations of Triapine or Me2NNMe2. Values given are the mean ± standard deviation of triplicates of one representative experiment out of three.dWestern blot analysis of BAX and Bcl-xLexpressed by SW480 and HCT-116 cells treated with Triapine or Me2NNMe2
for 24 or 48 h. The ratio of BAX to Bcl-xLis given below the respective bands.β-actin was used as a loading control. Significance was calculated to control with one-way (a) and to wt cells with two-way (c) ANOVA and Bonferroni’s multiple comparison test (***p< 0.001, **p≤0.01, *p≤0.05)
inhibits MEK1 and 2 to a similar extent (while the others have a stronger preference for MEK1), we hypothesized that MEK2 could have a special role in Me2NNMe2
activity. To further evaluate this hypothesis, knockdown experiments using siRNA against MEK2 were performed (Fig. 6d). Indeed, further analysis revealed that Me2NNMe2-induced vacuolization decreased upon MEK2 knockdown (Fig.6e, f) confirming the importance of this protein in the formation of paraptotic vesicles by Me2NNMe2. Noteworthy, also induction of vesicles and
anticancer activity of other nanomolar TSC (DpC, Dp44mT, and Coti-2) could be inhibited by U0126 (Suppl.
Figure 7), indicating induction of paraptotic cell death also with these TSCs.
Me2NNMe2-induced ER stress based on disturbed ER thiol redox homeostasis
So far, there are only a few hypotheses on the exact mechanisms underlying paraptosis induction. In case of natural products, especially proteasome inhibition
Fig. 4 Induction of different cell death characteristics by Triapine and Me2NNMe2. aCell viability measured by MTT assay of SW480 and HCT- 116 cells after 72 h treatment with the indicated concentrations of Triapine (full lines) or Me2NNMe2(dotted lines) alone or in combination with 10 µM z-VAD-FMK (VAD, gray lines). Values given are the mean ± standard deviation of triplicates from one representative experiment out of three.
bPhase-contrast microscopy images of SW480 cells treated with 10 µM Me2NNMe2or 25 µM z-VAD-FMK as well as the combination (scale bar: 100 µm).cPercentage of annexin V-positive (AV+) and/or PI+SW480 or HCT-116 cells detected byflow cytometry after 48 h of Triapine or Me2NNMe2
treatment in combination with 10 µM z-VAD-FMK (VAD). Values given are the mean ± standard deviation of three independent experiments. For calculation of significance AV+cell fractions (AV+/PI−, AV+/PI+) were added. Significance to control was calculated by two-way (a) or one-way (c) ANOVA and Bonferroni’s multiple comparison test using GraphPad Prism software (***p< 0.001, **p≤0.01, *p≤0.05)
Fig. 5(See legend on next page.)
resulting in (unfolded) protein stress has been sug- gested16,29. Consequently, paraptosis induction by such drugs is often dependent on active protein synthesis.
However, inhibition of protein synthesis (by cyclohex- imide) had no impact on the activity of Me2NNMe2and no difference was observed in the impact on protein ubiquitination levels between Triapine and Me2NNMe2
(data not shown), suggesting another mode of action.
Based on ER localization of Me2NNMe2 in the Raman microscopy studies together with the profound ER bleb- bing, we hypothesized that Me2NNMe2 might have a target in this organelle. In line with this hypothesis, sub- sequent experiments confirmed a specific form of ER stress especially in Me2NNMe2-treated cells. In more detail, Me2NNMe2(but not Triapine) treatment resulted in enhanced nuclear localization of CHOP, an ER stress- induced transcription factor, (Fig.7a and Suppl Figure 8) together with increased phosphorylation of its upstream activator PERK (Fig.7b). In contrast, no changes in other ER stress markers, such as BiP, IRE1α, calnexin, or changes in the phosphorylation of eIF2-αwere detected.
Remarkably, in contrast to thapsigargin, CHOP-regulated ero1L-α(an ER-specific thiol oxidase) as well as the ER- localized chaperone, isomerase and thiol oxidoreductase PDI were upregulated by both Triapine and Me2NNMe2
(Fig. 7b). Moreover, our array data showed that the expression of these proteins was also increased on mRNA level upon Me2NNMe2 treatment (Fig. 7c), indicating increased gene transcription of these CHOP-target genes.
Interestingly, there are reports that PDI is able to bind and reduce copper (although the impact of copper bind- ing on the enzymatic activity is not fully characterized)30. As Me2NNMe2has strong copper-binding properties and our previous studies already indicated that addition of copper strongly increases the activity of Me2NNMe211
, we hypothesized that our drug or its copper metabolite interferes with the functionality of PDI. Subsequently performed enzyme inhibition assays revealed that, indeed, the copper complex of Me2NNMe2(but not of Triapine) had strong PDI-inhibitory potential (Fig.7d). Noteworthy, the metal-free drugs did not inhibit the enzyme, even at high concentrations, suggesting that prior (intracellular) copper chelation is necessary for PDI inhibition. Similar activity was also detected with the copper complexes of DpC and Dp44mT (Suppl. Figure 9).
PDI plays a key role in the ER thiol redox homeostasis by forming and rearranging disulfide bonds during pro- tein folding. In this process, PDI oxidizes unfolded target proteins with the help of oxidized thiol-containing molecules, such as GSSG or ero1L-α, thereby resulting in the reduction of these molecules31. To gain more insight into the role of the ER thiol redox homeostasis in the mode of action of Me2NNMe2, co-incubation experiments with the thiol-containing antioxidants NAC and 1-thioglycerol were performed. Indeed, both com- pounds protected the cells from Me2NNMe2 (but not Triapine)-induced cytotoxicity (Fig. 7e and Suppl. Fig- ure 10). In addition, NAC also reduced anticancer activity induced by DpC, Dp44mT and Coti-2 (Suppl. Figure 7C).
Noteworthy, these Me2NNMe2-induced effects were not based on enhanced global superoxide (Fig. 7f) or ROS11 levels but coincided with increased glutathione and especially GSSG levels (Fig. 7g). This suggests that nanomolar TSCs induce either a very local, organelle specific form of ROS or ROS generation does not play a major role in their anticancer activity.
Taken together, these results indicate that Me2NNMe2
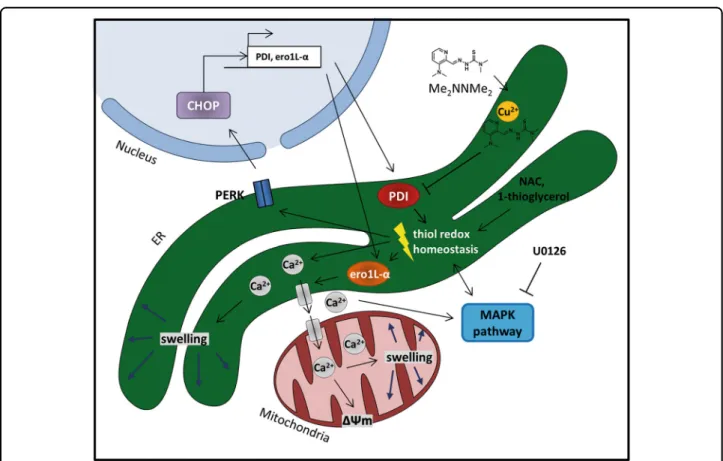
might form an intracellular copper metabolite with PDI- inhibitory properties, which then results in disturbed ER thiol redox balance and paraptosis induction. The pro- posed mode of action is shown in Fig.8.
Discussion
In anticancer therapy, resistance of cancer cells to apoptosis is a major obstacle to successful treatment and the cause of many cancer-associated deaths32. Targeting cancer cells by the induction of paraptosis, a recently discovered alternative caspase-independent cell death pathway15,16, offers the opportunity to overcome apop- tosis resistance. However, the mechanisms of paraptosis are still not fully understood (and sometimes even con- tradictory observations have been published16,33), making the in-depth investigation of the underlying signaling pathways of high importance. In general, there are several main hallmarks of paraptosis that are widely accepted.
Among these, cytoplasmic (ER-derived) vacuolization, mitochondrial swelling/damage, caspase independence together with absence of membrane blebbing as well as DNA condensation/fragmentation, disruption of ER homeostasis, activation of MAPK signaling, protection by
(seefigure on previous page)
Fig. 5 Role of the MAPK pathway in the activity of Triapine and Me2NNMe2. aGSEA from whole-genome gene expression data revealed significant enrichment of genes in the“MAPK signaling pathway”gene set in SW480 cells treated with 0.1 or 1 µM Me2NNMe2compared to untreated cells. Normalized enrichment score (NES) and false discovery rate (FDR) are given.bIllustration of genes up- (red) or down-regulated (blue) in the KEGG-derived“MAPK signaling pathway”of Me2NNMe2(1 µM)-treated compared to untreated SW480 cells using whole-genome gene expression data.cWestern blot analysis of MEK1/2 and ERK1/2 as well as their phosphorylated protein levels in SW480 and HCT-116 cells treated with indicated concentrations of Triapine and Me2NNMe2for 24 h.β-actin was used as a loading control
Fig. 6(See legend on next page.)
NAC and U0126 as well as protein synthesis dependence are most prominent15,16.
So far, mainly natural compounds, such as celastrol, curcumin or cyclosporine A, were found to induce para- ptosis16. In addition, a few synthetic drugs, including some copper complexes17,19, have been studied. Here, for the first time, we report about paraptosis induction by TSCs.
Initiated by the discovery that treatment with nanomolar TSCs, such as Me2NNMe2 and Dp44mT, resulted in for- mation of prominent cytoplasmic vesicles11, our aim in the here presented study was to investigate whether treatment with Me2NNMe2results in paraptosis or a paraptosis-like cell death. Therefore, we have investigated different pathways and organelles involved in (apoptotic) cell death and paraptosis. Through this approach, we found that indeed Me2NNMe2induced paraptotic cell death fulfilling several main hallmarks such as swelling of ER and mito- chondria, caspase independence and MAPK activation (probably via MEK2 signaling).
Interestingly, Raman microscopy experiments revealed an accumulation of Me2NNMe2 in the ER-derived vesi- cles, suggesting that this compound might directly inter- fere with ER-resident proteins. Subsequent investigations revealed that Me2NNMe2 treatment indeed induced a specific form of ER stress. In detail, enhanced nuclear localization of CHOP and PERK phosphorylation were detected. Beside these typical ER stress markers, we additionally observed an upregulation of ero1L-αand PDI, which are both involved in the ER thiol redox home- ostasis34. Here, especially PDI attracted our attention, as it has been recently described as a copper-binding and -reducing protein30. This is of relevance as Me2NNMe2
(and other nanomolar TCSs like DpC and Dp44mT) have been well characterized for their metal-chelating proper- ties and especially formation of an intracellular copper metabolite has been suggested to be crucial for their anticancer activity2,11,12,35,36
. Thus, the PDI-inhibitory potential of Triapine, Me2NNMe2 as well as their cop- per complexes was investigated. Indeed, the copper complexes of Me2NNMe2 as well as those of DpC and
Dp44mT were able to potently inhibit the enzyme, while the Triapine copper complex as well as the ligands alone were inactive in this assay. Further evidence connecting TSCs to PDI as a potential target can be seen in the overexpression of the PDI family member CaBP1 in a L1210 cell subline selected for resistance to 4-methyl-5- amino-1-formylisoquinoline TSC (MAIQ)37. Although this suggests an important role of this protein class in the mode of action of at least some TSCs, no further studies on this topic have been performed so far. Consequently, the exact evaluation of the mechanisms resulting in the PDI inhibition by some copper TSCs is matter of cur- rently ongoing investigations.
In agreement with the PDI inhibition, subsequent ana- lysis showed that Me2NNMe2treatment led to an increase of total glutathione levels, especially of its oxidized form (GSSG) and co-incubation with thiol-containing anti- oxidants such as NAC or 1-thioglyerol had protective effects. A disrupted thiol redox homeostasis would also explain the enhanced levels of PERK phosphorylation and subsequent CHOP translocation into the nucleus, as seen upon Me2NNMe2 treatment38,39. CHOP in turn is a transcription factor, which can initiate the observed increased expression of (among others) PDI and ero1L- α40–42. In general, disruption of the ER thiol redox homeostasis has already been discussed as the cause of ER stress and dilation for other paraptotic inducers16,28,43. To the best of our knowledge, this is the first report con- necting the induction of paraptosis to the inhibition of ER-resident proteins. Thus, the role of ER enzyme inhi- bition definitely needs to be addressed in detail in further studies.
With regard to the paraptotic signaling process, the observed thiol-based ER stress is in good agreement with the mitochondrial changes observed after Me2NNMe2
treatment, as it has already been shown that an altered thiol balance leads to Ca2+ release from the ER and its uptake by the mitochondria44,45. Thus, mitochondria are proposed to function as a buffer system by absorbing released Ca2+46. However, prolonged occurrence of
(seefigure on previous page)
Fig. 6 MEK1/2 inhibition affects Me2NNMe2-induced cell death. aImpact of MEK1/2 inhibitors U0126 (5 µM), PD98058 (5 µM), selumetinib (50 nM) or trametinib (100 nM) on viability of Triapine- or Me2NNMe2-treated SW480. Change in viability is given as mean fold IC50value increase ± standard deviation compared to Triapine or Me2NNMe2treatment alone, measured by three independent MTT viability experiments.b
Representative phase-contrast microscopy images of SW480 cells treated with Me2NNMe2(10 µM) and U0126 (20 µM) or PD98058 (10 µM) as well as the combinations for 48 h (scale bar: 100 µm).cPercentage of vacuolated cells counted from phase-contrast microscopy images seen inb. Values given are the mean ± standard deviation of three images with at least 30 cells in total. Significance to single treatment was calculated by one-way ANOVA and Bonferroni’s multiple comparison test (***p< 0.001, **0.001≥p≤0.01, *0.01≥p≤0.05).dProtein expression detected by Western blot of MEK2, MEK1/2, and ERK1/2 in SW480 and HCT-116 cells after 48 h gene silencing with scrambled (siSCR) or MEK2 (siMEK2) siRNA.β-actin was used as a loading control.eRepresentative images of SW480 cells transfected with siSCR or siMEK2 and treated with 10 µM Me2NNMe2for 24 h (scale bar:
100 µm).fPercentage of cell vacuolization of SW480 or HCT-116 cells transfected with siSCR or siMEK2 and treated with the indicated concentrations of Me2NNMe2for 24 h. Values given are the mean ± standard deviation of several regions of two experiments. Significance to siSCR was calculated by Student'sT-test (***p< 0.001, **p≤0.01)
Fig. 7(See legend on next page.)
enhanced mitochondrial Ca2+ levels ultimately results in organelle swelling and damage, which explains the excessive depolarization of mitochondria induced by Me2NNMe2 and many other paraptosis inducers25,27.
Noteworthy, we found that BAX knockout resulted in reduced sensitivity to Me2NNMe2. This could be explained by previously observed lowered ER Ca2+stores in BAX-deficient cells, which led to reduced Ca2+uptake
Fig. 8 Proposed mechanism of Me2NNMe2-induced paraptosis.Me2NNMe2accumulates in the ER, where it inhibits the reductive potential of PDI. This leads to the disruption of the ER thiol redox homeostasis, which in turn activates PERK signaling and release of Ca2+ions from the ER. While PERK activation is followed by CHOP translocation into the nucleus and increased transcription of PDI and ero1L-α, released Ca2+ions are taken up by mitochondria. Prolonged Ca2+imbalance initiates organelle swelling and mitochondrial membrane depolarization. NAC and 1-thioglycerol can ameliorate thiol redox imbalances. MAPKs further regulate Ca2+and thiol redox homeostasis, which can be inhibited by U0126
(seefigure on previous page)
Fig. 7 ER stress and disruption of thiol redox homeostasis by Me2NNMe2treatment. aQuantification of immunofluorescence intensities in the nucleus of the ER stress marker CHOP in SW480 and HCT-116 cells treated with 1 µM thapsigargin (Tg), 1 µM Triapine or 0.1 and 1 µM Me2NNMe2for 24 h. Values given are the mean intensities ± the interquartile range and 10 and 90 percentile whiskers of one representative experiment out of three.
bWestern blot analysis of various ER stress proteins expressed by SW480 cells treated with indicated concentrations of Triapine and Me2NNMe2for 24 h.β-actin was used as a loading control and Tg (1 µM) as positive control for ER stress.cmRNA expression levels for PDI (P4HB) and ero1L-α (ERO1A) in treated (1 µM Me2NNMe2) or untreated SW480 cells were assessed by whole-genome gene expression microarrays. Two independent P4HB oligonucleotides were spotted on the array and gave comparable results. Data for oligonucleotide A_23_P107412 is shown. Normalized values of four replicates indicate upregulation of PDI and ero1L-αmRNA in treated compared to untreated cells.dPDI reduction activity in the presence of Triapine, Me2NNMe2as well as their copper complexes was measured by PROTEOSTAT PDI assay kit. Bacitracin (1 mM) was used as a positive PDI inhibition control. Values given are the mean ± standard deviation of triplicates of one representative experiment out of two.eCell viability measured by MTT assay of SW480 or HCT-116 cells after 72 h treatment of indicated concentrations of Me2NNMe2alone as well as in combination withN- acetylcysteine (NAC) or 1-thioglycerol. Values given are the mean ± standard deviation of triplicates of one representative experiment out of three.f Superoxide production measured byflow cytometry of DHEfluorescence in HL-60 cells treated with indicated concentrations of Triapine and Me2NNMe2for 45 min. Antimycin A (AMA) was used as positive control.gDetection of total and oxidized glutathione (GSSG) by fold increase to control of luminescence in SW480 cells treated with indicated concentrations of Triapine and Me2NNMe2for 24 h. Significance to control (or CuCl2) was calculated with one-way ANOVA and Dunnett’s multiple comparison test (***p< 0.001, **p≤0.01, *p≤0.05)
by mitochondria after release from the ER47. In addition, also a link between PDI and BAX/BAK signaling has already been reported48. Nevertheless, why this mito- chondrial damage in the course of paraptosis does not activate the intrinsic (mitochondrial) pathway of apopto- sis is still a matter of discussion and warrants further investigations.
Taken together, in the here presented study, we identified paraptosis induction via disruption of the ER thiol redox homeostasis as a new mode of action in the activity of the highly active nanomolar TSC Me2NNMe2
and possibly also for other nanomolar TSCs such as DpC, Dp44mT, and Coti-2. Moreover, we suggest the ER-resident PDI as possible new target for members of this compound class, which could make them interest- ing candidates for the treatment of cancers with defi- ciencies in apoptosis induction.
Materials and methods Reagents
Triapine and Me2NNMe2 were synthesized as pre- viously described11,49. U0126 was purchased from Cal- biochem, z-VAD-FMK from Enzo Life Sciences (New York, USA), 1-thioglycerol, thapsigargin, antimycin A, NAC, PD98059, trametinib and selumetinib from Selleck Chemicals (TX, USA). All other chemicals were from Sigma-Aldrich.
Cell culture
The following human cell models were used in this study: the colon carcinoma cell lines SW480 (obtained from the American Tissue Culture Collection) as well as HCT-116 and its respective subline with BAX knockout (obtained from B. Vogelstein, John Hopkins University, Baltimore18). SW480 cells were cultured in MEME and HCT-116 cell lines in McCoy’s 5a Medium (from Sigma- Aldrich, MO, USA). The cells were cultivated in medium containing 10% fetal calf serum (FCS, PAA, Linz, Austria).
Transfection
SW480 cells were plated (3 × 10⁵ cells/well) in 6-well plates and allowed to recover for 24 h. Transfection of pEYFP-ER expression plasmid (#632355, Clontech laboratories, USA) encoding a YFP fused to the ER- targeting sequence of calreticulin at the 5′-end and the ER retention sequence KDEL at the 3′-end or with a control plasmid was performed using Lipofectamine 2000 reagent (Invitrogen, CA, USA) according to the manufacturers’
instructions. Medium was changed after 5 h and selection medium containing 1.2 mg/ml G418 was added 24 h after transfection. Expression of YFP in the ER was investigated 48 h later.
Cell viability assay
The cells were plated (2 × 10³ cells/well) in 96-well plates and allowed to recover for 24 h. Then, cells were treated with Triapine or Me2NNMe2. In combination treatments, the modulator was always added 1 h in advance. Cell viability was measured by the 3-(4,5-dime- thylthiazol-2-yl)-2,5-diphenyltetrazolium bromide (MTT)-based vitality assay (EZ4U; Biomedica, Vienna, Austria) as published50. GraphPad Prism software was used to calculate cell viability expressed as IC50 values calculated from full dose-response curves.
Fluorescence staining and microscopy
Cells were seeded into 8-well μ-slides (ibidi GmbH, Germany) with 2 × 10⁴ cells/well and left to recover for 24 h. For organelle tracking, the medium was replaced with serum- and phenol red-free medium with 50 nM MitoTracker Red CMXRos, MitoTracker Green FM or LysoTracker Red (Life technologies, Vienna, Austria).
For calcium imaging, cells were incubated with 0.5 µM Rhod-2 AM (Abcam, Cambridge, UK) in serum- and phenol red-free medium for 30 min at 4 °C. After 1 h, cells were washed and imaged with the Nikon Eclipse Ti-e fluorescence microscope with differential inter- ference contrast and RFP or GFP filter settings and a sCMOS pco.edge camera. Life-cell imaging was per- formed in an environmental chamber pre-heated to 37 ° C with 5% CO2. For non-fluorescence imaging, phase- contrast pictures were taken with the Nikon Eclipse Ti inverted microscope with a Nikon DS-Fi1c camera.
Contrast and brightness were adjusted with ImageJ. Cell area was calculated as mean occupied area per cell from at least two different sections in one well at the end of life-cell imaging (48 h) using ImageJ and then normal- ized to control.
CHOP immunofluorescence
Cells (2 × 10⁴/well) were seeded in 8-well chamber slides (ibidi GmbH). After 24 h recovery, cells were trea- ted with indicated drug concentrations andfixed with 4%
paraformaldehyde for 15 min at room temperature and (after washing with PBS) blocked and permeabilized with 5% FCS, 0.3% Triton X-100 in PBS for 1 h. The primary antibody CHOP (Cell Signaling Technology) was added 1:3200 in 1% BSA and 0.3% Triton X-100 in PBS over- night at 4 °C. After washing with PBS, the cells were incubated with anti-mouse secondary antibody con- jugated to AlexaFluor488 (Thermo Fisher, 1:500 in 1%
BSA and 0.3% Triton X-100 in PBS) for 1 h. Cells were again washed and counterstained with 4′,6-diamidine-2′- phenylindole dihydrochloride (DAPI; 1 µg/ml) and wheat germ agglutinin (WGA, 10 µg/ml, Vector Laboratories,
CA, USA) in PBS for 10 min. The dyes were removed, and the cells mounted in Vectashield mounting medium (Vector Laboratories, CA, USA) with a coverslip. Images were taken with a Zeiss LSM 700 Olympus (Carl Zeiss AG, Oberkochen, Germany) confocal microscope and CHOP fluorescence intensities per nucleus were mea- sured using ImageJ.
Annexin V/PI stain and detection of mitochondrial membrane potential
Briefly, 2 × 10⁵ cells/well were seeded in 6-well plates.
After 24 h recovery, cells were treated for another 24 h with the indicated drug concentrations. Then, cells were either stained with annexin V-APC (AV) and propidium iodide (PI) or with 10 µg/ml JC-1 as previously described51,52.
Protein expression
After drug treatment, total protein lysates were pre- pared, separated by SDS-PAGE and transferred onto a polyvinylidene difluoride membrane for Western blotting as described previously50. The following antibodies were used: Cell Signaling Technology (MA, USA): BAX (#5023), Bcl-xL (#2764), PERK (#5683), phospho-PERK (Thr980, #3179), Calnexin (#2679), eIF2-α (#5324), phospho-eIF2-α (Ser51, #3398), PDI (#3501), ero1L-α (#3264), BiP (#3177), IRE1α (#3294), MEK1/2 (#9126), phospho-MEK1/2 (Ser217/221, #9154), MEK2 (#9125) ERK1/2 (#4695), phospho-ERK1/2 (Thr202/Tyr204,
#4370). Sigma-Aldrich:β-actin (AC-15; #A1978). Primary antibodies were used 1:1000. Secondary, anti-mouse (#7076) and anti-rabbit (#7074) horseradish peroxidase- labeled antibodies from Cell Signaling Technologies were used in working dilutions of 1:10,000.
Gene knockdown by siRNA
Cells were transfected with XfectTMRNA Transfection Reagent (Clontech Laboratories, CA, USA) using siRNA against MEK2 (Dharmacon, #M-003573-03-0005) or non- targeting siRNA (Dharmacon, #D-001206-13-05) follow- ing the manufacturer’s recommendations. Briefly, 3 × 10⁵ SW480 cells/well or 4 × 10⁵ HCT-116 cells/well were seeded in 6-well plates. After 24 h cells were incubated with the siRNAs and transfection polymer in serum-free medium for 4 h. Then, the medium was exchanged and after another 24 or 48 h cells were collected for experi- ments. Efficacy and specificity of gene silencing was ver- ified at the protein level by Western blot following 48 h siRNA transfection.
Total-RNA isolation and whole-genome gene expression array
Total RNA from SW480 cells (either untreated or treated for 15 h) was isolated using RNeasy Mini kit
(Quiagen) following the manufacturer’s instruction.
Transcriptional profiles of cells were determined per- forming a 4 × 44 K whole-genome oligonucleotide gene expression array (Agilent) as described previously53. Normalization was performed in R using the Bio- conductor (version 3.7) package “limma”54. Whole- genome gene expression array and gene set enrichment analysis (GSEA) were performed as previously descri- bed51. Visualization of differentially expressed genes in the KEGG database-derived “MAPK signaling pathway” was conducted using the Bioconductor package
“pathview”55.
Raman microspectroscopy
Cells (2 × 10⁴ /well) were seeded into 8-well μ-slides with glass-bottom (ibidi GmbH, Germany) and left to recover for 24 h followed by 24 h drug treatment. Sub- sequently, samples werefixed with 2% formaldehyde in PBS for 5 min. Cells were mapped in PBS using an XploRA INV Raman microscope (Horiba Jobin Yvon, Bensheim, Germany) equipped with a 532 nm solid state laser at 100 mW, 1800 gr/mm grating and CFI Plan APO
×100 NA 1.4 Oil objective (Nikon). Two spectra per pixel were acquired with an integration time of two seconds in steps of 0.5 µm in X and Y. Cosmic rays were removed automatically. The spectralfingerprint region of 600–1800 cm−1 was extracted from raw spectra, the 1st derivative (size=5, degree=1) was calculated and unit vector normalization was performed. Principal component analysis (PCA) with three components was computed and displayed as a spectral map. Component spectra were shifted on the intensity scale for better visualization. The spectrum of Me2NNMe2 powder was acquired using the 532 nm laser at 100 mW, 2400 gr/
mm grating, CFI Apo Lambda S ×40 NA 1.15 Water objective (Nikon) with 4 × 5 s integration and processed as described above. The processed spectrum of Me2NNMe2wasfitted to the spectral map of the cells by using the CLS function. All calculation and visualization steps were performed in LabSpec 6 (Horiba, Jobin Yvon, Bensheim, Germany).
PDI reduction activity measurement
PDI reduction activity was measured using PROTEO- STAT PDI assay kit (#ENZ-51024, Enzo Life Sciences, Lausen, Switzerland). Experiments were performed according to the manufacturer’s instructions. Briefly, drugs alone or preincubated with CuCl2(1:1) were added to a prepared insulin PDI solution. Then, DTT was added to start PDI reduction activity. After 30 min the reaction was stopped by the Stop reagent and the insulin pre- cipitate was fluorescently labeled with Proteostat PDI detection reagent for 15 min. Fluorescence intensity was measured at 500 nm excitation and 603 nm emission
using the spectrophotometer Tecan infinite 200Pro (Tecan Group, Männedorf, Switzerland).
Glutathione measurement
Cells were plated (4 × 10³ cells/well) in 96-well plates and allowed to recover for 24 h. Then, cells were treated in sextuplicates with Triapine or Me2NNMe2for another 24 h. Cells were lysed and levels of total and oxidized glutathione were measured in triplicates with GSH/
GSSG-GloTM Assay (#V6611, Promega, Madison, USA) according to the manufacturer’s instructions. Fold increase in relative luminescence units (RLU) was calcu- lated compared to untreated control after subtraction of cell-free blank.
Detection of intracellular superoxide
Dihydroethidium (DHE, #D7008, Sigma-Aldrich, MO, USA) was used to detect the production of intracellular superoxide. Briefly, 5 × 10⁵HL-60 cells per sample in 500 μl of PBS (78.1 mM Na2PO4× 2 H2O, 14.7 mM KH2PO4, 26.8 mM KCl, 1.37 M NaCl) were incubated with indi- cated concentrations of Triapine and Me2NNMe2for 45 min. Subsequently, DHE (10 µM) was added 15 min after the compounds. After incubation, the meanfluorescence intensity was measured by flow cytometry using a FACSCalibur instrument (Becton Dickinson, Palo Alto, CA, USA). Antimycin A (AMA, 10 µM) was used as positive control.
Acknowledgements
This work was performed within the Research Cluster“Translational Cancer Therapy Research”Vienna. This work was in part funded by the Austrian Science Fund (FWF) grant number P22072 (to Walter Berger), number P31923 (to Christian R. Kowol) and number P26603 (to Petra Heffeter). The funding sources had no involvement in collection, analysis and interpretation of data as well as in the decision to submit the article for publication. S.H. is a recipient of a DOC Fellowship of the Austrian Academy of Sciences. We are indebted to Sushilla van Schoonhoven and Mirjana Stojanovic for competent technical assistance. Furthermore, we are grateful to Irene Herbacek forfluorescence- activated cell sorting analysis and Gerald Timelthaler for the assistance in confocal microscopy. We thank the BOKU-VIBT Imaging Center for technical support with Raman microspectroscopy.
Author details
1Institute of Cancer Research and Comprehensive Cancer Center, Department of Medicine I, Medical University of Vienna, Borschkegasse 8a, A-1090 Vienna, Austria.2Research Cluster“Translational Cancer Therapy Research”, Vienna, Austria.3Institute of Inorganic Chemistry, Faculty of Chemistry, University of Vienna, Waehringer Str. 42, A-1090 Vienna, Austria.4Department of Biotechnology, BOKU-University of Natural Resources and Life Sciences, ViennaMuthgasse 18, A-1190 Vienna, Austria.5Christian Doppler Laboratory on Biotechnology of Skin Aging, Muthgasse 18, A-1190 Vienna, Austria.6Evercyte GmbH, Muthgasse 18, A-1190 Vienna, Austria.7Department of Internal Medicine I and Comprehensive Cancer Center, Medical University of Vienna, Lazarettgasse 14, A-1090 Vienna, Austria.8Department of Physiology, Faculty of Medicine, Semmelweis University, Tűzoltó utca 37-47, H-1094 Budapest, Hungary.9Institute of Enzymology, Research Centre for Natural Sciences, Hungarian Academy of Sciences, Magyar Tudósok körútja 2, H-1117 Budapest, Hungary.10Science Consult DI Thomas Mohr KG, Enzianweg 10a, A-2353 Guntramsdorf, Austria
Conflict of interest
The authors declare that they have no conflict of interest.
Publisher's note
Springer Nature remains neutral with regard to jurisdictional claims in published maps and institutional affiliations.
Supplementary Informationaccompanies this paper at (https://doi.org/
10.1038/s41419-018-1102-z).
Received: 13 August 2018 Revised: 4 September 2018 Accepted: 21 September 2018
References
1. Kalinowski, D. S., Quach, P. & Richardson, D. R. Thiosemicarbazones: the new wave in cancer treatment.Future Med. Chem.1, 1143–1151 (2009).
2. Heffeter, P. et al. Anticancer thiosemicarbazones: chemical properties, inter- action with iron metabolism, and resistance development.Antioxid. Redox Signal.https://doi.org/10.1089/ars.2017.7487(2018).
3. Giles, F. J. et al. Phase I and pharmacodynamic study of Triapine, a novel ribonucleotide reductase inhibitor, in patients with advanced leukemia.Leuk.
Res.27, 1077–1083 (2003).
4. Karp, J. E. et al. A phase I study of the novel ribonucleotide reductase inhibitor 3-aminopyridine-2-carboxaldehyde thiosemicarbazone (3-AP, Triapine) in combination with the nucleoside analog fludarabine for patients with refractory acute leukemias and aggressive myeloproliferative disorders.Leuk.
Res.32, 71–77 (2008).
5. Yee, K. W. et al. Triapine and cytarabine is an active combination in patients with acute leukemia or myelodysplastic syndrome.Leuk. Res.30, 813–822 (2006).
6. Zeidner, J. F. et al. A phase II trial of sequential ribonucleotide reductase inhibition in aggressive myeloproliferative neoplasms. Haematologica 99, 672–678 (2014).
7. Attia, S. et al. A phase 2 consortium (P2C) trial of 3-aminopyridine-2- carboxaldehyde thiosemicarbazone (3-AP) for advanced adenocarcinoma of the pancreas.Invest. New Drugs26, 369–379 (2008).
8. Knox, J. J. et al. Phase II study of Triapine in patients with metastatic renal cell carcinoma: a trial of the National Cancer Institute of Canada Clinical Trials Group (NCIC IND.161).Invest. New Drugs25, 471–477 (2007).
9. Jansson, P. J., Sharpe, P. C., Bernhardt, P. V. & Richardson, D. R. Novel thiose- micarbazones of the ApT and DpT series and their copper complexes:
identification of pronounced redox activity and characterization of their antitumor activity.J. Med. Chem.53, 5759–5769 (2010).
10. Maleki Vareki, S., Salim, K. Y., Danter, W. R. & Koropatnick, J. Novel anti-cancer drug COTI-2 synergizes with therapeutic agents and does not induce resis- tance or exhibit cross-resistance in human cancer cell lines.PLoS ONE13, e0191766 (2018).
11. Kowol, C. R. et al. Impact of stepwise NH2-methylation of triapine on the physicochemical properties, anticancer activity, and resistance circumvention.
J. Med. Chem.59, 6739–6752 (2016).
12. Ishiguro, K. et al. Distinct mechanisms of cell-kill by triapine and its terminally dimethylated derivative Dp44mT due to a loss or gain of activity of their copper(II) complexes.Biochem. Pharmacol.91, 312–322 (2014).
13. Lovejoy, D. B. et al. Antitumor activity of metal-chelating compound Dp44mT is mediated by formation of a redox-active copper complex that accumulates in lysosomes.Cancer Res.71, 5871–5880 (2011).
14. Seebacher, N. A., Richardson, D. R. & Jansson, P. J. A mechanism for over- coming P-glycoprotein-mediated drug resistance: novel combination therapy that releases stored doxorubicin from lysosomes via lysosomal permeabiliza- tion using Dp44mT or DpC.Cell Death Dis.7, e2510 (2016).
15. Sperandio, S., de Belle, I. & Bredesen, D. E. An alternative, nonapoptotic form of programmed cell death. Proc. Natl Acad. Sci. USA 97, 14376–14381 (2000).
16. Lee, D., Kim, I. Y., Saha, S. & Choi, K. S. Paraptosis in the anti-cancer arsenal of natural products.Pharmacol. Ther.162, 120–133 (2016).