SOMATIC AND MOTOR DEVELOPMENT OF CYPRIOT ELEMENTARY SCOOLBOYS
PhD thesis
Polydoros Pampakas
Doctoral School of Sport Sciences Semmelweis University
Supervisor: † Dr. János Mészáros professor, PhD Dr. Erika Koltai research fellow, PhD Consultant: Dr. Ferenc Ihász associate professor, PhD
Official reviewers:
Dr. Csaba Sós associate professor, PhD Dr. Miklós Bánhidi college professor, PhD
Head of the Final Examination Committee:
Dr. Csaba Istvánfi professor emeritus, CSc
Members of Final Examination Committee:
Dr. József Pucsok professor, DSc
Dr. Anikó Barabás associate professor, CSc Dr. Tamás Szabó director general, CSc
Budapest, 2013
1
Table of contents
1. INTRODUCTION ... 5
1.1. Health and its determinants ... 5
2. REVIEW OF RELATING LITERATURE ... 7
2.1 Endocrine regulation of growth, maturation and performance ... 8
2.1.1 Growth hormone (GH) ... 8
2.1.2 Insulin-like growth factor (IGF-1) ... 9
2.1.3 Thyroid hormones ... 10
2.1.4 Parathyroid hormones ... 11
2.1.5 Regulatory effects of adrenal medulla and cortex ... 13
2.1.6 Hormones of gonad glands ... 15
2.1.7 Insulin and glucagon ... 18
2.1.8 Leptin ... 20
2.2 The effects of regular physical activity ... 22
2.2.1 Activity and body height ... 23
2.2.2 Weight, body composition and physical activity ... 24
2.3 Relationships of anthropometric characteristics and performance ... 25
2.4 Effects of other environmental factors ... 27
2.5 Facts, evidences, and conclusions by the reviewed literature ... 31
3. OBJECTIVES ... 34
3.1 Significance of the problem ... 34
3.2 The aim of the study, questions, hypotheses ... 36
3.2.1 The aim and questions ... 36
3.2.2 Hypotheses ... 36
3.3 Limitations ... 38
3.4 Delimitation ... 38
2
4. MATERIAL AND METHODS ... 39
4.1. Methods and subjects ... 39
4.1.1. Anthropometric methods ... 39
4.1.1.1. The estimation of Conrad growth type ... 39
4.1.1.2. The estimation of relative body fat content ... 41
4.1.2. Measurement of status of circulatory system ... 41
5. RESULTS ... 43
5.1 Height and body mass ... 43
5.2 Nutritional status ... 45
5.3. Body Size and Composition ... 48
5.4. 800 meter run performance... 60
5.5. Cardiovascular Measures ... 61
6. DISCUSSION ... 66
6.1. Summarizing our data it can be stated that the results of this study verified the original hypotheses: ... 67
7. CONCLUSIONS ... 70
8. SUMMARY ... 71
9. ÖSSZEFOGLALÁS ... 73
10. REFERENCES ... 75
11. Publications of Mr. Polydoros Pampakas ... 87
12. ACKNOWLEDGEMENTS ... 89
3
List of figures
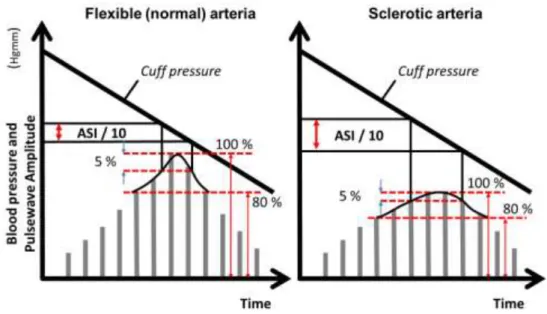
Figure 1. Calculating ASI ... 42
Figure 2. Age-related changes in blood pressure and heart rate ... 54
Figure 3. Effects of overweight and obesity on systolic blood pressure ... 55
Figure 4. Effects of overweight and obesity on diastolic blood pressure ... 55
Figure 5. Change in body mass (kg) by group over the study period... 57
Figure 6. Muscle mass (%) by group over the study period ... 58
Figure 7. Changes in stature (cm) ... 59
Figure 8. Changes in (%) fat ... 60
Figure 9. Changes in 800 meter run performance by group ... 61
Figure 10. Diastolic pressure (Hgmm) by group over the study period ... 62
Figure 11. Pulse pressure (Hgmm) by group over the study period ... 63
Figure 12. Arterial stiffness index (ASI) by group over the study period ... 65
List of tables
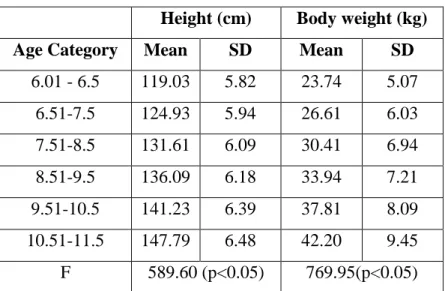
Table 1. Frequency distribution of subjects by their calendar age based on the repeated three surveys ... 43Table 2. Age-related changes in height and body weight ... 43
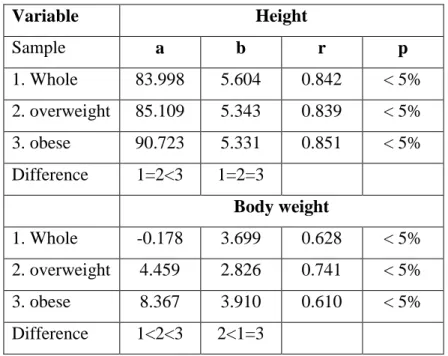
Table 3. Body fat-related linear regression coefficients of height and body weight increase ... 44
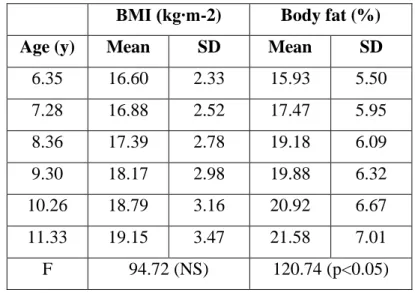
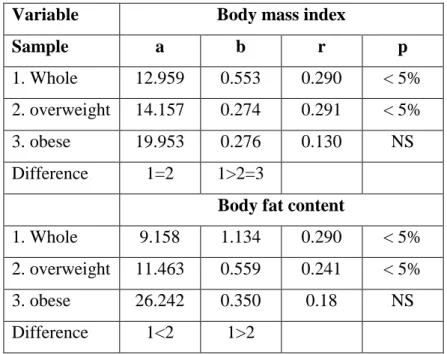
Table 4. Age-related changes in body mass index and relative fat content ... 45
Table 5. Body fat-related linear regression coefficients of height and body weight increase ... 46
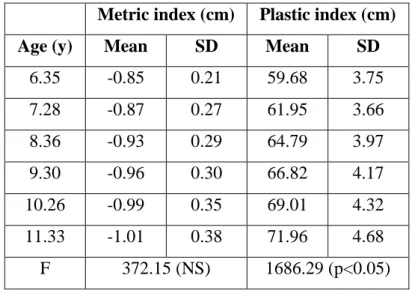
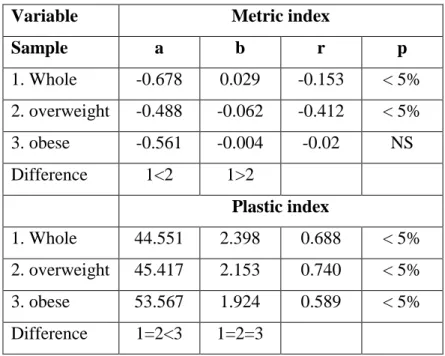
Table 6. Age-related changes in metric and plastic indices ... 47
Table 7. Body fat-related linear regression coefficients of metric and plastic indices increase ... 48
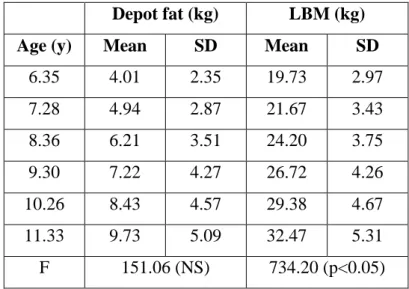
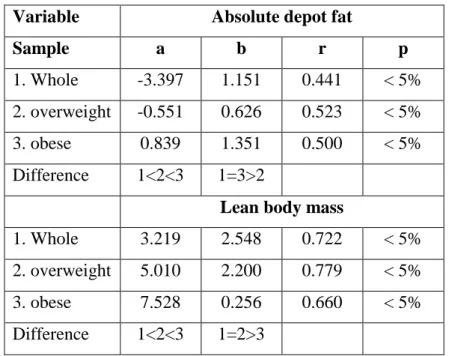
Table 8. Age-related changes in absolute depot fat content and lean body mass ... 49
Table 9. Body fat-related linear regression coefficients of absolute depot fat and lean body mass increase ... 50
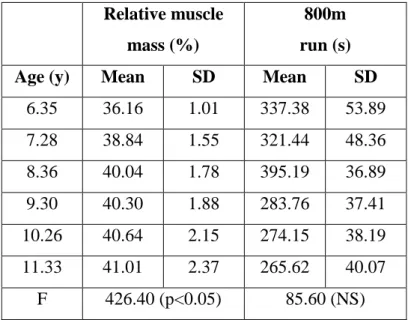
Table 10. Age-related changes in relative muscle mass and 800m run scores ... 51
4
Table 11. Body fat-related linear regression coefficients of relative muscle mass and 800m run score increase ... 52 Table 12. Body fat-related linear regression coefficients of blood pressures and heart rate ... 53 Table 14. Mean (SD) cardiovascular measures ... 64
5
1. INTRODUCTION
1.1. Health and its determinants
Defining health remains a major challenge, despite the progress made in treating diseases and increasing the average life duration in western societies. The World Health Organization (1948) described health as ―a state of complete physical, mental, and social well-being and not merely the absence of disease or infirmity. Health is a human condition with physical, social and psychological dimensions, each characterized on a continuum with positive and negative poles. Positive health pertains to the capacity to enjoy life and to withstand challenges. Negative health pertains to morbidity, and in the extreme, with premature mortality (Bouchard and Shephard 1994, Paffenbarger at al.
2001). Naturally, the role of behavioural and environmental factors can not be neglected in this respect. By the statistics of Mokdad and associates (2004) poor diet and physical inactivity are the major behaviours associated with greater health risks.
There are two major (but not totally independent) challenges in the modern societies that influence the health status of the population. The first is general physical in-activity and the second is the epidemic of overweight and obesity. To determine causal relation in their interaction is almost impossible.
The lifestyle of most people in industrially developed countries is significantly influenced by mass media. Paradoxically, the mass media, and particularly television, can play an important role in the management of low level of habitual physical activity and obesity. A number of studies have confirmed that obesity is directly related to the number of hours spent watching television and other screens. The inactive behaviour of television viewing is often combined with the frequent, very attractive commercials advertising food and drink (Bar-Or 1998, James 2002, Parízková and Hills 2005). Un- fortunately, the power of advertising is such that first of all young people and children are captive audiences and readily associate with the unfavourable practices that are presented, most commonly of highly processed and energy-dense foods. The other side of the problem is evolutionary. Evolution teaches us that those carrying genetic alleles favouring motor skills, strength, speed, stamina, and other physical attributes at relevant genes were more likely to have enjoyed greater reproductive fitness (condition) because
6
of their greater probability of attracting mates and staying alive long enough to have children (Bouchard at al. 2007). From the research of paleontologists, anthropologists, anatomists, and molecular biologists the main events in the evolution of our species can be briefly outlined with an emphasis on those that have implications for physical activity (Tattersall 2002) and the consequences are:
• The human organism can adapt to a wide range of metabolic demands imposed by work or exercise.
• A low level of physical activity is associated with risk for common diseases and premature death.
• Evolutionary history teaches us that early humans could not have survived without the ability to perform very demanding physical work.
And what are the facts nowadays? According to the indirect calculation of (Radák 2008) the daily energy expenditure utilized for physical activity decreased remarkably. This energy expenditure in a caveman can be assessed between 3.500-4.000 kcal in a day, and only 400 kcal in the modern man.
7
2. REVIEW OF RELATING LITERATURE
Introduction
Indicators of normal growth, maturation, performance and health status are affected by inheritance, direct biological regulatory factors and the wide range of environmental effects. Biological inheritance represents the influences of the parental generation on the offspring generation that are mediated by genes. The role of specific genes and mutations in normal variation in growth and development of children and adolescents remains to be elucidated, in part because of the measures of growth and development that are complex, multi-factorial phenotypes. The genetics of growth and maturation has been examined primarily through studies of different kinds of relatives, most often twins, siblings, parents and offspring, and spouses. The available indicate a major role for the genotype in body size and body composition and in the timing, tempo, and sequence of maturational events. The genotype also has a role in indicators of performance and responses to training, but genetic effects are not as strong as those for measures of growth and maturation. Much can be learned from the study of children who have a specific genetic deficiency. Such studies reveal that a partial or complete invalidation of a single gene can results in early death, failure to thrive, or a predisposition to several diseases. Advances in genomics and other technologies will make possible the investigation of the genetic and molecular basis of normal growth and maturation in the coming decades. We do not want to shrinkage the biological importance of genetics into this short paragraph but taking into account the strict length limitation of the thesis stress: The up –to-date details of the available genetic studies can be found among others in the summary publications of (Van Praagh 1998), (Bouchard and co-workers 2000), (Malina and associates 2005), (Parízková and Hills 2005). This chapter focuses on the hormonal regulation of growth and maturation, the effects of regular physical activity and finally we summarize the effects of some environmental factors.
8
2.1 Endocrine regulation of growth, maturation and performance
The integrated nature of growth and maturation is maintained by a constant interaction of genes, hormones, nutrients, and factors in the environment. Their separation can be made naturally, exclusively on the didactic points of view. Growth, maturation, and performance are unified processes, and factors that influence these processes are interrelated and interdependent. Many advances have occurred in the past two decades concerning and understanding of the biology of hormones and their mechanisms of actions. Even though the endocrine glands produce key hormones that play critical roles in the growth and maturation processes, hormone-like molecules are synthesized in other tissues and organs, and these substances contribute to growth and maturation as well. In conclusion, hormonal activities are essential for the maintenance of normal growth, the timing of maturation and also the physiologic proportions of active and non- active tissues (Wilson at al. 1998).
2.1.1 Growth hormone (GH)
The synthesis and secretion of GH by the anterior pituitary is regulated primarily by the hormones produced within the hypothalamus: growth hormone – releasing hormone (GHRH), which stimulates its production, and somatostatin or somatotropin release- inhibiting factor (SRIF), which inhibits its production. These two modulators of GH synthesis and secretion bind to specific cell surface receptors in the anterior pituitary somatotropic cells, activate the adenylate cyclase cascade, and increase cyclic AMP levels leading to stimulation or an inhibition of GH synthesis. Growth hormone is a peptide hormone of 191 amino acids. It circulates in the blood after its secretion in a free form or bound to a GH binding protein.
The levels of the binding protein are low at birth but increase rapidly throughout childhood (Grumbach and Styne 1998, Malina at al. 2005). The values of the binding protein are generally stable during adolescence. The levels are low in under-nourished children, high in overweight and obese children (Parízková and Hills 2005) and decline with weight reduction (Root 1994). Target tissue for GH harbour a specific cell surface GH receptor that bind the hormone to initiate cellular response.
9
Growth hormone influences protein, carbohydrate, and fat metabolism. It decreases the rate of carbohydrate uptake and utilization by tissues and enhances mobilization of lipids from adipose tissue depots. These effects are obviously important during growth but are also essential throughout life, especially for normal body composition and distribution of body fat. GH is essential for postnatal growth, which becomes quite evident early in life. The GH content of the pituitary increases progressively postnatal, reaching the maximum between 12 and 18 years of age. This level is maintained during adult life but decreases with aging.
The GH content of the anterior pituitary is not necessarily related to GH con-centration in circulation. GH is released in a pulsatile manner, that is, in a series of intermittent bursts during the course of the day. Children have slightly more bursts during 24 hours than adults, so the circulating level of GH during a day is greater in children than adults (Martha et al. 1989). The frequency and amplitude of GH pulses both vary with age, and the frequency and amplitude of bursts increases as individual passes from childhood through adolescence.
2.1.2 Insulin-like growth factor (IGF-1)
IGF-1 displays a wide range of metabolic effects. The prevailing component of IGF in the plasma is bound to a specific binding protein (BP). It is presumed that BP modulates the biological activities of IGF-1. BP is regulated by growth hormone (GH) and has a high affinity for IGF-1. Increased linear growth with a normal or high IGF-1 level is apparent in spite of low growth hormone secretion during the pre-pubertal period. In a study of children with simple obesity and normal children with shorter stature, it was revealed that peak levels of GH in the growth hormone releasing factor test were significantly lower than their obese pairs (Yasunaga 1998). The results of this study lead to the hypothesis that increased dietary intake and hyper-nutrition during growth cause hyperinsulinemia that increases GH receptor and IGF-1 secretion. IGF-1 has paracrine and autocrine effects near or at the site of synthesis. IGF-1 stimulates protein synthesis and increases cell proliferation in many tissues of the body. The growth factor IGF-1 is most active in cartilage. The net result is growth in length of individual bones, and in turn, stature, without accelerating skeletal maturation (Pette 2001).
10
Because GH is produced intermittently during the day, circulating levels vary.
Circulating levels of IGF-1, on the other hand, tend to be reasonably stable during the day. Mean circulating concentrations of IGF-1 reach about 50 ng·ml-1 at birth but with considerable individual differences. They remain quite stable during infancy but rise gradually during childhood, attaining mean values of about 140 ng·ml-1 in boys and 170 ng·ml-1 in girls by 6 years of age. IGF-1 levels increases considerably during the adolescent growth spurt, reaching an average of 415 ng·ml-1 in girls 13 to 14 years of age and 430 ng·ml-1 in boys 15 to 16 years of age. The surge in IGF-1 during the adolescent growth spurt appears to parallel the increase in the number of bursts of GH at this time. Concentrations of IGF-1 increase as growth in stature accelerates. Peak levels of IGF-1 tend to occur about a year or so after peak height velocity and then decline slowly in late adolescence (Esoterix Inc 2000). Given the sex difference in the timing of adolescent events, the increase in circulating concentrations of IGF-1 occurs earlier in girls that in boys.
2.1.3 Thyroid hormones
The thyroid gland is located in front and either side of the trachea below the larynx.
Weight of the gland increases gradually through infancy and childhood, followed by considerable enlargement during adolescence. It attains about 15 g in women and 20 g in men. Levels of thyrotropin and free thyroxine fall between birth and 1 month postnatally. Subsequently, blood levels of TSH remain rather stable until maturity.
(Nelson at al. 1993, Esoterix 2000). In contrast, free thyroxine declines slightly through puberty and reaches a plateau at maturity. About 99% of the produced thyroxine and triiodothyronine are bound to several serum proteins, and the physiological action of thyroid hormones is mediated by nuclear receptors localized in the nucleus of cells of most tissues. These receptors are members of a super-family of nuclear receptors, and they bind more readily to triiodothyronine than thyroxine. The hormones enter into the nucleus, bind to the chromosome-linked receptors, and activate or suppress gene expression at specific genes.
Both thyroid hormones are calorigenic, that is, they stimulate oxygen uptake and energy expenditure. Hence, the major metabolic effect of thyroid hormones is a general increase in oxygen consumption in most tissues, especially those that compose the bulk
11
of body weight (skeletal muscle, heart, liver, and kidneys). They increase mitochondrial oxidative metabolism, which is partly explained by the augmented activity of Na/K ATP-ase. In contrast, no acute effect of the thyroid hormones is apparently produced in several tissues, including the brain and smooth muscles of the gastrointestinal tract (Vuori 2010). Much of the knowledge of specific growth and maturation effects of the thyroid gland is derived from clinical observations of individuals with abnormal thyroid function. Hypothyroid children, those with thyroid hormone deficiency, typically pre- sent growth failure (Cameron 2003). The rate of growth is reduced, linear growth of bones is impaired, infantile body proportions persists, skeletal and sexual maturation are delayed, and muscular development is deficient (Borsos 2000, Cameron 2006). If thyroid deficiency is severe and persists, somatic, sexual and mental retardation may result. Hypothyroid children, those with an excess of thyroid hormones, often show excessive growth initially, but loss of weight eventually occurs because of increased metabolic demands and resulting inadequacy of energy intake to meet the increased metabolic demand.
The single most frequent cause of hypothyroidism worldwide is iodine deficiency.
However, iodine deficiency is very rare in the economically developed countries where iodine is routinely added to food products. Other causes of hypothyroidism include chronic autoimmune thyroiditis, congenital defects, and others. Hypothyroidism is occasionally inherited as an autosomal recessive trait (Tishkoff and Kidd 2004). The clinical manifestations of hypothyroidism are quite heterogeneous. If present in the first month of life, it leads to irreversible mental retardation and stunted physical growth (Vasan at al. 2005). The prevalence of hypothyroidism in new-born babies ranges from about 1 in 3,000 to 4,000 in the United States and Canada (Malina at al. 2005) and remarkably greater in many Asian countries. If treated immediately after neonatal detection, infants grow and develop normally.
2.1.4 Parathyroid hormones
The parathyroid glands are small bodies, usually four, located on the dorsal portion of the thyroid gland. On average, each parathyroid gland weighs about 40 g. However, a small percentage of the population has only three glands, whereas as much as 15 % of the population has five or six. The parathyroid glands do not seem to be under the
12
influence of a trophic hormone from the anterior pituitary. Parathyroid hormone (PTH) is an essential element in the regulation of calcium and phosphate metabolism. Thus, it is needed throughout life and is especially vital for the normal bone and dental growth and maturation. Because 99% of the body calcium is in bone, PTH is intimately involved in skeletal growth (Christiansen 2001).
Parathyroid hormone functions to maintain a reasonable stable plasma calcium concentration. This level, which is found within narrow limits, must be maintained de- spite variable calcium intake and excretion and calcium requirements for bone growth and maturation. The primary action of PTH is to stimulate an increase in circulating calcium through direct action of the hormone on bone and kidneys. PTH stimulates osteoclastic activity and thus bone resorption in the short term. However, long-term exposure to high levels of PTH causes a decrease in osteoclastic activity and compensatory in-crease in osteoblasts (Ji 2001). PTH also reduces renal clearance rates of calcium and increases intestinal absorption of calcium.
Calcitonin from the thyroid gland has effects opposite to those of PTH. Thyroid cells that produce calcitonin have a different embryonic origin than other thyroid cells (Malina at al. 2005). Calcitonin causes a decrease in circulating calcium and is secreted by the thyroid in response to a high plasma calcium concentration to either inhibit bone resorption or increase the rate of calcium deposition in bone (Rosenfield 2002).
Calcitonin and PTH function as a dual hormonal feedback system in the maintenance of plasma calcium concentrations. As calcium levels in body fluids become too high, calcitonin is secreted and calcium is thus lowered. When calcium levels are too low, PTH is secreted and blood and extra-cellular fluid calcium are elevated. Because the two hormones function to regulate the amount of circulating calcium and the ex-change of circulating calcium with calcium in bone, both PTH and calcitonin can be reasonably assumed to be essential to normal skeletal growth and maturation (Rowland 2005).
An important component of the pathway regulating calcium levels is vitamin D.
Vitamin D is synthesized in the skin by the action of sunlight from the sterol precursor or is consumed in the diet. The product is vitamin D3 (cholecalciferol), which is then metabolized into 25 (OH) D in the liver and subsequently into 1 α 25 (OH) 2 D3 and
13
24R, 25 (OH) 2 D3 in the kidney (Sperling 2002). The latter two compounds are considered steroid hormones, and both are necessary to observe the full spectrum of the biological effects of vitamin D. However, 1 α 25 (OH) 2 D3 plays a particularly important role in the regulation of calcium levels. It increases the absorption of calcium in the small intestine and the rate of release of calcium and phosphate from bone. The rate of production of 1 α 25 (OH) 2 D3 by the kidney is influenced by several hormones, but PTH and calcitonin are the most important, particularly in the long-term regulation of plasma calcium concentration. Short-term control is driven primarily by parathyroid hormone and normal levels of 1 α 25 (OH) 2 D3 (1, 25-dihydroxycholecalciferol) (Kulin and Muller 1996, Rowland 2005).
2.1.5 Regulatory effects of adrenal medulla and cortex
The adrenal glands are small organs located over the upper pole of each kidney. Each weighs about 4 g and is composed of two distinct glands:
- An outer gland, the adrenal cortex (about 90% of the size of the adrenals).
- An inner gland, the adrenal medulla.
The growth pattern of the adrenals is characterised by a marked decrease (!) in weight shortly after birth and a further gradual reduction during the first 3 to 6 months of life. Weight of the glands then rises through childhood and shows growth spurt du- ring adolescence (Malina at al. 2005). The size of the gland at birth is thus regained du- ring the second decade. This growth pattern is one of the exceptions to Scammon‘s curves (1930) of systemic growth.
The adrenal medulla is innervated by the sympathetic nervous system and secretes adrenaline in response to nervous stimulation. Noradrenaline is mainly released from sympathetic nerve endings and converted enzymatically to adrenaline primarily in the adrenal medulla. Catecholamines exert a myriad of biological influences on tissues and organs and regulate levels of a number of molecules. For instance, catecholamines influence the force and rate of contraction of the cardiac muscle, systolic and diastolic blood pressure, gastrointestinal motility, bronchodilatation, insulin secretion, adipose tissue lipolysis, glucose metabolism, fatty acid metabolism, and thermogenesis.
Additionally, adequate regulation of catecholamine production and also degradation and
14
of epinephrine and nor-epinephrine metabolism is important for normal growth and maturation (Molitch 1995, Veldhuis JD 2002).
Hormones of the adrenal cortex, on the other hand, are directly involved in the regulation of growth and maturation, in addition to being essential to many other body functions. The adrenal cortex produces and secretes steroid hormones.
Adrenal cortical steroids influence a variety of body functions and are thus essentialto growth and maturation. Because the gonads and the adrenal cortex have a common embryonic origin, one might expect an interaction between the two glands. Indeed, a normally functioning adrenal cortex is necessary for complete sexual and reproductive maturity. Excess secretion of adrenal cortex hormones, or pharmacologic doses of glucocorticoids for systemic inflammation during childhood, can result in stunted growth in stature as the proliferation of cartilage cells at the growth plates is decreased.
This condition is apparently caused by increased protein catabolism in bone and elsewhere in the body. The net result is the stunting of linear growth and also growth in weight (Eliakim at al. 2000, Malina at al. 2005).
Adrenarche, the increase in adrenal androgen and oestrogen production, occurs about 2 years before gonadarche, the onset of gonad functions marked by increase in the size of external genitalia and breasts. However, adrenarche is not essential for gonadarche to take place, and they are almost independent events (Cutler at al. 1990). The role of adrenal androgens and oestrogens in pubertal events is not yet clear, but gonadal steroids play the predominant role. Secretion of the main glucocorticoid, cortisol increases gradually with age during growth, and the increase is proportional to the age- associated increase in body size, except perhaps in infancy. How-ever, the relationships between serum cortisol levels or circadian cortisol ranges and body mass, body composition, or growth rate in healthy children and adolescents are thought to be secondary to other factors and do not appear to be causal (Knutsson at al. 2000, Brownell at al. 2009). Nonetheless, when cortisol production rates are related to maturity status in adolescent boys, the rates increase, on the average, with advancing sexual maturity. However, when cortisol production is adjusted for body weight in adolescents of contrasting maturity status the differences in cortisol production across maturity categories are reduced considerably (Beunen at al. 2002).
15 2.1.6 Hormones of gonad glands Gonadotropins
The testes and ovaries are, respectively, the male and female gonadal glands. Ac- cording to the early observation of (Boyd 1952) age-related change in the weight of the testes is periodical and almost linear in respect of the ovaries during growth. The testes and ovaries each have two functional aspects, a hormone-secreting component and a gamete-producing component. The hormone-producing and gamete-producing functions of the gonads are regulated by two gonadotropic hormones from the anterior pituitary:
FSH and LH. Follicle-stimulating hormone in females stimulates the growth of ovarian follicles but not their complete maturation and oestrogen secretion. Luteinising hormone promotes maturation of an ovarian follicle, ovulation, development of corpus luteum, and stimulation of further production of oestrogens by the ovary. In males, FSH pro- motes growth of the seminiferous tubules and stimulates the production of sperm, and LH stimulates the intestinal cells of Leydig to enlarge and produce testosterone.
Changes in serum concentrations of FSH and LH with chronological age and maturity status are significant. Blood levels of FSH are much higher in infant girls (7.2 mIU·ml-1) than in infant boys (1.5 mIU·ml-1). During childhood, values stabilise approximately at 2.0 mIU·ml-1 in girls and 1.0 mIU·ml-1 in boys. Blood levels of the gonadotropins increase with puberty in both sexes. Blood levels of LH are quite variable be-tween birth and 1 year of age with no consistent difference between boys and girls (Esoterix Inc 2000). From about 1-1.5 year of age to the onset of puberty, levels of LH are about 0.07 mIU·ml-1 in both sexes. With the onset of puberty (stage 2 breasts and pubic hair in girls and stage 2 of genitals and pubic hair in boys), blood values of LH increase about 10-fold in girls and 20-fold in boys. LH levels then continue to rise in girls such that by early adulthood, they reach about 4 to 5 mIU·ml-1. The rise in boys is more gradual, but adult levels are also, on average, about 4 to 5 mIU·ml-1 (Malina at al. 2005). Thus, gonadotropic hormones are detectable in the blood of pre-pubertal children before overt signs of sexual maturation become apparent. Childhood concentrations are rather stable, with much overlap between girls and boys. From about 9 or 10 years of age, blood levels of gonadotropins rise in both sexes. Blood concentrations are slightly more related to stage of sexual maturity than to chronological age. Late in puberty in girls and
16
just before menarche, the gonadotropic hormones develop a cyclical pattern related to menstrual cycle.
Sex steroids
In males, testosterone is synthesised in the testes and adrenal cortex from cholesterol precursors. Although testosterone is the major and most abundant androgen in males, the most potent androgen is dihydro-testosterone, which is derived from an enzymatic conversion of testosterone. Dihydro-testosterone has about three times more androgenic activities than testosterone. Dihydro-testosterone appears to be formed from the testosterone precursor mainly in tissues that are sensitive to circulating androgens. Di- hydro-testosterone is thought to be the major growth-promoting androgen necessary for the maturation of male secondary sex characteristics. The rate of enzymatic conversion of testosterone to dihydro-testosterone is related to body size and probably to muscle and adipose tissue masses (Malina at al. 2005, Foley at al. 2007, Jimenez Pavon at al.
2010, Metcalf BS 2009).
In females, estradiol is the most potent oestrogen, and it is produced by the ovaries.
Small amounts originate from the peripheral conversion of precursors secreted by the adrenal cortex. In addition to estradiol, other oestrogenic hormones are produced. These hormones are biologically less potent, but, nonetheless, contribute to the sexual maturation of girls. Most of the other oestrogenic hormones result from the peripheral conversion of ovarian and adrenal oestrogenic precursors. Testosterone and other androgens are also present in females. Androgen precursors are secreted in small amounts by both the ovaries and adrenal cortex. Both testosterone and dihydro- testosterone are found in the blood and peripheral tissues of females but in small quantities competed with males. Most studies that consider steroid hormones in growing children use testosterone and estradiol as the markers of androgenic and oestrogenic activity, respectively. Ideally they should be measured repeatedly over several days under standardised conditions because blood concentrations of the hormones can be influenced by several factors (Malina at al. 2005, McLure SA 2009). However, such data are not available from birth to maturity. Recent studies have shown that testosterone administration increases whole-body protein metabolism in pre-pubertal boys in vivo isotopic experiments (Frost HM 1997). The anabolic activity was accompanied by elevated GH, IGF-I, and testosterone levels. In contrast, chronic
17
exposure to oestrogens in hypo-gonadal girls did not affect whole-body protein metabolism despite an increase in plasma IGF-I concentrations (Li C Basarab at al.
2004, Maj A at al. 2008). The absence of an anabolic effect of oestrogens may contribute to the sex differences in body size that arise during puberty and the adolescent growth spurt.
Effects of the steroids
The effects of androgens and oestrogens on growth and maturation are many. The principal sites of action for testosterone and dihydro-testosterone are the primary and secondary sex characteristics of males. The oestrogens act to bring about corresponding changes in females, including the growth and maturation of the primary and secondary sex characteristics and the gynoid profile of adipose tissue distribution.
Both androgens and oestrogens promote generalised nitrogen retention and thus increased anabolism. Androgens are more potent in this regard than oestrogens. The effects of testosterones, for example, specifically underlie the dramatic adolescent growth spurt in muscle and fat-free mass in males. The protein anabolic actions of oestrogens are less than those of androgens, so the female gain in muscle mass during adolescence is primarily an effect of adrenal androgens.
Androgens also promote bone growth and skeletal maturation. They stimulate some longitudinal growth of long bones in interaction with GH and IGF-I and also promote considerable growth in bone thickness. The greater skeletal growth of boys than girls is related to testosterone secretion. Protein retention enhanced by androgens promotes the formation of cartilage and bone matrix and the deposition of calcium and phosphorus.
The effects of oestrogens on bone are generally similar to those of androgens, except for their influence on linear growth. Oestrogens increase bone matrix formation, maintain positive calcium balance, and accelerate skeletal maturation. More-over, oestrogens are the main steroids involved in the final phase of skeletal maturation in the sense that they initiate and complete epiphyseal closure (Smith and Korach 1996, Armstrong and van Mechelen 2000). Thus, oestrogens can be viewed as a primary determinant of final stature of a child. Androgens also contribute to this process as they are aromatised to oestrogens in tissues (Augat 1998).
18
Oestrogens promote the accumulation of fat throughout the body in females and specifically enhance the accumulation of fat about the hips, buttocks, breasts, and medial aspects of the calf. The rise in concentrations of dehydroepiandrosterone, an adrenal steroid, in boys and girls between 7 and 12 years of age, is perhaps related to the accumulation of fat in both sexes at this time (the so-called pre-adolescent fat wave). As the process of sexual maturation and the adolescent growth spurt continues, males experience a fat loss on the extremities. This loss may be related to increasing androgen out-put, especially testosterone, which has a fat-mobilising effect, and the hormones probably act in concert during male adolescence (Reiter and Grumbach 1982).
The increasing concentrations of the sex steroids during puberty influence the production of other hormones related to growth, specifically GH and IGF-I. The rise in sex steroids at this time leads to an increase in the secretion of GH, which in turn stimulates the production of IGF-I. This effect is especially pronounced in boys compared with the corresponding effect in girls. The interactions between the gonadal steroids and growth hormones become especially apparent at the time of puberty (Kerrigan and Rogol 1992). Thus, some of the sex differences in growth and body composition during adolescence are related to the increased secretion of GH and IGF-I in males consequent to the increased production of sex steroids at this time (Klein KO at al. 1998, Yilmaz D at al. 2005, Huang KC at al. 2004).
2.1.7 Insulin and glucagon
The hormonal secretions of the Islets of Langerhans are insulin (secreted by the β cells), glucagon (secreted by the α cells), somatostatin (produced by the δ cells) and the pancreatic polypeptide (produced by the PP cells). Insulin and glucagon are the primary interest. The actions of the two hormones are mutually antagonistic. Insulin is a blood sugar-lowering hormone, whereas glucagon is a blood sugar-raising hormone.
Insulin is essential in carbohydrate metabolism. It enhances the rate of glucose uptake in skeletal muscle, adipose cells, and other tissues stimulating the transport of glucose and amino acids through cell membranes. The action of insulin decreases the concentration of blood glucose and increases glycogen stores in skeletal muscle and liver and the reliance on glucose as a substrate to meet the cellular energy needs. If blood glucose is
19
excessive and glycogen stores are high, insulin may stimulate the transformation of glucose into fatty acids, which are in turn converted to triglycerides. The latter is, however, a minor pathway in humans under common dietary circumstances. Insulin can inhibit glucose production by the liver and block fatty acid mobilisation through inhibition of adipose tissue lipolysis. The insulin-mediated disposal of blood glucose is thus particularly important in the maintenance of glucose homeostasis and overall substrate balance (Martin F at al. 1996, Lang J at al. 1997). Glucagon has the opposite effect of insulin.
Because insulin acts primarily on carbohydrate metabolism, it is important to normal growth and maturation. Insulin and GH interact in complex manner, and insulin is essential for full expression of the effects of GH. Although insulin is capable of promoting protein synthesis in the absence of GH, GH has only a slight effect on protein synthesis in the absence of insulin. The effects of GH, IGF-I, and IGF-II on protein synthesis and, in turn, on growth are considerably greater in the presence of insulin. In contrast, insulin and GH have opposite effects on fat. The former stimulates the conversion of carbohydrates into fat and depresses lipolysis, whereas the latter stimulates the mobilisation of fat (Bommert K at al. 1993, Takahashi M at al. 1991).
The δ cells of the pancreas produce somatostatin, which is also secreted by hypothalamic nuclei and is a potent inhibitor of GH-releasing hormone and, in turn, of GH from the anterior pituitary. Somatostatin is also produced in other areas of the brain, in the stomach, and in the gastrointestinal tract. Many issues concerning the various physiological roles of somatostatin are still unsolved, but it is a potent inhibitor of insulin and glucagon secretion from the islet cells. Thus, pancreatic somatostatin has paracrine effects on pancreatic α and β cells. Insulin is also a growth-promoting hormone. It is a potent mitogenic factor associated with cellular hyperplasia and cell hypertrophy. At least 100 genes are known to be regulated by insulin. Insulin, in some instances, increases the expression of specific genes and, in other cases, decreases the expression of genes. This role of insulin can be tissue specific and may be enhanced or diminished in the presence of other hormones or growth factors. Many cellular processes and substrates are affected by insulin, such as transcription of genes encoding metabolic enzymes, hormones, transcription factors, and others. In typical case, the
20
insulin-sensitive genomic sequence for a gene has an insulin response element in the promoter region. An insulin-stimulated change in the phosphorylation state or a receptor or other molecules or the presence of transcription and other factors may be required for the insulin effect (Wollheim CB at al. 1981, Sadoul K at al.1995, Borer 2003).
2.1.8 Leptin
Leptin is a hormone produced mainly by adipocytes. It is also expressed at much lower levels in the stomach and placenta. Initially, leptin was thought to be the missing factor that predisposed some people to be in positive energy balance. Indeed, leptin is an important regulator of long-term food consumption, and leptin appears not to play an important role in the short-term regulation of appetite and satiety. For instance, leptin levels are not altered by a single meal (Argente at al. 1997). Leptin exerts its effects on energy balance through the hypothalamic leptin receptor. Leptin reaches the central nervous system after having crossed the blood-brain barrier by a mechanism that remains to be elucidated. Leptin binds to the leptin receptors that are present at high levels in several hypothalamic neurons. Activated leptin receptors generate a response cascade whose long-term net effects are a reduction in food intake and an increase in metabolic rates. Leptin does not act in isolation to modulate energy balance. It interacts with key molecules involved in other regulatory loops that are components of highly redundant system. For instance, hypothalamic neuropeptide Y, a strong stimulant of appetite. A series of animal experiments have established that some of the actions of leptin on food intake are the results of its inhibitory effect on neuropeptide Y activity in the hypothalamus. α melanocyte-stimulating hormone has a potential to decrease appetite as a result of its binding to the melanocortin receptor 4 in the brain. Leptin increases the express-ion of proopiomelanocortin (POMC), the gene transcript that encodes several peptides, including α melanocyte-stimulating hormone. In other words, leptin potentiates the action of a number of anorexigenic factors and antagonises the action of orexigenic agents (Augustine RA and Grattan DR 2008).
Leptin is also thought to be involved in the regulation of metabolic rate even though the mechanisms are still unknown. Administration of leptin to animals undergoing caloric restriction attenuates the fall in metabolic rate commonly observed with negative energy balance (Sánchez J at al. 2009). Leptin also favourable influences glucose and lipid
21
metabolism. Overall, leptin is a potent molecule that influences many functions and is thus necessary for normal growth and maturation.
The critical role of leptin in growth is well illustrated by the clinical picture of the few patients who have been found to have inactivating mutations in the leptin or leptin receptor gene. Two kindreds with patients homozygous for leptin deficiency resulting in a complete absence of leptin have been described (Schwartz at al. 1996, Zlokovic at al.
2000). The patients exhibit severe obesity, increased food intake, and hypogonadotripic hypogonadism. A mutation in the leptin receptor gene leads not only to the same features as in the leptin deficient patients but also to growth retardation and hypothyroidism (Clement at al. 1998). Normal leptin and leptin receptor genes and normal leptin levels are, therefore, necessary for somatic growth.
After the discovery of leptin, researchers soon realised that a main function of leptin could be to protect body fat stores against severe depletion. During caloric restriction or times of under-nutrition, the adipose mass progressively decreases, which leads to a diminution ofleptin productionand leptin release from the adipose organ. Low leptin levels tend to reset food intake at a higher level and keep the metabolic rate in check to protect energy stores. Such a system confers clear evolutionary advantages and has implications for growth and maturation in children living under impoverished conditions.
Leptin is also required for the normal development of reproductive function and probably also for the onset of pubertal events. The mice characterised by the absence of leptin because of an autosomal recessive mutation in the OB gene are infertile. When treated with recombinant leptin, these mice become fertile. Moreover, treating normal young mice with repeated injections of recombinant leptin hastens the first signs of puberty. These observations together with the clinical profile of the adult patients with leptin or leptin receptor deficiencies strongly suggest that normal leptin levels play import-ant role in the onset of puberty (Elmquist at al. 1998).
Leptin is also involved in the regulation of hypothalamic-pituitary-adrenal axis. It is inversely related to levels of ACTH and cortisol. For instance, leptin deficiency is associated with high blood glucocorticoid levels and increased risk of type 2 diabetes.
22
Leptin enhances hematopoiesis and immune functions and undoubtedly impacts other pathways and functions as well.
2.2 The effects of regular physical activity
Physical activity is an environmental factor that is often viewed as exerting a favourable influence on growth and maturation. Additional environmental factors include socioeconomic status of the family, illness history, nutritional status, family size, cli- mate, and others. Physical activity should be recognised as only one of many environ- mental factors that may affect these processes. Current concern for the increasing pre- valence of hypo-activity or sedentarism in children and adolescents (Tomkinson at al.
2003, Olds at al. 2004, Mészáros at al. 2009, Melzer at al. 2004) makes a discussion of the potential role of physical activity highly relevant.
Regular physical activity is often assumed to be important to normal growth and maturation. Studies spanning nearly a century have suggested that regular physical activity, including training for sport, has a stimulatory influence on somatic development of children and adolescents. In one of the comprehensive reviews of
―exercise and growth‖ the following was suggested. “There seems to be a little question that certain minima of muscular activity are essential for supporting normal growth and for maintaining the protoplasmic integrity of the tissues. What these minima mean in terms of intensity and duration of activity has not been ascertained” (Rarick 1960). At the same time, concern was also expressed and is still currently expressed about potentially negative influences of physical activity, specifically of intensive training for sport during childhood and adolescence (Buckler and Brodie 1977, Drinkwater at al.
1984, Laron and Klinger 1989, Zsidegh at al. 2007). For the present, note that regular physical activity is not equivalent to intensive training for sport.
The mechanical and energetic aspects of activity are potentially important in the context of growth and maturity. Most discussions of physical activity refer to a child‘s estimated level of habitual physical activity, that is, the level of physical activity that characterises the lifestyle of the individual. It is usually quantified in terms of amount of time in activity (hours·week-1), an activity score, or energy expended in light or mode- rate-to-vigorous activities (Malina at al. 2005). Estimates are ordinarily derived from
23
questionnaires, interviews, diaries, and heart rate integrators or combination of methods.
Presently available techniques for estimating physical activity have measurement limitations (Vuori 2010).
Qualification and quantification of physical activity programs for children and adolescents are necessary. Describing a program as mild, moderate, or vigorous physical activity or describing children as active or inactive is insufficient. Physical activity needs to be defined in more specific terms if the effects of activity on growth, maturation and performance are to be identified and partitioned from other factors known to affect these outcomes. Partitioning requires more details about number of sessions per week, duration of activity sessions or distance covered in each session, intensity of the activity, type of activity, and perhaps estimated energy expenditure.
2.2.1 Activity and body height
Regular physical activity has no apparent effect on attained stature and the rate of growth in height. Longitudinal data on active and hypo-active boys followed from childhood through adolescence and girls followed during childhood show no difference or only small difference between the speeds and growth patterns (Beunen at al. 1992, Mészáros 2010). The issues of subjects selection, probably self-selection, in the active and hypo-active groups is a factor to consider in making comparisons. Although some early studies suggest an increase in stature with regular activity, however, the observed changes are usually quite small, and selection of subjects and maturity status at the time of training or at the time of making the comparisons was not controlled.
On the other hand, regular activity does not have a negative effect on growth in height.
This finding is relevant because the short stature and a slower rate of growth of young athletes in some sports are accepted as evidence that training may stunt growth (Malina at al. 2005). In addition to completeness of the available data, several import-ant factors are not considered drawing such a conclusion – small size as a selection criterion in some sports, inter-individual variation in biological maturity, and parental size (a proxy for genetic potential), among others (Pápai 2002, Pápai at al. 2007).
24
2.2.2 Weight, body composition and physical activity
Differences between the body weights of active and hypo-active children are generally small and statistically not significant. The data vary among studies, for example, boys in the Canadian sample tend to be heavier than active boys, especially during adolescence (Mirwald and Bailey 1986, Beunen at al. 1992). Exactly the similar patterns were observed in Hungarian pre-pubertal boys (Mészáros 2011).
Components of body mass can be potentially influenced by regular activity. Presently available data are derived primarily from the two-component model (body weight = fat free mass + fat mass). Some data suggest that regular physical activity is associated with a decrease in absolute and relative fatness, and increase in fat free mass. Partitioning effect of training on fat free mass from expected changes associated with growth and maturation is difficult, specifically during adolescence. Both sexes have a significant adolescent growth spurt in fat free mass, but boys more so than girls (Buckler and Green 1999, Cederstrema at al. 2007).
The influence of regular physical activity on body fat content relative to mass is essentially apparent in several studies of obese children. For example, a daily program of aerobic activity for two years resulted in marked decrease in skinfold thickness of obese children (Sasaki at al. 1987). Short-term training programs show a significant de- crease in estimated percept body fat in obese children 7 to 11 years of age (Gutin at al.
1997). The observed effects of 1-year aerobic physical activity were slightly moderate in the 7 to 8-year-old Hungarian boys (Vajda at al. 2007a, b). The summary effect of the used programs was that depot fat did not increase in study group, in contrast to the controls in which the sum of the skinfolds, relative fat content and BMI increased significantly. The stabilisation of the obesity markers was interpreted as a positive sign, but the authors stressed the increased level of activity was less effective in this respect than the combination of physical activity and diet. It is important to note, the effects of increased physical activity were apparently more manifest in the changes of the physiological variables. Both absolute and relative aerobic power, minute ventilation, oxygen pulse and running performance were characteristically better in the active group.
It is an additional information, even the peak physiological performances measured at the end of the program in study group were very moderate.
25
Data comparing the body composition of active and non-active girls during childhood and adolescence, or comparing changes in body composition associated with a program of regular physical activity are limited. Morris and associates (1997) com-pared the body composition of two groups of 9-year-old and 10-year-old girls, on that followed a 10-month training program and another that followed a normal pattern of physical activity. Girls in the two groups were similar in age, height, weight, body com-position, and stage of sexual maturity at the start of the study. The training program included 30 minutes of high-impact aerobic and strength training activities three times per week.
After 10 months, the trained girls had a greater gain in estimated lean mass (2.2± 1.1 kg) and smaller increase in fat mass (0.5±0.8 kg) than the girls who followed their normal pattern of physical activity (1.4±1.4 kg lean mass and 1.0±0.8 kg fat mass). Note that both groups gained in lean and fat masses over 10 months on the average, fatness didnotdecrease.Alsoconsiderableoverlapexisted between the trained and control girls, but individual differences among the subjects after 10 months were, unfortunately, not reported. Although the results are suggestive, they indicate the difficulties inherent in attempting to partition growth-related from training-related changes in estimated body composition. The question of sex differences in the responses of fat free mass and fat mass to regular programs of physical activity during growth needs further study.
Evidence for young adults indicate a significant decline in percentage fat and subcutaneous fat and an increase in fat free mass in males but not in females after 15 weeks of high-intensity training on a cycle ergometer (Tremblay at al. 1988)
2.3 Relationships of anthropometric characteristics and performance
The period between 5 and 8 years of age appears to be a transitional period in the development of strength and motor performance. Basic motor skills are reaching mature form at this time, but there is considerable variation among children. In addition, the application of these skills and techniques to specific test situations must be practised or learned. Therefore, this variation in the performance of specific strength and motor items at these ages is expected. Muscular endurance appears to show an increased pace of development is boys but not in girls. This difference may, in part, reflect a learning effect as the youngsters get adjusted to the test situation. Controlling for learning effects
26
is a significant logistic problem in longitudinal studies of motor performance: How much of the observed improvement effects growth-related changes and how much reflects learning to perform the tasks (Seger and Thorstensson 2000, American Academy of Pediatrics 2001, Huang and Malina 2002).
Changes in body size, physique, and body composition associated with growth and maturation are important factors that effect strength and motor performance. The relationship, however, vary among performance measures and with age. Relationships between size, physique, and body composition and performance are commonly viewed as correlations that statistically express the relationship between two variables.
Correlations do not indicate a cause-and-effect sequence of events. Mediating or moderating variables, as well as covariates, may be present. Correlations less than 0.30 are considered low, and those between 0.30 and 0.60 are moderate.
Correlations between height and weight and performance on a variety of motor tasks are generally low to moderate in children and adolescents 4 to 18 years of age and are of limited predictive utility. Correlations do not differ by sex. Tasks in which body is projected (dashes and jumps) generally show negative correlations with body mass.
Tasks in which the body is raised (pull-ups) or supported (flexed-arm hang) off the ground by the arms consistently have a negative correlations with body weight, and some reach into the moderate range. In contrast, correlations between stature and weight and a variety of strength tasks are higher than those for motor performance and generally fall in the moderate range. Thus, the taller and heavier individual tends to be stronger (Malina at al. 2005). Relationship between body size and performance are confounded in part by age. Age, height, and weight are related, so it is necessary to control for relationships among these variables when evaluating their specific contributions to variation in performance. With this procedure, the relationship between height and performance can be evaluated while statistically controlling for age and weight. The same can be done for weight, controlling for age and height, and for age, controlling for height and mass. This procedure is called partial correlation. Partial correlations for age, height, and weight and variety of motor performances do not differ between boys and girls and several trends are apparent (Malina 1994). Age is positively related to strength and motor performance even when stature and mass are controlled.
27
This positive relation suggests an important role of neuromuscular maturation and experience in performance on muscular strength and motor tasks. After controlling for age and stature, body mass tends to have a negative influence on performance, especially in tasks in which the body is projected, whereas after controlling for age and body weight, correlations between stature and performance tend to be positive (van Mechelen and Kemper 1995). Body dimensions are related to age, height, and weight. A question of interest is the contribution of specific body dimensions to strength and motor performance after the effects of age, stature, and weight are statistically controlled. Results of several such analyses in children from different health and nutritional backgrounds indicate that few variables add significantly to describing variation in strength and motor performance after age, stature, and mass are statistically controlled. Subcutaneous fatness, however, tends to exert a negative influence on performance (Benefice at al. 1999, Ozsváth at al. 2009). Age and also body size therefore appear to be primary factors influencing the strength and motor performance of children. Data for adolescents are a bit more complicated because individual differences in biological maturity associated with the adolescent growth spurt and sexual maturation must be taken into account (Iuliano Burns at al. 2001).
2.4 Effects of other environmental factors
The conditions into which children are born and subsequently reared can influence growth and maturation. These conditions include quality of living conditions, family size or number of siblings, place of residence (urban or rural), and overall socio- economic circumstances. All are related, and accounting for the effects of specific social factors is difficult.
General living conditions associated with socioeconomic status (SES) include variation in educational background of parents, purchasing power for food and, in turn, nutritional status, access to and use of health-care facilities and programs, and overall regularity of lifestyle. The SES of child‘s family is a significant factor that can affect growth and maturation. Criteria of SES vary considerably among studies and among different countries, so comparisons are difficult (Chumlea at al. 2003). Criteria relevant to one area, cultural group, or country are not necessarily relevant to other. Commonly used indicators of SES in developed, western countries include annual family income,
28
per capita income, occupation and education of the head of the household, and place of residence. Children from better-off socioeconomic circumstances within a country tend to be, on average, significantly taller and heavier than those from poorer socioeconomic conditions (Malina at al. 2005). In contrast to measures of body size, SES variation in peakheightvelocity (PHV) and age at menarche is generally smaller. Among Polish and British adolescents, those from better-off socioeconomic circumstances attain PHV and menarche, on average, slightly earlier than those in lesser socioeconomic conditions. In contrast, SES differences in PHV and menarche are not evident among Swedish adolescents (Bielicki 1986). SES variation in growth and maturity is generally specific to a given country. Generalisation from one country to another is difficult because criteria of socioeconomic circumstances vary and do not necessarily have the same meaning. Social welfare programs also vary among countries and may function to balance economic or income differentials among families and in turn SES differentials in growth and maturity status of children.
Family size, the number of siblings or children in a family, may be a confounding factor in evaluating the effects of SES on growth and maturity because larger family sizes occur more often among those of lower SES. In general, among better-of children whose fathers worked in non-manual occupations (higher SES), number of siblings does not affect height except in large families (5 or more siblings). On the other hand, among children whose fathers worked in manual occupation (lower SES), there is seen a gradient for a reduction in the height of children from families with one or two children through families with five or more children. Similar trends are apparent for the heights of adolescents (Billewitz at al. 1983). After taking into account differences in birth weight, maternal height, and age at PHV, adolescents from large families of unskilled manual workers are significantly shorter than average. Age at menarche also shows a variation with family size (Malina at al. 1997, Kemper 2000, Booth at al. 2002, Tomkinson at al. 2003).
Many case studies of children and adolescents clearly indicate the influence of adverse living conditions, particularly psychosocial or emotional circumstances, on maturation and growth. This condition is sometimes labelled ―psychosocial dwarfism‖ or
―deprivation dwarfism‖ in the clinical literature. Size attained is stunted and maturity
29
severely delayed, often by as much as 2 to 3 years. Children reared under such psycho- social and emotional circumstances ordinarily do not have specific endocrine or metabolic disorders or a familial history of growth retardation, and their diets are often adequate. The mechanisms through which the stressful home environment influences somatic growth and maturation are not known, but most likely include maternal deprivation, isolation of child from others, a disorganised family life, and, occasionally, physical abuse. Nevertheless, the matrix of environmental circumstances associated with ―deprivation dwarfism‖ can lead to impaired or suppressed growth hormone production and inadequate dietary intake or impaired nutrient utilisation. More specific aspects of the home environment also need consideration. Several recent studies, for example, suggest a potential influence of household composition (e.g., presence or absence of the father) and family distress (e.g., death of a parent, divorce, or potential alcoholism) on indicators of growth and maturity (Ge at al. 1996, Ellis at al. 1999, Ellis and Garber 2000). Familial distress is associated with an earlier age at menarche and shorter adult stature (Hulanickaat al. 2001). Although the associations are not strong, they suggest a role for family relationships and quality of life within the household as potential factors, among others, that may influence growth and maturation.
Motor development, performance, and physical activity occur in a social context (e.g., home, play, and school). Each of these contexts places specific demands on the motor competencies and physical activity of infants, children, and adolescents. The specific influences of social conditions have not been systematically evaluated in the con-text of motor development, performance, and activity. Social conditions interact with the child‘s rate of neuromuscular maturation, physical characteristics and rate of growth, prior to current experiences in motor activities, and habitual physical activity. A bio- social or bio-cultural framework is essential for discussions of social conditions on motor development and performance. The child carries out motor acts in a social context (Malina at al. 2005).
As in the case of growth and maturation, the specific influences of social conditions on motor development, performance, and activity are difficult to indicate. Quality of living conditions, family size or number of siblings, interactions among siblings, area of
30
residence (urban-rural or inner city-suburban), and overall socioeconomic circumstances, all of which are related, are potentially important factors to consider.
Variation in lifestyle associated with social class is often viewed in the context of socioeconomic status. Indicators of SES per se do not directly influence motor competence and physical activity. Rather, SES more likely influences motor competence and activity through effects on lifestyle, such as rearing practices, opportunity for activity, and access to special instruction, equipment, and facilities. A confounding factor with SES is its association with ethnicity and race in many parts of the world (Malina at al. 2005). Variation in motor development among ethnic groups is also often attributed to class differences in rearing, but class differences are not always consistent across studies (Malina 1980, 1988). Information on social class and motor achievements at ages beyond 2 years are not extensive, and studies indicate no relationship between SES and motor performance of school-age children. In a large sample of Polish youth, parental education and family living conditions commonly used proxies for SES, had only weak influence on a variety of motor performances (Wolanski, 1993). The role of variation in SES of the family on habitual physical activity of children and adolescents has received some attention. Among Taiwanese adolescents 12 to 14 years of age, no SES differences were seen in estimated total energy expenditure and energy expenditure in mode-rate-to-vigorous activities in boys for either weekdays or weekend days. Corresponding data for Taiwanese girls indicated no differences in estimated total energy expenditure by SES but greater energy expenditure in low SES girls in moderate-to-vigorous activities on weekend days.
Although these trends are suggestive, SES accounted for relatively little of the explained variance in estimated total energy expenditure (Huang and Malina 1996). In contrast, SES was related to physical activities of other samples of adolescents. In a sample of Canadian adolescents, high SES was related to the student‘s intention to exercise (Godin and Shephard 1986). Paternal occupation was significantly related to overall frequency of exercise (Gottlieb and Chen 1985).
Specific aspects of the socioeconomic environment may affect motor competence and physical activity, but these are not detected by the commonly used indices of SES. More important, the translation of specific SES or familial characteristics into variation in