Downloadedfromhttps://journals.lww.com/md-journalbyBhDMf5ePHKav1zEoum1tQfN4a+kJLhEZgbsIHo4XMi0hCywCX1AWnYQp/IlQrHD3tIQ5gQCIeyyUV9lmA4CJqvESHj3h56X5Qv2zPAlLVa0=on03/17/2018 Downloadedfromhttps://journals.lww.com/md-journalbyBhDMf5ePHKav1zEoum1tQfN4a+kJLhEZgbsIHo4XMi0hCywCX1AWnYQp/IlQrHD3tIQ5gQCIeyyUV9lmA4CJqvESHj3h56X5Qv2zPAlLVa0=on03/17/2018
Skin Autofluorescence and Mortality in Patients on Peritoneal Dialysis
Emı´lia Ma´csai, MD, PhD, Attila Benke, MD, and Istva´n Kiss, MD, PhD
Abstract:Skin autofluorescence (SAF) is a proven prognostic factor of mortality in hemodialysis patients. Traditional and nontraditional risk factors are almost equivalent in peritoneal dialysis (PD), and cardio- vascular disease (CVD) is the leading cause of death. Moreover, peritoneal glucose absorption accelerates the degenerative processes of connective tissues as in diabetes. In our study, we examined the predictive value of SAF for total mortality in the PD population.
Data were collected from 198 prevalently adult Caucasian PD patients. One hundred twenty-six patients (mean age 66.2 y, men [n¼73], diabetes ratio 75/126) had anamnestic CVD (coronary heart disease, cerebrovascular disease, peripheral arterial disease). Initially, we evaluated factors affecting SAF and CVD by multivariate linear regression. Survival rates were estimated by recording clinical and demographic data associated with mortality during a 36-month follow- up using the Kaplan–Meier method. Analyses were further stratified based on the presence or absence of CVD and SAF levels above or below the upper tercile 3.61 arbitrary units.
Skin autofluorescence was influenced by CVD (P<0.01, 95%
confidence interval [CI] 0.1–0.5) and white blood cell counts (P<0.001, 95% CI 0.031–0.117). According to the Spearman corre- lation, SAF correlated with peritoneal cumulative glucose exposure (P¼0.02) and elapsed time in PD (P¼0.008). CVD correlated with age (P<0.001, 95% CI 1.24–1.65) and diabetes (P<0.001, 95% CI 2.58–
10.66). More deaths were observed in the high SAF group than in the
low SAF group (34/68 vs 44/130;P¼0.04). Comparing the CVD() low SAF group survival (mean 33.9 mos, standard error [SE] 1.39) to CVD(þ) low SAF (mean 30.5 mos, SE 1.37,P¼0.03) and to CVD(þ) high SAF group (mean 27.1 mos, SE 1.83,P¼0.001), the difference was significant.
In conclusion, among PD patients, SAF values over 3.61 arbitrary units seem to be a predictor of mortality. The relationship among peritoneal glucose exposure, CVD, and diabetes suggests its suitability to charac- terize systemic cumulative glucose load in this patient population.
(Medicine94(45):e1933)
Abbreviations: AGE = advanced glycation end products, APD = automated peritoneal dialysis, BMI = body mass index, CGMS = continuous glucose monitoring system, CKD = chronic kidney disease, CVD = cardiovascular disease, DKD = diabetic kidney disease, GDP = glucose degradation products, HbA1C = hemoglobin A1C, hsCRP = high-sensitive C-reactive protein, PD
= peritoneal dialysis, PTH = parathyroid hormone, SAF = skin autofluorescence.
INTRODUCTION
I
ncidence of mortality in patients on renal replacement therapy remains unacceptably high, and is affected not only by pre- existing medical conditions but also by dialysis modalities and kidney failure.1Over the past few decades, there has been an increase in the average age of patients requiring dialysis, multiple morbidities due to diabetes have become more wide- spread, and survival disadvantages to the general population have become more and more pronounced.2Patients with dia- betes as a primary renal disease have higher mortality rates than those with diabetes as a comorbid condition, indicating that diabetes-induced organ damage probably affects survival.3 Traditional cardiovascular risk factors, including elevated serum cholesterol levels, blood pressure, smoking, obesity, and diabetes, contribute to mortality in dialyzed patients.4Hemodialysis and peritoneal dialysis (PD) display a slightly different pattern of mortality predictors: residual renal function, diabetes, age, malnutrition, inflammation, and protein loss.5Advanced-stage chronic kidney disease (CKD) is associ- ated with complex physiological and metabolic disturbances that are linked to poor overall and cardiovascular outcomes.
Combined effects of specific hormonal, inflammatory, nutri- tional, and metabolic factors may play key roles in mortality.6 The survival of diabetic PD patients is worse than that of the patients in the nondiabetic group, which can be mitigated by diet control, optimal PD-solution use, and meticulous predia- lytic control of cardiovascular risk factors.7Diabetes has been found to predict all-cause death in patients with high-sensitive C-reactive protein (hsCRP)>3 mg/L or serum albumin<38 g/L levels, although the outcome of patients with negative inflam- matory status was the same as that of nondiabetic individuals.
Therefore, evaluation and correction of inflammation in PD might improve survival even in diabetic patients.8
Editor: Leonardo Gilardi.
Received: August 14, 2015; revised: September 30, 2015; accepted:
October 4, 2015.
From the 3rd Dialysis Centre of B. Braun Avitum Hungary CPLC, Veszpre´m (EM, AB); and 1st Dialysis Centre of B. Braun Avitum Hungary CPLC, Department of Nephrology-Hypertension and Geriatrics, St Imre University Teaching Hospital and Div. Sect. of Geriatrics, 2nd Department of Internal Medicine, Semmelweis University, Budapest, Hungary (IK).
Correspondence: Emı´lia Ma´csai, 3rd Dialysis Centre of B. Braun Avitum Hungary CPLC, 8200 Veszpre´m/Hungary Korhaz u. 1, Veszpre´m, Hungary (e-mail: macsaim1@gmail.com).
The study on which this article was based, as well as manuscript develop- ment (electronic data collection form Nepho7 system, statistical analysis, monitoring patients at 10 dialysis centers during the study period), was funded by B. Braun Avitum Hungary CPLC. Other types of support included travel to ASN 2014 (this study was presented as poster) for EM.
Contributions Research idea and design: E.M; data collection from dialysis centers and managerial organization: AB; supervision and mentorship:
IK.
EM, AB, and IK are employees of B. Braun Avitum Hungary CPLC. The Authors disclose that they had no writing assistance. The Authors have never received any fees or honoraria outside the B. Braun Hungarian dialysis network relating to this study. The study design, data collection, analysis, interpretation of data, writing the report, decision to submit the report for publication all were within the B. Braun Avitum Hungary CPLC.
The authors have no conflicts of interest to disclose.
Copyright#2015 Wolters Kluwer Health, Inc. All rights reserved.
This is an open access article distributed under the Creative Commons Attribution-ShareAlike License 4.0, which allows others to remix, tweak, and build upon the work, even for commercial purposes, as long as the author is credited and the new creations are licensed under the identical terms.
ISSN: 0025-7974
DOI: 10.1097/MD.0000000000001933
O
BSERVATIONALS
TUDYIn hemodialysis patients, skin autofluorescence (SAF) has been found to be an independent predictor of mortality and to strongly correlate with CVD,9although in a later study, SAF showed no correlation with cardiovascular mortality.10Another study showed that SAF was significantly associated with car- diovascular mortality of patients on chronic hemodialysis.11 The association of SAF with the degree of atherosclerosis in a multivariate analysis proved to be independent of age, sex, diabetes, or renal failure.12
Molecular details of generation and accumulation of advanced glycation end products (AGEs) have been linked to increased risk of macrovascular and microvascular diabetic complications.13Moreover, AGEs are considered a subgroup of uremic toxins, because the accumulation of AGEs seems to be influenced by a decline in renal function. Moreover, SAF is a strong marker of cardiovascular mortality in CKD patients.14
Dialysis is moderately effective for the clearance of AGE fragments. Unfortunately, several types of renal replacement therapy contribute to AGE formation by increasing oxidative stress.15In end-stage renal disease, SAF seems to be involved in arterial stiffness,16diastolic dysfunction,17dialysis-related spon- dylosis, and arthropathy,18and is not altered by a single hemo- dialysis treatment alone.19Indeed, SAF and aortic stiffness were higher in PD patients than in HD patients even after adjustments for baseline characteristics.20In both dialysis modalities, there was a positive association between SAF and aortic stiffness. In the PD population, SAF correlated with kidney disease duration and dialysis vintage; the anuric, diabetic, and older patients had higher SAF levels.21In PD patients, SAF correlated with the duration of PD and glucose exposure dose and independently associated with cardiovascular morbidity. Multivariate analysis revealed that glucose exposure dose and SAF were the main risk factors for cardiovascular morbidity after adjustment by age, sex, and other traditional or uremic-related risk factors.22
An optimal glycemic marker in PD is currently unavail- able. According to the results of the continuous glucose monitoring system (CGMS), in cases of high transport status, the maximum glucose value and its increment after peritoneal exchange seemed to be more intensive in the subgroup of diabetic patients. The mean 24-hour subcutaneous glucose concentration of nondiabetic patients was also unexpectedly elevated. The percentage of glucose levels >5 mmol/L was significantly influenced by a higher glucose concentration in PD fluids and a higher peritoneal transport status.23Even in inte- grated assessments over 3 to 4 years, hemoglobin A1C (HbA1C) weakly correlated with the change in tissue skin AGE levels, suggesting that longer glucose exposure had an effect on connective tissue structure alterations.24In the case of patients with type II diabetes, SAF also was predictive of neuropathy and albuminuria.25 Also with regards to age and diabetes, the switch to icodextrin-based PD solution was also found to be a factor, and is likely associated with increased AGE exposure in patients on PD as a consequence of factors neces- sitating the regime change.26
Therefore, we decided to assess the impact of SAF values on patients’ mortality rate in a PD population, together with a consideration of other predictors of mortality.
METHODS Setting and Participants
This clinical study included 198 patients who were on PD treatment at 10 regional dialysis centers of the B. Braun Avitum Hungary CPLC Dialysis Network in spring 2010. A total of 128
patients were regularly treated with conventional lactate-buf- fered glucose-based PD solutions (Dianeal, Baxter Company Deerfield, IL). The remaining 70 patients had been previously switched to a dialysis regime, including 1 glucose-free icodex- trin solution (mainly night time) per day. In these patients, the long dwell PD solution had been replaced by icodextrin for about 13.5 months (median, interquartile range [IQR] 7–23 mos) before SAF assessment. The single-chamber heat sterili- zation PD solutions were manufactured, stored, and transported according to the current provider standards.
Patients were treated in accordance with relevant national guidelines,27 which are, in essence, identical to the current International Society for Peritoneal Dialysis (ISPD) guide- lines.28There were 3 patients (at least 1 y) after renal trans- plantation. All patients were considered Caucasian with Fitzpatrick classification skin types I to IV (ie, had a light skin). The minority of patients (27/198) were on automated peritoneal dialysis (APD). Exclusion criteria in this study included any history of malignancy, presence of local skin disorders, jaundice, and peritonitis within a month. The patients were followed up for the next 36 months, and deaths and causes of loss were recorded. Among the patients, 126 had overt CVD:
114 ischemic cardiac disease, 63 peripheral arterial insuffi- ciency, and 32 cerebrovascular abnormalities.
Quantitative Variables
Skin Autofluorescence Measurements
The Reader device used (DiagnOptics, Groningen, the Netherlands) for measurements also applied a new algorithm for the adjustment of SAF values according to skin color. The measurements between March and May 2010 were performed at room temperature during PD visits according to the manufac- turer’s instructions.29SAF values were expressed in arbitrary units (AU) calculated by dividing the average light intensity emitted by skin (per nm over the range from 420 nm to 600 nm) by the average excitation light intensity emitted by internal light source of the device (per nm over the range from 300 nm to 420 nm), and the quotient was multiplied by 100.
Outcome Variables
Follow-up and Total Mortality
Each PD patient’s cumulative exposure to PD glucose was calculated using data from strict daily follow-up clinical records, multiplying the daily exposure with the number of days on a given regime. Medical history regarding cardiovas- cular disorders and self-reported smoking habits was also obtained. Our observational study was approved by the County Hospital Ethical Committee (permission number: K-1411–2/
2010) and patients gave their written informed consent. After 36 months, data were taken from the dialysis units electronic registers and evaluated for survival.
Statistical Analysis
Parameters following normal distribution were reported using mean and standard deviation. Parameters with non-nor- mal distribution, such as C-reactive protein (CRP), parathyroid hormone (PTH), glutamic oxaloacetic transaminase (GOT), glutamic pyruvic transaminase (GPT), alanine aminotransferase (ALP), and gamma-glutamyltransferase (GGT), were reported using median and lower–upper quartile values (Q1–Q3).
Differences between the two independent groups were
compared using Student t test and Mann–Whitney U test.
Univariate and stepwise multivariate linear regression analyses were also performed to determine the factors influencing SAF.
Logistic regression was applied to determine factors influencing CVD. Kaplan–Meier analysis and log-rank test were used to evaluate survival results. The statistical analysis was performed using the STATISTICA software package version 10 (Tulsa, Oklahoma). We consideredP¼0.05 as significant.
RESULTS
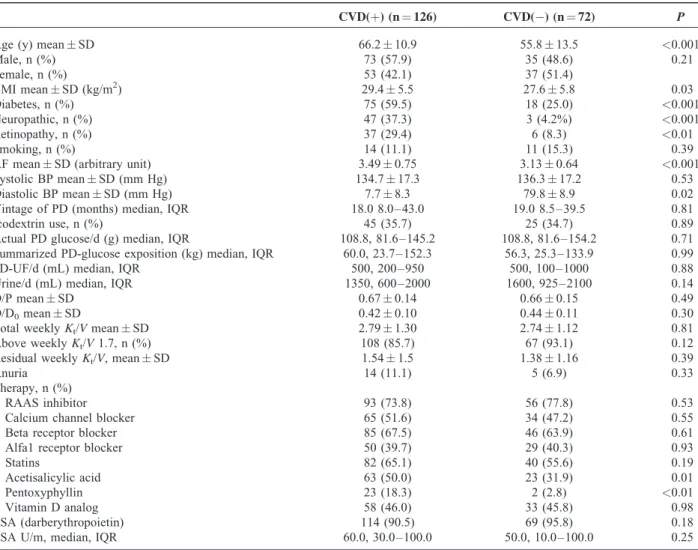
General Characteristics and Laboratory Data In total, 237 patients were screened, and 198 patients were enrolled and completed the trial. Table 1 and Table 2 show the baseline characteristics of the study sample population. The mean age of the patients with CVD (CVD[þ]) was 66.2 years, whereas the mean age was only 55.8 years in the group without CVD (CVD[]). The demographics were significantly different
between the two groups, including body mass index (BMI), percent of diabetes mellitus, neuropathy, retinopathy, SAF, diastolic blood pressure, total cholesterol levels, fasting glucose level, PTH, and serum calciumphosphate (CaxP).
Determinants of Initial Skin Autofluorescence Univariate linear regression analysis revealed that patients’ age, presence of CVD, time on PD, icodextrin use, ultrafiltration, leukocyte count, diastolic blood pressure, serum albumin level, serum total cholesterol level, serum GOT, and diabetes had a significant impact on patients’ SAF values.
Though stepwise multivariate evaluation indicated (Table 3) a significant effect from known CVD (P<0.01, 95% confi- dence interval [CI] 0.10–0.50), icodextrin use (P<0.01, 95%
CI 0.11–0.51), leukocyte count (P<0.001, 95% CI 0.031–
0.117), diastolic blood pressure (P¼0.03, 95% CI0.024 to 0.001), and serum total cholesterol (P¼0.03, 95% CI0.175 to0.01).
TABLE 1. Demographic and Clinical Data of Patients on Peritoneal Dialysis With or Without Cardiovascular Disease
CVD(þ) (n¼126) CVD() (n¼72) P
Age (y) meanSD 66.210.9 55.813.5 <0.001
Male, n (%) 73 (57.9) 35 (48.6) 0.21
Female, n (%) 53 (42.1) 37 (51.4)
BMI meanSD (kg/m2) 29.45.5 27.65.8 0.03
Diabetes, n (%) 75 (59.5) 18 (25.0) <0.001
Neuropathic, n (%) 47 (37.3) 3 (4.2%) <0.001
Retinopathy, n (%) 37 (29.4) 6 (8.3) <0.01
Smoking, n (%) 14 (11.1) 11 (15.3) 0.39
AF meanSD (arbitrary unit) 3.490.75 3.130.64 <0.001
Systolic BP meanSD (mm Hg) 134.717.3 136.317.2 0.53
Diastolic BP meanSD (mm Hg) 7.78.3 79.88.9 0.02
Vintage of PD (months) median, IQR 18.0 8.0–43.0 19.0 8.5–39.5 0.81
Icodextrin use, n (%) 45 (35.7) 25 (34.7) 0.89
Actual PD glucose/d (g) median, IQR 108.8, 81.6–145.2 108.8, 81.6–154.2 0.71
Summarized PD-glucose exposition (kg) median, IQR 60.0, 23.7–152.3 56.3, 25.3–133.9 0.99
PD-UF/d (mL) median, IQR 500, 200–950 500, 100–1000 0.88
Urine/d (mL) median, IQR 1350, 600–2000 1600, 925–2100 0.14
D/P meanSD 0.670.14 0.660.15 0.49
D/D0meanSD 0.420.10 0.440.11 0.30
Total weeklyKt/VmeanSD 2.791.30 2.741.12 0.81
Above weeklyKt/V1.7, n (%) 108 (85.7) 67 (93.1) 0.12
Residual weeklyKt/V, meanSD 1.541.5 1.381.16 0.39
Anuria 14 (11.1) 5 (6.9) 0.33
Therapy, n (%)
RAAS inhibitor 93 (73.8) 56 (77.8) 0.53
Calcium channel blocker 65 (51.6) 34 (47.2) 0.55
Beta receptor blocker 85 (67.5) 46 (63.9) 0.61
Alfa1 receptor blocker 50 (39.7) 29 (40.3) 0.93
Statins 82 (65.1) 40 (55.6) 0.19
Acetisalicylic acid 63 (50.0) 23 (31.9) 0.01
Pentoxyphyllin 23 (18.3) 2 (2.8) <0.01
Vitamin D analog 58 (46.0) 33 (45.8) 0.98
ESA (darberythropoietin) 114 (90.5) 69 (95.8) 0.18
ESA U/m, median, IQR 60.0, 30.0–100.0 50.0, 10.0–100.0 0.25
CVD(þ) patients with cardiovascular disease, CVD() patients without cardiovascular disease. BMI¼body mass index, BP¼blood pressure, D/P and D/D0¼transport character parameters, ESA¼erythropoietin-stimulating agent, IQR¼interquartile range,Kt/V¼weekly peritoneal dialysis dosis, PD¼peritoneal dialysis, RAAS¼renin-angiotensin-aldosterone system, SD¼standard deviation.
Cardiovascular Disease in the Study Cohort According to stepwise multivariate logistic regression results (Table 4), the presence of CVD was strongly correlated with age and diabetes.
Survival Results in Peritoneal Dialysis Patients We observed the survival of our patients over a 36-month period dividing the patient population into higher and lower SAF groups (according to the upper tercile SAF level 3.61 AU cut-off value). Comparing the survival curves, the lower SAF group had better results (P¼0.04) (Fig. 1). Next, the patients
were further stratified according to the presence of CVD and SAF levels. The advantage of a lower SAF was shown in both the CVD(þ) and CVD() status groups (Fig. 2). There were significant differences in survival in cases of CVD() with low SAF group compared with the CVD(þ) low SAF group (P¼0.03), and in the CVD() low SAF group versus the CVD(þ) high SAF group (P<0.01).
DISCUSSION
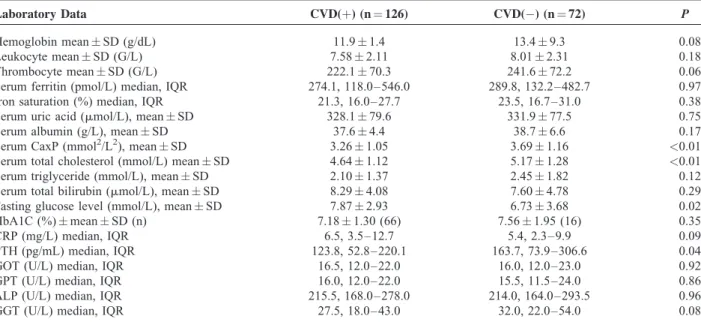
Peritoneal glucose absorption can change body compo- sition, dyslipidemia, and glycemic control, and putatively TABLE 2. Laboratory Data of Patients on Peritoneal Dialysis With or Without Cardiovascular Disease
Laboratory Data CVD(þ) (n¼126) CVD() (n¼72) P
Hemoglobin meanSD (g/dL) 11.91.4 13.49.3 0.08
Leukocyte meanSD (G/L) 7.582.11 8.012.31 0.18
Thrombocyte meanSD (G/L) 222.170.3 241.672.2 0.06
Serum ferritin (pmol/L) median, IQR 274.1, 118.0–546.0 289.8, 132.2–482.7 0.97
Iron saturation (%) median, IQR 21.3, 16.0–27.7 23.5, 16.7–31.0 0.38
Serum uric acid (mmol/L), meanSD 328.179.6 331.977.5 0.75
Serum albumin (g/L), meanSD 37.64.4 38.76.6 0.17
Serum CaxP (mmol2/L2), meanSD 3.261.05 3.691.16 <0.01
Serum total cholesterol (mmol/L) meanSD 4.641.12 5.171.28 <0.01
Serum triglyceride (mmol/L), meanSD 2.101.37 2.451.82 0.12
Serum total bilirubin (mmol/L), meanSD 8.294.08 7.604.78 0.29
Fasting glucose level (mmol/L), meanSD 7.872.93 6.733.68 0.02
HbA1C (%)meanSD (n) 7.181.30 (66) 7.561.95 (16) 0.35
CRP (mg/L) median, IQR 6.5, 3.5–12.7 5.4, 2.3–9.9 0.09
PTH (pg/mL) median, IQR 123.8, 52.8–220.1 163.7, 73.9–306.6 0.04
GOT (U/L) median, IQR 16.5, 12.0–22.0 16.0, 12.0–23.0 0.92
GPT (U/L) median, IQR 16.0, 12.0–22.0 15.5, 11.5–24.0 0.86
ALP (U/L) median, IQR 215.5, 168.0–278.0 214.0, 164.0–293.5 0.96
GGT (U/L) median, IQR 27.5, 18.0–43.0 32.0, 22.0–54.0 0.08
ALP¼alanine aminotransferase, CaxP¼serum calciumphosphate, CRP¼C-reactive protein, CVD¼cardiovascular disease, GGT¼gamma- glutamyltransferase, GOT¼glutamic oxaloacetic transaminase, GPT¼glutamic pyruvic transaminase, HbA1C¼hemoglobin A1C, IQR¼interquartile range, PTH¼parathyroid hormone, SD¼standard deviation.
TABLE 3. Multivariate Linear Regression of Factors Effecting Initial SAF Values
Univariate Stepwise Multivariate
b 95% CI P b 95% CI P
Age 0.011 0.003 to 0.018 <0.01 — — NS
CVD 0.36 0.15 to 0.57 <0.001 0.30 0.10 to 0.50 <0.01
PD vintage 0.005 0.001 to 0.009 0.02 — — NS
Icodextrin use 0.34 0.13 to 0.55 <0.01 0.31 0.11 to 0.51 <0.01
UF/day 1.8104 0.5104to 3.5104 0.04 — — NS
Leukocyte count 0.061 0.014 to 0.11 0.015 0.074 0.031 to 0.117 <0.001
Diastolic blood pressure 0.017 0.029 to0.006 <0.01 0.012 0.024 to0.001 0.03
Serum albumin 0.02 0.04 to0.001 0.04 — — NS
Serum total cholesterol 0.14 0.23 to0.06 <0.001 0.093 0.175 to0.010 0.03
GOT 0.013 0.025 to0.002 0.02 — — NS
Diabetes 0.33 0.13 to 0.53 <0.01 — — NS
Multivariate linear regression evaluation indicated significant effect of known cardiovascular disease, icodextrin use, leukocyte count, diastolic blood pressure, and serum total cholesterol on initial SAF values. CI¼confidence interval, CVD¼cardiovascular disease, GOT¼glutamic oxaloacetic transaminase, NS¼not significant, PD¼peritoneal dialysis.
Regression coefficient.
increase cardiometabolic risk through several pathways.30 Cumulative metabolic stress and the repetitive transient hyper- glycemia due to PD fluids result in elevated levels of tissue AGE in dialysis patients and ensuing systemic CVD.31Plasma AGE levels have been reported to be significantly higher after a 3-month exposure to high glucose-degradation product (GDP) solution than after treatment with low-GDP fluid, thus worsen- ing the cardiovascular risk profile of dialyzed children.32These observations are in line with our results, indicating that systemic glucose load can contribute to tissue AGE accumulation and vascular changes, and can eventually predict mortality.
Measurement of SAF is gaining widespread approval in the diagnosis of diabetes and intermediate carbohydrate tolerance disturbances, and screening values are empowered by the well known performance of SAF in predicting diabetic compli- cations.33Measurement of SAF can indicate tissue alterations long before they would be revealed by conventional screening methods or cause clinical signs.34
There is a lack of data from large prospective trials regarding the effects of different PD solutions in patients with and without diabetes on mortality. Therefore, it is difficult to make definite conclusions about the clinical significance of PD- related glucose exposure.35 However, a recent evaluation revealed there was an association between SAF and all-cause (2.09-fold increase for each 1 AU increase in AGE values) and sepsis-related mortality in PD patients, albeit the number of patients (n¼102) were limited.36Better survival with biocom- patible PD solutions has also been observed in early studies.37 PD is associated with an obligatory absorption of carbohydrates, although clinical benefit of glucose-sparing regimens are incon- sistent and potentially small,38 according to even the most TABLE 4. Logistic Regression Results of Clinical Factors on the Presence of Initial Cardiovascular Disease
Univariate Stepwise Multivariate
OR 95% CI P OR 95% CI P
Age increase 5 y 1.41 1.23–1.61 <0.001 1.43 1.24–1.65 <0.001
BMI increase 5 kg/m2 1.35 1.03–1.78 0.03 — — NS
Diastolic blood pressure increase 5 mm Hg 0.81 0.68–0.96 0.02 — — NS
CaxP increase 0.5 mmol2/L2 0.84 0.73–0.96 0.01 — — NS
Cholesterol increase 1 mmol/L 0.69 0.54–0.89 <0.01 — — NS
Fasting blood glucose 1 mmol/L 1.25 1.02–1.29 0.02 NS
Diabetes 4.42 2.32–8.40 <0.001 5.24 2.58–10.66 <0.001
SAF increase one arbitrary unit 2.06 1.33–3.19 <0.01 — — NS
Logistic regression results revealed significant role of age and diabetes on the presence of cardiovascular disease. BMI¼body mass index, CaxP¼serum calciumphosphate, CI¼confidence interval, OR¼odds ratio, SAF¼skin autofluorescence.
FIGURE 1. Survival results according to high or low skin auto- fluorescence values. Patients in the lower SAF (SAF<3.61) group (n¼130) had better survival results than patients in the higher SAF group (n¼68) (P¼0.04). Mortality in the low SAF group was 33.9% (44/130); mean survival was 31.8 months (SE 1.0, 95% CI 29.9–33.8). Mortality in the high SAF group was 50% (34/68);
mean survival was 28.6 months (SE 1.47, 95% CI 25.8–31.5).
CI¼confidence interval, SAF¼skin autofluorescence, SE¼ standard error.
FIGURE 2. Survival results according to high or low skin auto- fluorescence values stratified according to the presence of cardi- ovascular disease. Patients were stratified into the lower (SAF<3.61) and higher SAF groups with (CVD[þ]) or without presence of CVD (CVD[]). Mortality in the CVD()low SAF group was 22.6% (12/53), mean survival was 33.9 months (SE 1.39, 95% CI 31.2–36.6). Mortality in the CVD()high SAF group was 36.8% (7/19), mean survival was 32.7 months (SE 2.1, 95% CI 28.7–36.7). Mortality in the CVD(þ) low SAF group was 41.6%
(32/77), mean survival was 30.5 months (SE 1.37, 95% CI 27.8–
33.1). Mortality in the CVD(þ) high SAF group was 55.1% (27/
49), mean survival was 27.1 months (SE 1.83, 95% CI 23.5–30.6).
CI¼confidence interval, CVD¼cardiovascular disease, SAF¼skin autofluorescence, SE¼standard error.
recent analysis. Biocompatible PD solutions, with properties including neutral pH and low GDP regimes, can help to preserve higher residual renal function and urine volume, whereas icodextrin prevents fluid overload by improving peritoneal ultrafiltration in PD.39
Some clinicians have offered biocompatible, nonglucose- based PD solutions to diabetic patients for several years. The preference of low-GDP PD solutions and elective introduction of icodextrin are considered to be part of general therapeutic strategies of diabetic patients on PD.40 Biocompatible and nonglucose-based PD solutions might have advantageous effect on long-term membrane degeneration, as well as on systemic metabolic control.41 Icodextrin has a well known beneficial effect in the management of high transporter diabetic patients on PD by improving peritoneal ultrafiltration and simul- taneously reducing overexposure to glucose.42
In line with the metabolic memory theory in diabetic patients starting PD, the prevalence of CVD is three times higher than in nondiabetic counterparts, which partially explains the increased morbidity rates and lower survival observed in diabetic patients with CVD.43 According to the analysis of predialysis patients with CKD, SAF was found to be independently correlated to renal failure progression. Hence, it seems to be a suitable tool for risk stratification in this popu- lation. This relationship was more pronounced in advanced stages of renal failure and presence of diabetes.44In a prospec- tive cohort of CKD stage 3 patients, SAF correlated signifi- cantly with a poorer 3.6-year survival, but this association was attenuated to include CVD, diabetes, estimated glomerular filtration rate (eGFR), microalbuminuria, and other established risk factors.45Metastatic calcification might be the putative link to mortality. In patients with stage 3 to stage 5 CKD, multislice computed tomography estimated a coronary artery calcification score (CACS)>400, correlated with SAF, even when adjusting for age, CRP, eGFR, and intact PTH (iPTH).46
Improvements in risk of mortality in patients on dialysis will in large part be dependent on the rate of decline in eGFR values during predialysis care.47Better management of diabetic kidney disease (DKD) in the earlier stages can slow down rates of disease progression and premature death from cardiovascular causes.
Molecular pathways of peritoneal membrane remodeling are similarly complicated, AGE products represent theoretical mediators, and hence newer PD solutions along with specific inhibitors can help to develop future strategies for preservation of peritoneal membrane and residual kidney function.48
We note some limitations to our study. We assessed patients currently undergoing PD; however, we ignored their previous hemodialysis period, and 3 patients returned to PD more than 1 year after failure of their kidney graft. We calculated glucose burden according to the prescription used, which can be a bit different from the amount actually provided, except for 27 APD patients. We should expect a potential presence of additional hidden malignancies (mean ages were 55.8 and 66.2 y, diabetes ratios were 25% and 59.5% in the group without CVD and with CVD, respectively) in the study cohort during the observation period; however, there were only 5 reported deaths. Because of the known adverse effect of jaundice on SAF measurements, we excluded all patients with hepatic disease; thus the results did not exactly reflect the conventional PD population.
In conclusion, SAF measurements in the PD population may help to evaluate the previous cumulative metabolic burden, and SAF values over 3.61 AU provide a reliable cut-off for predicting 3-year mortality.
ACKNOWLEDGMENTS
We thank all medical directors of B. Braun Avitum Hungary CPLC Dialysis Network (Ga´bor Varga MD, Jo´zsef Ne´meth MD, Tama´s Szabo´ MD, Ma´ria Hengsperger MD, Ja´nos Szegedi MD, Zolta´n Amma MD, Imre Kulcsa´r MD, Lajos Nagy MD) for providing administrative and technical support for this research project.
The authors also especially thank Andra´s Paksy MD, for his invaluable help and his expert assistance with the statistical analyses.
We are grateful to Mr Jasper Dijkstra MSc, for his con- tribution of lending the AGE Reader device in 2010.
REFERENCES
1. Ortiz A, Covic A, Fliser D, et al., Board of the EURECA-m Working Group of ERA-EDTA. Epidemiology, contributors to, and clinical trials of mortality risk in chronic kidney failure.Lancet.
2014;383:1831–1843.
2. van Walraven C, Manuel DG, Knoll G. Survival trends in ESRD patients compared with the general population in the United States.
Am J Kidney Dis.2014;63:491–499.
3. Schroijen MA, van de Luijtgaarden MW, Noordzij M, et al. Survival in dialysis patients is different between patients with diabetes as primary renal disease and patients with diabetes as a co-morbid condition.Diabetologia.2013;56:1949–1957.
4. Carrero JJ, de Mutsert R, Axelsson J, et al., NECOSAD Study Group. Sex differences in the impact of diabetes on mortality in chronic dialysis patients.Nephrol Dial Transplant.2011;26:270–276.
5. Madziarska K, Weyde W, Penar J, et al. Mortality predictor pattern in hemodialysis and peritoneal dialysis diabetic patients in 4-year prospective observation.Postepy Hig Med Dosw (Online).
2013;67:1076–1082.
6. Slee AD. Exploring metabolic dysfunction in chronic kidney disease.
Nutr Metab (Lond).2012;9:36. doi: 10.1186/1743-7075-9-36.
7. Kim YL. Can we overcome the predestined poor survival of diabetic patients? Perspectives from pre- and post-dialysis.Perit Dial Int.
2007;27:S171–175.
8. Xu R, Han Q, Zhu T, et al. Diabetic patients could do as well as non-diabetic patients without inflammation on peritoneal dialysis.
PLoS One.2013;8:e80486.
9. Meerwaldt R, Hartog JW, Graaff R, et al. Skin autofluorescence, a measure of cumulative metabolic stress and advanced glycation end products, predicts mortality in hemodialysis patients.J Am Soc Nephrol.2005;16:3687–3693.
10. Gerrits EG, Lutgers HL, Smeets GH, et al. Skin autofluorescence: a pronounced marker of mortality in hemodialysis patients.Nephron Extra.2012;2:184–191.
11. Kimura H, Tanaka K, Kanno M, et al. Skin autofluorescence predicts cardiovascular mortality in patients on chronic hemodialysis.Ther Apher Dial.2014;18:461–467.
12. den Dekker MA, Zwiers M, van den Heuvel ER, et al. Skin autofluorescence, a non-invasive marker for AGE accumulation, is associated with the degree of atherosclerosis.PLoS One.
2013;8:e83084.
13. Stirban A, Gawlowski T, Roden M. Vascular effects of advanced glycation endproducts: clinical effects and molecular mechanisms.
Mol Metab.2013;3:94–108.
14. Arsov S, Graaff R, van Oeveren W, et al. Advanced glycation end- products and skin autofluorescence in end-stage renal disease: a review.Clin Chem Lab Med.2014;52:11–20.
15. Gerrits EG, Smit AJ, Bilo HJ. AGEs autofluorescence and renal function.Nephrol Dial Transplant.2009;24:710–713.
16. Ueno H, Koyama H, Tanaka S, et al. Skin autofluorescence, a marker for advanced glycation end product accumulation, is associated with arterial stiffness in patients with end-stage renal disease.Metabolism.2008;57:1452–1457.
17. Hartog JW, Hummel YM, Voors AA, et al. Skin-autofluorescence, a measure of tissue advanced glycation end-products (AGEs), is related to diastolic function in dialysis patients.J Card Fail.
2008;14:596–602.
18. Matsumoto T, Tsurumoto T, Baba H, et al. Measurement of advanced glycation endproducts in skin of patients with rheumatoid arthritis, osteoarthritis, and dialysis-related spondyloarthropathy using non-invasive methods.Rheumatol Int.2007;28:157–160.
19. Graaff R, Arsov S, Ramsauer B, et al. Skin and plasma autofluor- escence during hemodialysis: a pilot study.Artif Organs.
2014;38:515–518.
20. Mac-Way F, Couture V, Utescu MS, et al. Advanced glycation end products, aortic stiffness, and wave reflection in peritoneal dialysis as compared to hemodialysis.Int Urol Nephrol.
2014;46:817–824.
21. Oleniuc M, Schiller A, Secara I, et al. Evaluation of advanced glycation end products accumulation, using skin autofluorescence, in CKD and dialysis patients.Int Urol Nephrol.2012;44:1441–1449.
22. Jiang J, Chen P, Chen J, et al. Accumulation of tissue advanced glycation end products correlated with glucose exposure dose and associated with cardiovascular morbidity in patients on peritoneal dialysis.Atherosclerosis.2012;224:187–194.
23. Skubala A, Zywiec J, Zełobowska K, Gumprecht J, Grzeszczak W.
Continuous glucose monitoring system in 72-hour glucose profile assessment in patients with end-stage renal disease on maintenance continuous ambulatory peritoneal dialysis.Med Sci Monit.
2010;16:CR 75-83.
24. Gerrits EG, Lutgers HL, Kleefstra N, et al. Skin advanced glycation end product accumulation is poorly reflected by glycemic control in type 2 diabetic patients (ZODIAC-9).J Diabetes Sci Technol.
2008;2:572–577.
25. Gerrits EG, Lutgers HL, Kleefstra N, et al. Skin autofluorescence: a tool to identify type 2 diabetic patients at risk for developing microvascular complications.Diab Care.2008;31:517–521.
26. Ma´csai E, Benke A, Cseh A´ , Va´sa´rhelyi B. Factors influencing skin auto-fluorescence of patients with peritoneal dialysis [Hungarian].
Acta Physiol Hung.2012;99:216–222.
27. The adequate and optimal dialysis treatment. Guideline of the Hungarian Society of Nephrology. Ed. by: I. Kiss. http://www.
drdiag. hu/iranyelvek. php?id¼581 & tipus¼0#fm [Hungarian].
Accessed March 6, 2005.
28. Lo WK, Bargman JM, Burkart J, et al. Guideline on targets for solute and fluid removal in adult patients on chronic peritoneal dialysis.Perit Dial Int.2006;26:520–522.
29. DiagnOptics website. http://www.diagnoptics.com/advanced-glyca- tion-endproducts/measuring-ages. Accessed 2009.
30. Holmes CJ. Reducing cardiometabolic risk in peritoneal dialysis patients: role of the dialysis solution.J Diabetes Sci Technol.
2009;3:1472–1480.
31. McIntyre NJ, Chesterton LJ, John SG, et al. Tissue-advanced glycation end product concentration in dialysis patients.Clin J Am Soc Nephrol.2009;5:51–55.
32. Schmitt CP, von Heyl D, Rieger S, et al., Mid European Pediatric Peritoneal Dialysis Study Group (MEPPS). Reduced systemic advanced glycation end products in children receiving peritoneal dialysis with low glucose degradation product content.Nephrol Dial Transplant.2007;22:2038–2044.
33. Smit AJ, Smit JM, Botterblom GJ, Mulder DJ. Skin autofluorescence based decision tree in detection of impaired glucose tolerance and diabetes.PLoS One.2013;8:e65592.
34. Ma´csai E. Skin autofluorescence measurement in the clinical practice of diabetology and nephrology [Hungarian].Orv Hetil.
2012;153:1651–1657.
35. Garcı´a-Canto´n C, Rufino-Herna´ndez JM, Vega-Dı´az N, et al. A comparison of medium-term survival between peritoneal dialysis and haemodialysis in accordance with the initial vascular access.
Nefrologia.2013;33:629–639.
36. Siriopol D, Hogas S, Veisa G, et al. Tissue advanced glycation end products (AGEs), measured by skin autofluorescence, predict mortal- ity in peritoneal dialysis.Int Urol Nephrol.2014;47:563–569.
37. Han SH, Ahn SV, Yun JY, Tranaeus A, Han DS. Mortality and technique failure in peritoneal dialysis patients using advanced peritoneal dialysis solutions.Am J Kidney Dis.2009;54:711–720.
38. Mehrotra R, de Boer IH, Himmelfarb J. Adverse effects of systemic glucose absorption with peritoneal dialysis: how good is the evidence?Curr Opin Nephrol Hypertens.2013;22:663–668.
39. Cho Y, Johnson DW, Craig JC, Strippoli GF, Badve SV, Wiggins KJ. Biocompatible dialysis fluids for peritoneal dialysis.Cochrane Database Syst Rev.2014;3:CD007554.
40. Cotovio P, Rocha A, Rodrigues A. Peritoneal dialysis in diabetics:
there is room for more.Int J Nephrol.2011. doi: 10.4061/2011/
914849914849.
41. Blake PG. Should nonglucose containing peritoneal dialysis solutions be used in all patients to avoid long-term membrane injury?Semin Dial.2011;24:450–451.
42. Paniagua R, Ventura MD, Avila-Dı´az M, et al. Icodextrin improves metabolic and fluid management in high and high-average transport diabetic patients.Perit Dial Int.2009;29:422–432.
43. Portole´s J, Corchete E, Lo´pez-Sa´nchez P, Coronel P, Ocan˜a J, Ortiz A. Patients on peritoneal dialysis with type 2 diabetes have poorer outcomes than non-diabetics due to preceding cardiovascular comor- bidity.Nefrologı´a.2009;29:336–342.
44. Tanaka K, Nakayama M, Kanno M, et al. Skin autofluorescence is associated with the progression of chronic kidney disease: a prospective observational study.PLoS One.2013;8:e83799.
45. Fraser SD, Roderick PJ, McIntyre NJ, et al. Skin autofluorescence and all-cause mortality in stage 3 CKD.Clin J Am Soc Nephrol.
2014;9:1361–1368.
46. Wang AY, Wong CK, Yau YY, Wong S, Chan IH, Lam CW. Skin autofluorescence associates with vascular calcification in chronic kidney disease.Arterioscler Thromb Vasc Biol.2014;34:1784–1790.
47. Coresh J, Turin TC, Matsushita K, et al. and the CKD Prognosis Consortium: decline in estimated glomerular filtration rate and subsequent risk of end-stage renal disease and mortality.JAMA.
2014;25:2518–2531.
48. Schilte MN, Celie JW, Wee PM, Beelen RH, van den Born J.
Factors contributing to peritoneal tissue remodeling in peritoneal dialysis.Perit Dial Int.2009;29:605–617.

![andcancers.Insulinresistanceisthemostcommonmetabolicdysregulationassociated ].SeveralfactorshavecontributedtotheincreasedprevalenceofobesityinIndonesia,includingincreaseinpercapitaincome,sedentarylifestyle,anddietary ].TheprevalenceofobesityinIndonesianwo](data:image/gif;base64,R0lGODlhAQABAIAAAP///wAAACH5BAEAAAAALAAAAAABAAEAAAICRAEAOw==)