Effect of malnutrition and body composition on the quality of life of COPD patients
M. FEKETE
1, V. FAZEKAS-PONGOR
1, P. BALAZS
1, S. TARANTINI
2,3, G. SZOLLOSI
4, J. PAKO
6, A.N. NEMETH
1and J.T. VARGA
5,6p1Department of Public Health, Faculty of Medicine, Semmelweis University, Budapest, Hungary
2Department of Biochemistry and Molecular Biology, University of Oklahoma Health Sciences Center, Oklahoma City, OK, USA
3Department of Health Promotion Sciences, College of Public Health, University of Oklahoma Health Sciences Center, Oklahoma City, OK, USA
4Department of Family and Occupational Medicine, Faculty of Public Health, University of Debrecen, Debrecen, Hungary
5Department of Pulmonology, Semmelweis University, Budapest, Hungary
6National Koranyi Institute for Pulmonology, Budapest, Hungary
Received: October 26, 2020 • Accepted: January 18, 2021 Published online: June 29, 2021
© 2021 The Author(s)
ABSTRACT
Background:Pathological alterations in nutritional status may develop in Chronic Obstructive Pulmonary Disease (COPD) patients through production of inflammatory cytokines and inadequate diet.Objective:
The aim of our study was to determine the correlation between nutritional status and quality of life of COPD patients.Methods:We evaluated the nutritional status of COPD patients of Hungarian National Koranyi Institute for Pulmonology using the Malnutrition Universal Screening Tool (MUST) and bioelectrical impedance analysis (BIA) between January 1 and June 1, 2019. Lung function, physical fitness, and respiratory muscle strength were included in the assessment.Results:Fifty patients (mean age was 66.3
±9.6 years) participated in our study. Mean body mass index (BMI) was 26.2±6.1 kg/m2and mean fat- free mass index (FFMI) was 16.8±2.4 kg/m2. Overweight patients had better lung function values (FEV1ref
%: 46.3±15.2) than normal (FEV1ref%: 45.1±20.9) and underweight patients (FEV1ref%: 43.8±16.0).
The Modified Medical Research Council Dyspnea Scale (mMRC) was significantly associated with various parameters; strongest correlation was found with FFMI (r50.537,P< 0.001), skeletal muscle mass index
pCorresponding author. Department of Pulmonology, Semmelweis University, Budapest, Hungary. Tel.:þ36 208250248. E-mail: varga.janos_tamas@med.semmelweis-univ.hu
(SMMI) (r5 0.530, P < 0.001), and 6-minute walking distance (6MWD) (r 50.481,P < 0.001).
Conclusions:Our results indicate that malnourished COPD patients may have reduced lung function and lower quality of life compared to normal weight patients. Thus, our findings suggest that nutritional therapy be included in the treatment of COPD patients combined with nutritional risk screening and BIA during the follow-up.
KEYWORDS
chronic obstructive pulmonary disease, bioelectrical impedance analysis, body-mass index, fat-free mass index, nutritional status
INTRODUCTION
The pathogenesis and clinical manifestations of Chronic Obstructive Pulmonary Disease (COPD) appear typically as pulmonary inflammation and structural abnormalities; yet in several cases, systemic lesions may also be present [1]. Evaluation of nutrition, diet, and body composition is also considered highly important in the treatment of COPD patients [2]. COPD often correlates with one or more comorbidities (such as hypertension, atherosclerosis, chronic heart failure, lung cancer, osteoporosis, and depression), which worsen the underlying disease [3,4]. Muscle weakness and atrophy as well as weight loss are very common in COPD, and are associated with changes in body composition [5]. Low body mass index (BMI <21 kg/m2) leads to higher mortality and reduced quality of life [6]. Low body weight consequently appears to be an independent marker of poor disease outcome. However, BMI is not its exclusive indicator, thus it is recommended to use it together with fat-free mass (FFM) and fat-free mass index (FFMI) [7].
Low BMI is measured in 10–15% of patients with mild-to-moderate disease, and in 50% of patients with advanced-stage disease and chronic respiratory failure [8]. Exact causes of weight loss are not clearly identified thus far, although fast metabolic rate un- compensated by adjusted calorie intake is considered to play an essential role in its development [8].
Numerous techniques are used to assess body composition in COPD, including bioelectrical impedance analysis (BIA), anthropometry, dual-energy X-ray absorptiometry (DEXA) and more advanced imaging technologies, such as magnetic resonance imaging, computed tomography and high resolution computed tomography [9]. BIA is a bedside method approved in numerous clinical studies, as it has various advantages due to its portability, affordability, and user- friendliness [10]. This method applies a low alternating current through electrodes attached to the wrist and ankle. The resistance measured is used to calculate the lean body mass (LBM). BIA is more reliable for identifying nutritional excesses if compared with traditional anthropometric approaches [10].
The number of studies focusing on analyzing body composition is continuously increasing. The theory that muscles do more than mechanical movement and storing proteins and carbohydrates have become an important research topic. Musculoskeletal tissue acts as an autocrine, paracrine, and endocrine organ, which has an effect on its own operation and that of adjacent and distant organs [11]. Researchers demonstrated that skeletal muscle fibers
produce hormone-like myokines for physical activity, such as interleukin-6,-8,-15, brain- derived neurotrophic factor, and leukemia inhibitory factor (LIF), which also have anti-in- flammatory ability [12]. Additionally, growing evidence supports the role for metabolic in- terventions and age-related pathologies to modulate cellular and molecular pathways in skeletal muscle [13].
From a clinical aspect, progressive impairment of the respiratory function in COPD is associated with altered nutritional status, which is a serious problem in itself, and its conse- quences also influence the natural course of COPD. Routine treatment of COPD patients does not include body composition tests, although the course of the disease justifies it, since the production of inflammatory cytokines can shift metabolic balance towards catabolism.
Furthermore, lower physical activity and restricted diets can also be observed [14, 15]. The factors listed, individually and in combination, further increase the risk of total weight and/or fat-free weight loss. Moreover, poor nutritional status increases the morbidity rate, the fre- quency of infections, and the length of hospital stay decreases the patients’quality of life [16].
Our research aimed to study the association between low body weight and the severity of COPD, and to determine the patients’nutritional status and its correlation with their quality of life.
METHODS
Study design and population
A cross-sectional study was performed among COPD patients of the Hungarian National Koranyi Institute for Pulmonology. All patients were given oral and written information on the study and they signed statements of consent. Participation was voluntary. The study was approved by the regional Ethical Committee (License Number: TUKEB 44402- 2/2018/EKU) and complies with the Declaration of Helsinki. Inclusion criteria were age
≥40 years and the concurrent diagnosis of COPD (post-bronchodilation FEV1/FVC<70%).
Exclusion criteria were implanted pacemaker, any implantation or prosthesis, pregnancy, existence of severe dehydration, edema, or other chronic diseases (e.g. cancer or endo- crine disorders).
Measurements
In our sample (n 5 50) for combined nutrition status risk screening a Malnutrition Universal Screening Tool (MUST) questionnaire [17] was used with bioelectric impedance analysis (BIA) based on body composition analysis. The following parameters were included in the evaluation of the MUST questionnaire: BMI (0 points, if BMI is over 20 kg/
m2; 1 point, if BMI was between 18.5 and 20; and 2 points, if BMI was less than 18.5 kg/
m2), amount of weight loss (0 points, if it was less than 5%; 1 point, if it was 5–10%; 2 points, if it was over 10%), and the effect of any acute disease on food intake (0 points, if there was no acute disease and the food intake was satisfactory; 2 points in any other case).
Patients were considered to be at low risk if they scored 0 points, medium risk was 1 point, and high risk was 2–6 points. One of the limitation of the MUST questionnaire is that it is based only on BMI and does not take into account the body composition. To compensate
it, we also performed a body composition analysis with an InBody170 multi-frequency medical device, which measures body mass and calculates body fat percentage, muscle percentage, water content, and body mass index. Patients were instructed not to eat or drink and not to perform strenuous physical activity for at least 2 h before the mea- surement. The analysis was performed after discharging urine and stool, and preferably not during menstruation. Patients were asked to undress down to their underwear, remove jewelry, and stand barefoot. We also paid attention to posture (position at the measuring points, arms not touching the body) and room temperature. Total body weight, derived BMI, lean mass (FFM5 lean massþbone mineral density), and derived FFMI (FFMI5 FFM/height2) were calculated. Malnourishment was defined as FFMI <15 kg/m2 for fe- males and <16 kg/m2for males, which are considered as clinically useful proxies in the age range of most COPD patients [18,19]. Based on the BMI, COPD patients were categorized as normal weight (BMI ≥ 21 and <25 kg/m2), underweight (BMI <21 kg/m2) and over- weight (BMI ≥ 25).
Spirometry analysis and 6-minute walking distance (6MWD) were also part of the mea- surements. Spirometry included the post-bronchodilator forced expiratory volume in the first second (FEV1). The results were expressed as a percentage of the predicted values. For the assessment of 6MWD [20], patients were instructed to walk up and down the hallway for a maximum of 6 min.
To measure quality of life, we used the Hungarian, disease-specific 40-question version of the Saint George’s Respiratory Questionnaire (SGRQ-C) [21,22]. Factors that influence quality of life were divided into three categories: symptoms, activity, and the impact of lung disease on daily lifestyle. Weighted values of specific answers were used to calculate the scores for each category and the total sum. Higher scores of this questionnaire indicate lower quality of life.
Patients administered the questionnaire in controlled conditions under the coordinator’s su- pervision. The severity of dyspnea was rated according to the Modified Medical Research Council Dyspnea Scale (mMRC) [23, 24]. Based on the outcomes, patients were assigned to three categories: mild dyspnea (mMRC score of 0–1) moderate dyspnea (mMRC score of 2–3) and severe dyspnea (mMRC score of 4). Patients also completed the COPD Assessment Test (CAT) questionnaire, which contains eight questions about of the patients’ health status. A maximum of 40 points can be achieved with higher scores indicating lower quality of life [25].
Statistical analysis
Since the majority of data did not show normal distribution (verified by Sapphiro-Wilk test), non-parametric statistical methods were used in our study. Descriptive statistics and continuous variables were interpreted by averages with standard deviations (SD) and 95% confidence in- tervals. Categorical data were presented with case numbers and proportions. Mann-Whitney tests were used to detect the differences of continuous variables between the two groups. In the case of more than two groups, Kruskal-Wallis ANOVA tests were used. Frequency differences of categorical variables were examined by Fisher’s exact test. Spearman’s correlation tests were used to indicate the relationship between continuous variables, which were interpreted by Spearman’s rho and P values. The statistical analysis was conducted with STATA SE-10.0 (StataCorp, College Station, TX).
RESULTS
We performed combined nutrition risk screening in our sample (n 550). 36 (72%) patients were not diagnosed with any risk of developing abnormal nutritional status either via the MUST or via the BIA method. However, MUST reported risk for 9 persons (18%), and BIA for 14 persons (28%). Patient characteristics (mean±SD): 66.3±9.6 years of age; 26.2±6.1 kg/m2 BMI; 46.0±9.7 kg fat-free body mass (FFM); and 16.8±2.4 kg/m2FFMI. Patient characteristics are shown inTables 1and2.
Patients were classified into A, B, C, D severity groups based on the Global Initiative for Chronic Obstructive Lung Disease (GOLD) complex stage classification; as a result, 4% (n52)
Table 1.Characteristics of the patients
N550 Mean value Standard deviation 95% CI
Age (years) 66.30 9.66 [63.56–69.04]
FEV1(ref%) 45.52 16.18 [40.92–50.12]
6MWD (meters) 289.48 110.48 [258.08–320.88]
CAT (points) 22.12 10.24 [19.21–25.03]
SGRQ-C-symptoms 63.52 22.63 [57.08–69.95]
SGRQ-C-activity 62.95 26.92 [55.30–70.60]
SGRQ-C-impact 54.12 26.87 [46.49–61.76]
SGRQ-C-total score 58.41 23.37 [51.77–65.05]
FEV1: forced expiratory volume in 1 s post-bronchodilator; 6MWD: six-minute walk distance; CAT:
COPD Assessment Test; SGRQ-C: Saint-George Respiratory Questionnaire for COPD patients.
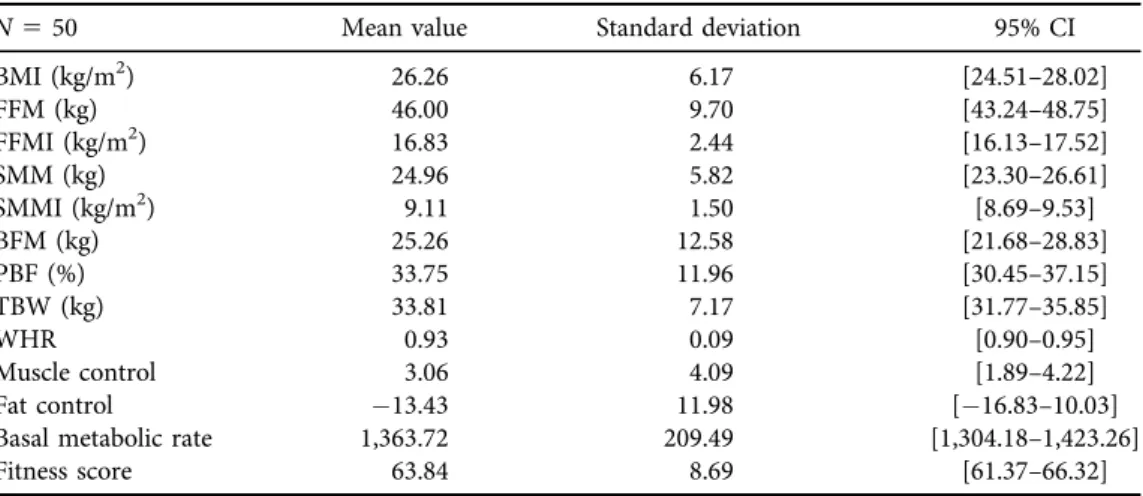
Table 2.Body composition measurements
N550 Mean value Standard deviation 95% CI
BMI (kg/m2) 26.26 6.17 [24.51–28.02]
FFM (kg) 46.00 9.70 [43.24–48.75]
FFMI (kg/m2) 16.83 2.44 [16.13–17.52]
SMM (kg) 24.96 5.82 [23.30–26.61]
SMMI (kg/m2) 9.11 1.50 [8.69–9.53]
BFM (kg) 25.26 12.58 [21.68–28.83]
PBF (%) 33.75 11.96 [30.45–37.15]
TBW (kg) 33.81 7.17 [31.77–35.85]
WHR 0.93 0.09 [0.90–0.95]
Muscle control 3.06 4.09 [1.89–4.22]
Fat control 13.43 11.98 [16.83–10.03]
Basal metabolic rate 1,363.72 209.49 [1,304.18–1,423.26]
Fitness score 63.84 8.69 [61.37–66.32]
BMI: body mass index; FFM: fat free mass; FFMI: fat-free mass index; SMM: skeletal muscle mass; SMMI:
skeletal muscle mass index; BFM: body fat mass; PBF: percent body fat; TBW: total body water; WHR:
waist-hip ratio; SD: Standard deviation.
of them were put into group A, 28% (n514) into group B, 16% (n58) into group C, whereas more than half of them (52%,n5 26) belonged in group D. More than half (n514) of the patients in severity group D were malnourished, and one third of the patients in group B (n53) had this condition (malnutrition defined as FFM index <15 kg/nm2in women and <16 kg/nm2 in men).
The mean of body fat percentage in males was 27.8% (±11.1), and the mean body fat percentage in females was 37.4% (±11.1). 26.3% of men had low body fat, 5.2% of them had normal and 68.5% had high values, whereas 12.9% of female patients had low, 9.7%
normal, and 77.4% high body fat values. The mean muscle percentage was 39.6% (±6.0) in men and 33.3% (±5.4) in women. 58% of males had a low value of muscle percentage, and 42% of them were in the high range. 65% of women had low, 13% normal, and 22% high muscle percentage values. When examining the relationship between muscle percentage and lung function, patients with higher muscle percentage showed better lung function values.
Respiratory distress was more frequent in patients with low FFMI compared to those with normal FFMI (FEV1ref%: 38.9 versus 48.6,P50.023), and the 6MWD also showed significant difference [6MWD (m): 222.7 versus 320.8,P5 0.002], as shown inTable 3. The mean BMI values calculated from body weight and height showed that 14.0% (n 5 7) of patients had normal, 26.0% (n5 13) low and 60.0% (n5 30) high values. Patients with low body weight (BMI<21 kg/m2) had worse activity, effect, symptoms and total SGRQ-C scores, and they also had worse FEV1 values, and shorter 6MWD values than patients in the normal or overweight category, as shown inTable 4.
The mMRC dyspnea scale correlated significantly with various parameters (Table 5): the strongest correlation was found with FFMI (r 5 0.537, P < 0.001), skeletal muscle mass index (SMMI) (r 5 0.530, P < 0.001) and 6MWD (r 5 0.481, P < 0.001). Correlation between FFMI, respiratory symptoms, and exercise capacity was also found, and FFMI was significantly correlated with FEV1(r50.370,P< 0.001) and 6MWD as well (r50.531,P<
0.001), as shown in Table 6. We found a statistically significant relationship between CAT points and FFMI (r50.4906,P50.0003) and CAT points with SMMI (r50.4532,P5 0.0009).
Table 3.The characteristics with low FFMI versus those with normal FFMI
N550 Low FFMI Normal FFMI P-value
FEV1(ref%) 38.89 (±11.63) 48.65 (±16.61) 0.023
Body mass index (kg/m2) 21.07 (±5.11) 28.71 (±5.46) <0.001
Fat-free mass index (kg/m2) 14.18 (±0.76) 18.07 (±1.83) <0.001
Fat mass index (kg/m2) 6.89 (±4.81) 10.65 (±4.58) 0.008
6MWD (meters) 222.75 (±126.01) 320.88 (±89.65) 0.002
CAT (points) 28.50 (±5.42) 19.12 (±10.91) 0.003
FEV1: forced expiratory volume in 1 s post-bronchodilator; 6MWD: six-minute walk distance; CAT:
COPD Assessment Test;P< 0.05 means the two indicators were significantly correlated.
Table 5.Correlation between mMRC dyspnea scale and other parameters
N550 r P-value
FEV1(ref%) 0.330 0.019
BMI (kg/m2) 0.162 0.262
FFMI (kg/m2) 0.537 <0.001
SMMI (kg/m2) 0.530 <0.001
PBF (%) 0.190 0.187
WHR 0.060 0.677
6MWD (meters) 0.481 <0.001
mMRC: Modified Medical Research Council Dyspnoea Scale; FEV1: forced expiratory volume in 1 s post- bronchodilator; BMI: body mass index; FFMI: fat-free mass index; SMMI: skeletal muscle mass index; PBF:
percent body fat; WHR: waist-hip ratio; 6MWD: six-minute walk distance;P< 0.05 means the two indicators were significantly correlated.
Table 4.Characteristics of the patients by BMI categories
N550
Underweight BMI<21 kg/m2
Normal weight BMI 21–25 kg/m2
Overweight BMI>25 kg/m2
Mean age (years) (SD) 65.9±10.8 59.7±11.8 68.0±8.1
Males (n, %) 5 (38.4) 4 (57.1) 10 (33.3)
Women (n, %) 8 (61.5) 3 (42.8) 20 (66.6)
FEV1(ref%) 43.8±16.0 45.1±20.9 46.3±15.2
6MWD (meters) 276.4±123.5 280.2±117.0 297.2±106.3
Mild dyspnea (mMRC score of 0–1)
3 (23.0) 2 (28.5) 14 (46.6)
Moderate dyspnea (mMRC score of 2–3)
9 (69.2) 5 (71.4) 9 (30.0)
Severe dyspnea (mMRC score of 4)
1 (7.6) 0 (0) 7 (23.3)
Quality of Life (mean, SD) 25.8±6.6 25.7±5.2 19.7±11.7
Total score on SGRQ-C 67.6±21.5 63.9±9.7 53.1±25.2
Impact score on SGRQ-C 64.7±26.0 62.4±14.2 47.6±28.0
Activity score on SGRQ-C 70.6±25.7 63.5±10.5 59.4±29.7
Symptom score on SGRQ-C 71.4±15.2 69.9±18.6 58.6±25.2
SGRQ-C: Saint-George Respiratory Questionnaire for COPD patients; mMRC: Modified Medical Research Council Dyspnoea Scale; FEV1: forced expiratory volume in 1 s post-bronchodilator; BMI: body mass index; 6MWD: six-minute walk distance; SD: Standard deviation.
DISCUSSION
The aim of our study was to assess the nutritional status of 50 COPD patients and describe its relationship with quality of life. Based on our results, the nutritional status of COPD patients is a significant prognostic factor for the course of their disease. MUST reported a high risk of malnutrition in 9 persons (18%), whereas 14 persons fell in the same category (28%) based on the results of the BIA. In addition, more than half of the patients (n514) in the‘GOLD D’
severity group were malnourished. Patients with low BMI had lower overall SGRQ-C scores, worse respiratory functions, and shorter 6MWD compared to patients in normal and overweight ranges. Examining the correlation of body muscle percentage and lung function, we found that patients who had higher body muscle percentage showed better lung function values. Addi- tionally, the mMRC Dyspnea Scale was also significantly correlated with various parameters, such as FFMI, SMMI, and 6MWD, whereas significant correlations were found between FFMI and FEV1(r50.370,P< 0.001), and between FFMI and 6MWD (r50.531,P< 0.001) as well.
In the general population, 25–40% of all patients with COPD have low body weight and most of them have a very low FFMI as well [26], which is in line with the results of our study (n514, 28%). FFMI is a major indicator of exercise capacity. In our study, the 6MWD was correlated with FFMI, which may indicate that COPD patients are more prone to develop exercise intolerance because of skeletal muscular cell atrophy [27,28]. Since FFMI describes muscle mass more accurately than other indices [29], it should be considered as an essential tool during pulmonary rehabilitation [30].
We found that impaired FFM is more frequent in female than in male COPD patients.
Engelen et al. also reported higher prevalence of nutritional depletion in women (35%) than men (16%) [31], whereas Schols et al. found 42 and 34%, respectively [32]. Female patients with more intense and severe forms of COPD can show higher nutritional depletion, which can be explained as a gender-specific risk factor in COPD; additionally, they also have a faster onset of air dysfunction than men [33].
Pathophysiology of malnutrition in COPD is not fully cleared yet. However, certain factors, such as the number of exacerbations may play an essential role in the changes of body composition. Exacerbations increase serum levels of local and systemic inflammatory markers (Tumor necrosis factor alpha (TNF-a), IL-1, IL-6, IL-8), which have been proven to result not only in vascular and endothelial injury and dysfunction [34]. TNF-a(cachectin), a key player in
Table 6.Correlation between FFMI and other parameters
N550 r P-value
Age (years) 0.123 0.395
FEV1(ref%) 0.370 <0.001
6MWD (meters) 0.531 <0.001
mMRC 0.537 <0.001
Exacerbations 0.312 <0.001
FFMI: fat-free mass index; FEV1: forced expiratory volume in 1 s post-bronchodilator; 6MWD: six-minute walk distance; mMRC: Modified Medical Research Council Dyspnoea Scale;P< 0.05 means the two indicators were significantly correlated.
systemic inflammation may be a link between comorbidities (muscle loss, type 2 diabetes, osteoporosis, atherosclerosis) in COPD [35], and is also associated with the risk of mortality [36]. It is produced by many cell types (both immune and non-immune cells) and acts through its cell surface receptors (TNFR1 and TNFR2), which can be found in most tissues and cells. It has several functions: it stimulates inflammatory processes, induces apoptosis and activates nuclear factor kappa-light-chain-enhancer of activated B cells (NF-kB), and these result in a decreased expression of myoblast determination protein 1 (MyoD), which plays a role in muscle differentiation [37]. Activated NF-kB is able to inhibit the proteasome subunit (in the ubiquitin- proteasome pathway), which leads to skeletal muscle atrophy. Because of its highly diversified effects on many inflammatory processes in COPD, TNF-a is a useful new biomarker and therapeutic target in the treatment of muscle atrophy.
Nutritional status is an important factor in the development of COPD, and the relationship is bidirectional [38]. Malnutrition and muscle atrophy are independent negative determinants of survival among COPD patients [39]. These patients, and in particular patients with severe condition have been shown to be at risk of malnutrition as the disease progresses, which has the potential that early intervention in patients with low BMI or muscle atrophy may reduce disease progression and improve survival in COPD patients [40]. Increasing body weight improves respiratory muscle efficiency, stronger respiratory muscles may reduce the possibility of acute exacerbations, and also improve ventilation and load capacity [8,41–43].
Reduction of BMI and FFMI are independent risk-factors of COPD mortality. Studies suggest that BMI is only weakly related to the severity of COPD, and thus affects the BODE index (body mass index, airflow obstruction, dyspnea, and exercise index) less prominently. FFMI may be a more convenient variable in the multidimensional evaluation of patients. The FODEP index, which takes into consideration FFMI, FEV1ref%, mMRC scale, 6MWD and maximal inspiratory pressure (MIP) results, may be a more appropriate indicator to predict COPD patient outcomes.
One unit of change in FODEP index 1.55-fold increased mortality of COPD patients [44].
Limitations of our study include the low number of cases and their single-center involve- ment. Investigation of pro-inflammatory cytokines (IL-1b, IL-6, IL-8, IL-10, IL12p70 and TNF- a) has not yet been validated in everyday practice due to significant variability, partly because of the difficulties of the sampling technique, partly because they are present in very low concen- trations. Our future plans include long-term follow-up of patients with measuring and testing of circulating inflammatory parameters, cytokines for COPD outcome.
CONCLUSION
COPD patients are at higher risk of developing pathological nutritional status due to the inflam- matory nature of the disease and inadequate diet. Low body weight and/or low fat-free body weight have a significant impact on the progress of COPD and the length of hospital stay. Due to the high risk of developing malnutrition, screening of COPD patients’nutritional status with the combination of MUST and BIA methods should be implemented in outpatient care settings as well. For screened patients, regular monitoring of nutritional therapy as often as 6–12 months is advised. Nutritional status assessment should focus not only on quantitative variables (body weight and BMI) but also on the parameters of body composition (FFM, FFMI). Nutritional therapy may improve the quality of life of COPD patients significantly, as–in addition to its beneficial respiratory effects–it can also positively influence other comorbidities, such as cardiovascular and metabolic diseases.
Consent for publication:Not applicable.
Funding:The authors have not received any financial support for the research or the publication of this article.
Conflict of interest:None of the authors reported conflict of interest.
ACKNOWLEDGMENTS
We would like to thank Marta Veresne Dr. Balint for lending us the InBody170 body composition analyser and for all her valuable advice, and all the dieticians who took part in the evaluation process at the National Koranyi Institute of Pulmonology, namely Katalin Csicsely, Monika Szabo, Dorottya Horvath, Krisztina Toth and Klaudia Vincze.
LIST OF ABBREVIATIONS
6MWT six-minute walk test
BDNF Brain-derived neurotrophic factor BIA bioelectrical impedance analysis BMI body mass index
BW body weight
CAT COPD Assessment Test
COPD Chronic Obstructive Pulmonary Disease DEXA dual-energy X-ray absorptiometry
GOLD Global Initiative for Chronic Obstructive Lung Disease FEV1 forced expiratory volume in thefirst second
FFM fat-free mass FFMI fat-free mass index
FM fat mass
FMI fat mass index
HRQoL health-related quality of life IL-6 interleukin-6
IL-8 interleukin-8 IL-15 interleukin-15 LBM lean body mass
LIF leukemia inhibitory factor MIP maximal inspiratory pressure
mMRC Modified Medical Research Council Dyspnea Scale MUST Malnutrition Universal Screening Tool
MyoD myoblast determination protein 1
NF-kB nuclear factor kappa-light-chain-enhancer of activated B cells PBF percent body fat
SGRQ-C St. George’s respiratory questionnaire for COPD patients
SMM skeletal muscle mass SMMI skeletal muscle mass index TNF-a tumor necrosis factor alpha TNFR1 Tumor necrosis factor receptor 1
REFERENCES
1. Varga J, Casaburi R, Ma S, Hecht A, Hsia D, Somfay A, et al. Relation of concavity in the expiratoryflow- volume loop to dynamic hyperinflation during exercise in COPD. Respir Physiol Neurobiol 2016; 234: 79–84.
https://doi.org/10.1016/j.resp.2016.08.005.
2. B€osz€ormenyi Nagy Gy, Baliko Z, Kovacs G, Somfay A, Strausz J, Szilasi M, et al. Egeszseg€ugyi szakmai iranyelv a kronikus obstruktıv t€ud}obetegseg (COPD) diagnosztikajaroles kezeleser}ol, az alap-, a szak-es a s€urg}ossegi ellatas ter€uleten [Guideline for the diagnosis and treatment of chronic obstructive pulmonary disease (COPD) in primary care, specialist- and emergency care]. Med Thor 2014; 67: 76–112. Available from:
https://www.copdplatform.com/res/file/national-documents/hun-guidelines.pdf[Accessed 3 Jan, 2021].
3. Varga J. Chronic obstructive pulmonary disease. Haziorv Tovabbk Szle 2018; 23: 26–30.
4. Varga J, editor. A pulmonologiai rehabilitacio kezik€onyve [Handbook of Pulmonary Rehabilitation]. Buda- pest: SpringMed Kiado; 2018. [Hungarian].
5. Gologanu D, Ionita D, Gartonea T, Stanescu C, Bogdan MA. Body composition in patients with chronic obstructive pulmonary disease. Maedica (Buchar) 2014; 9(1): 25–32. PMID: 25553122; PMCID: PMC4268286.
6. Hallin R, Janson C, Arnardottir RH, Olsson R, Emtner M, Branth S, et al. Relation between physical capacity, nutritional status and systemic inflammation in COPD. Clin Respir J 2011; 5(3): 136–42. PMID: 21679348.
7. Creutzberg EC, Schols AM, Bothmer-Quaedvlieg FC, Wouters EF. Prevalence of an elevated resting energy expenditure in patients with chronic obstructive pulmonary disease in relation to body composition and lung function. Eur J Clin Nutr 1998; 52(6): 396–401.https://doi.org/10.1038/sj.ejcn.1600571.
8. Varga JT. Smoking and pulmonary complications: respiratory prehabilitation. J Thorac Dis 2019; 11(Suppl.
5): S639–44.https://doi.org/10.21037/jtd.2018.12.11.
9. Schols AM, Ferreira IM, Franssen FM, Gosker HR, Janssens W, Muscaritoli M, et al. Nutritional assessment and therapy in COPD: a European Respiratory Society statement. Eur Respir J 2014; 44(6): 1504–20.https://
doi.org/10.1183/09031936.00070914.
10. Kyle UG, Bosaeus I, De Lorenzo AD, Deurenberg P, Elia M, Manuel Gomez J, et al. Bioelectrical impedance analysis- part II: utilization in clinical practice. Clin Nutr 2004; 23(6): 1430–53.https://doi.org/10.1016/j.clnu.2004.09.012.
11. Pedersen BK, Febbraio MA. Muscle as an endocrine organ: focus on muscle-derived interleukin-6. Physiol Rev 2008; 88(4): 1379–406.https://doi.org/10.1152/physrev.90100.2007.
12. Pratesi A, Tarantini F, Di Bari M. Skeletal muscle: an endocrine organ. Clin Cases Miner Bone Metab 2013;
10(1): 11–4.https://doi.org/10.11138/ccmbm/2013.10.1.011.
13. Varga J, Szilasi M. Common manifestation of airway diseases: chronic obstructive pulmonary disease and asthma bronchiale. Open Access J Sci 2018; 2(1): 26–31.https://doi.org/10.15406/oajs.2018.02.00040.
14. Remels AH, Gosker HR, Langen RC, Schols AM. The mechanisms of cachexia underlying muscle dysfunction in COPD. J Appl Physiol (1985) 2013; 114(9): 1253–62.https://doi.org/10.1152/japplphysiol.00790.2012.
15. de Blasio F, de Blasio F, Miracco Berlingieri G, Bianco A, La Greca M, Franssen FM, et al. Evaluation of body composition in COPD patients using multifrequency bioelectrical impedance analysis. Int J Chron Obstruct Pulmon Dis 2016; 11: 2419–26.https://doi.org/10.2147/COPD.S110364.
16. Kondrup J, Allison SP, Elia M, Vellas B, Plauth M. Educational and Clinical Practice Committee, European Society of Parenteral and Enteral Nutrition (ESPEN). ESPEN guidelines for nutrition screening 2002. Clin Nutr 2003; 22(4): 415–21.https://doi.org/10.1016/s0261-5614(03)00098-0.
17. Nici L, Donner C, Wouters E, Zuwallack R, Ambrosino N, Bourbeau J, et al. American thoracic society/
European respiratory society statement on pulmonary rehabilitation. Am J Respir Crit Care Med 2006;
173(12): 1390–413.https://doi.org/10.1164/rccm.200508-1211ST.
18. Vogelmeier CF, Criner GJ, Martinez FJ, Anzueto A, Barnes PJ, Bourbeau J, et al. Global strategy for the diagnosis, management and prevention of chronic obstructive lung disease 2017 report: GOLD executive summary. Respirology 2017; 22(3): 575–601.https://doi.org/10.1164/rccm.201701-0218PP.
19. ATS Committee on Proficiency Standards for Clinical Pulmonary Function Laboratories. ATS statement:
guidelines for the six-minute walk test [published correction appears in Am J Respir Crit Care Med. 2016 May 15;
193(10):1185]. Am J Respir Crit Care Med 2002; 166(1): 111–17.https://doi.org/10.1164/ajrccm.166.1.at1102.
20. Jones, PW. St George’s respiratory questionnaire for COPD patients (SGRQ-C). Structure 2008; 44: 1–7.
Available from: http://www.healthstatus.sgul.ac.uk/SGRQ_download/SGRQ-C%20Manual%202008.pdf [Accessed 3 Jan, 2021].
21. Jones PW, Quirk FH, Baveystock CM, Littlejohns P. A self-complete measure of health status for chronic airflow limitation. The St. George’s respiratory questionnaire. Am Rev Respir Dis 1992; 145(6): 1321–7.
https://doi.org/10.1164/ajrccm/145.6.1321.
22. Eltayara L, Becklake MR, Volta CA, Milic-Emili J. Relationship between chronic dyspnea and expiratoryflow limitation in patients with chronic obstructive pulmonary disease. Am J Respir Crit Care Med 1996;
154(6Pt1): 1726–34.https://doi.org/10.1164/ajrccm.154.6.8970362.
23. Bestall JC, Paul EA, Garrod R, Garnham R, Jones PW, Wedzicha JA. Usefulness of the Medical Research Council (MRC) dyspnoea scale as a measure of disability in patients with chronic obstructive pulmonary disease. Thorax 1999; 54(7): 581–6.https://doi.org/10.1136/thx.54.7.581.
24. Yawn BB, Thomashaw B, Mannino DM, Han MK, Kalhan R, Rennard S, et al. The 2017 update to the COPD foundation COPD pocket consultant guide. Chronic Obstr Pulm Dis 2017; 4(3): 177–85.https://doi.org/10.
15326/jcopdf.4.3.2017.0136.
25. Fekete M, Pongor V, FeherA, Veresn e BM, Varga JT, Horvath I. Kronikus legz}oszervi betegek taplaltsagi
allapotanak vizsgalata–klinikai megfigyelesek [Relationship of chronic obstructive pulmonary disease and nutritional status–clinical observations]. Orv Hetil 2019; 160(23): 908–13.https://doi.org/10.1556/650.2019.
31386.
26. Budweiser S, Meyer K, J€orres RA, Heinemann F, Wild PJ, Pfeifer M. Nutritional depletion and its relationship to respiratory impairment in patients with chronic respiratory failure due to COPD or restrictive thoracic diseases. Eur J Clin Nutr 2008; 62: 436–43.https://doi.org/10.1038/sj.ejcn.1602708.
27. Rutten EP, Spruit MA, Wouters EF. Critical view on diagnosing muscle wasting by single-frequency bio- electrical impedance in COPD. Respir Med 2010; 104(1): 91–8.https://doi.org/10.1016/j.rmed.2009.07.004.
28. Heged}us B, Varga J, Somfay A. Az interdiszciplinaris rehabilitacio hatasa spondylitis ankylopoeticaban szenved}o betegekben [Interdisciplinary rehabilitation in patients with ankylosing spondylitis]. Orv Hetil 2016;
157(28): 1126–32.https://doi.org/10.1556/650.2016.30472.
29. Franssen FM, Broekhuizen R, Janssen PP, Wouters EF, Schols AM. Effects of whole-body exercise training on body composition and functional capacity in normal-weight patients with COPD. Chest 2004; 125: 2021–8.
https://doi.org/10.1378/chest.125.6.2021.
30. Engelen MP, Schols AM, Baken WC, Wesseling GJ, Wouters EF. Nutritional depletion in relation to respi- ratory and peripheral skeletal muscle function in out-patients with COPD. Eur Respir J 1994; 7(10): 1793–7.
https://doi.org/10.1183/09031936.94.07101793.
31. Schols AM, Soeters PB, Dingemans AM, Mostert R, Frantzen PJ, Wouters EF. Prevalence and characteristics of nutritional depletion in patients with stable COPD eligible for pulmonary rehabilitation. Am Rev Respir Dis 1993; 147(5): 1151–6.https://doi.org/10.1164/ajrccm/147.5.1151.
32. Lamprecht B, McBurnie MA, Vollmer WM, Gudmundsson G, Welte T, Nizankowska-Mogilnicka E, et al.
COPD in never smokers: results from the population-based burden of obstructive lung disease study. Chest 2011; 139(4): 752–63.https://doi.org/10.1378/chest.10-1253.
33. Marton J, Farkas G, Nagy Z, Takacs T, Varga J, Szasz Z, et al. Plasma levels of TNF and IL-6 following induction of acute pancreatitis and pentoxifylline treatment in rats. Acta Chir Hung 1997; 36(1–4): 223–5.
PMID: 9408354.
34. Barreiro E, Gea J. Amino acid and protein metabolism in pulmonary diseases and nutritional abnormalities: a special focus on chronic obstructive pulmonary disease. Chapter 12. In: Dardevet D, editor. The molecular nutrition of amino acids and proteins. Elsevier; 2016: 145–59.https://doi.org/10.1016/B978-0-12-802167-5.
00012-8.
35. Sevenoaks MJ, Stockley RA. Chronic Obstructive Pulmonary Disease, inflammation and co-morbidity– a common inflammatory phenotype? Respir Res 2006; 7(1): 70.https://doi.org/10.1186/1465-9921-7-70.
36. Yao Y, Zhou J, Diao X, Wang S. Association between tumor necrosis factor-a and chronic obstructive pulmonary disease: a systematic review and meta-analysis. Ther Adv Respir Dis 2019; 13: 1753466619866096.
https://doi.org/10.1177/1753466619866096.
37. Webster JM, Kempen LJAP, Hardy RS, Langen RCJ. Inflammation and skeletal muscle wasting during cachexia. Front Physiol 2020; 11: 597675.https://doi.org/10.3389/fphys.2020.597675.
38. Fekete M, Pako J, Sz}oll}osi G, Toth K, Szabo M, Horvath D, et al. A taplaltsagiallapot felmeresees jelent}osege kronikus obstruktıv t€ud}obetegsegben [Significance of nutritional status in chronic obstructive pulmonary disease: a survey]. Orv Hetil 2020; 161(40): 1711–19.https://doi.org/10.1556/650.2020.31824.
39. Ezzell L, Jensen GL. Malnutrition in chronic obstructive pulmonary disease. Am J Clin Nutr 2000; 72: 1415–6.
https://doi.org/10.1093/ajcn/72.6.1415.
40. Hancu A. Nutritional status as a risk factor in COPD. Maedica (Bucur) 2019; 14(2): 140–3.https://doi.org/10.
26574/maedica.2019.14.2.140.
41. Ma S, Hecht A, Varga J, Rambod M, Morford S, Goto S, et al. Breath-by-breath quantification of progressive airflow limitation during exercise in COPD: a new method. Respir Med 2010; 104(3): 389–96.https://doi.org/
10.1016/j.rmed.2009.10.014.
42. Vagv€olgyi A, Rozgonyi Z, Vadasz P, Varga JT. Risk stratification before thoracic surgery, perioperative pulmonary rehabilitation [A mellkassebeszeti m}uteti teherbıro kepesseg megıtelese, perioperatıv legzesrehabilitacio]. Orv Hetil 2017; 158(50): 1989–97.https://doi.org/10.1556/650.2017.30862.
43. Vagvolgyi A, Rozgonyi Z, Kerti M, Vadasz P, Varga J. Effectiveness of perioperative pulmonary rehabilitation in thoracic surgery. J Thorac Dis 2017; 9(6): 1584–91.https://doi.org/10.21037/jtd.2017.05.49.
44. Xu L, Ye T, Li J, Hu Y, Xu W, Wang K, et al. Identification of relevant variables and construction of a multidimensional index for predicting mortality in COPD patients. Int J Chron Obstruct Pulmon Dis 2019;
14: 1703–11.https://doi.org/10.2147/COPD.S215219.
Open Access. This is an open-access article distributed under the terms of the Creative Commons Attribution 4.0 International License (https://creativecommons.org/licenses/by/4.0/), which permits unrestricted use, distribution, and reproduction in any medium, provided the original author and source are credited, a link to the CC License is provided, and changes–if any–are indicated. (SID_1)