Dániel Felcser, Balázs Vonnák
Carry Trade, Uncovered
Interest Parity and Monetary Policy
MNB Working Papers 3 2014
...
MAGYAR NEMZETI BANK
Dániel Felcser, Balázs Vonnák
Carry Trade, Uncovered
Interest Parity and Monetary Policy
MNB Working Papers 3 2014
. ...
MAGYAR NEMZETI BANK
The MNB Working Paper series includes studies that are aimed to be of interest to the academic community, as well as researchers in central banks and elsewhere. Star ng from 9/2005, ar cles undergo a refereeing process, and their publica on is supervised by an editorial board.
The purpose of publishing the Working Paper series is to s mulate comments and sugges ons to the work prepared within the Magyar Nemze Bank. Cita ons should refer to a Magyar Nemze Bank Working Paper.
The views expressed are those of the authors and do not necessarily reflect the official view of the Bank.
MNB Working Papers 2014/3
Carry Trade, Uncovered Interest Parity and Monetary Policy*
(Carry trade, fedezetlen kamatparitás és monetáris poli ka)
Wri en by Dániel Felcser**, Balázs Vonnák***
Published by the Magyar Nemze Bank Publisher in charge: Eszter Hergár Szabadság tér 8-9., H-1850 Budapest www.mnb.hu
ISSN 1585-5600 (online)
*The authors would like to thank Fabio Fornari, Zoltán Reppa, Zoltán Schepp and par cipants at the MNB seminar and at the 3rd Workshop on “Financial Determinants of Exchange Rates” held in Rome, 16-17 December 2013 for useful comments and sugges ons. Any remaining errors and omissions are ours.
**Directorate Monetary Policy and Financial Market Analysis, Magyar Nemze Bank (the central bank of Hungary), e-mail:
felcserd@mnb.hu
***Directorate Financial System Analysis, Magyar Nemze Bank (the central bank of Hungary), corresponding author, e-mail:
vonnakb@mnb.hu
Contents
Abstract
51. Introduc on
62. Modelling strategy
83. Data
104. Results
124.1. The effect of monetary policy and risk premium shocks 12
4.2. Comparison with the Cholesky decomposi on 13
4.3. Iden fica on of foreign shocks 16
4.4. Variance decomposi on 16
5. Robustness analysis
185.1. Pure sign restric on approach 18
5.2. Monthly frequency 18
6. Conclusions
22References
23Appendix
25Abstract
It is well documented in the literature that iden fied vector autoregression (VAR) models o en produce puzzling results when the effect of unexpected monetary policy movements is es mated. Many authors find that raising interest rate generates protracted apprecia on of the exchange rate (the so-called delayed overshoo ng puzzle) which is in contradic on with tradi onal theory of exchange rate dynamics based on uncovered interest parity. Since the dynamics of exchange rate is determined to a substan al extent by carry traders, we inves gate the behaviour of the exchange rate and carry trade ac vity within the same VAR for a panel of small open economies. We iden fy structural shocks by allowing the interest rate and exchange rate to react simultaneously to monetary policy and changes in expected risk premium. Our results show that the delayed overshoo ng is not a robust finding. Exchange rate apprecia on and carry trade movements take place almost on impact a er an unexpected interest rate hike. Roughly half of the varia on in carry trade posi ons can be explained by domes c interest rate changes and risk premium shocks.
JEL:E52, F31.
Keywords:delayed overshoo ng, vector autoregressions, carry trade, monetary policy.
Összefoglaló
Az irodalomban jól ismert, hogy az iden fikált vektor autoregressziós (VAR) modellek gyakran az elméle el ellentétes eredményekre vezetnek a váratlan monetáris poli kai lépések hatásaira vonatkozóan. Számos szerző arra juto , hogy a kamatemelés az árfolyam elnyújto erősödését („késleltete túllövés”) eredményezi, ami ellentmond a fedezetlen kamatparitáson alapuló hagyományos elméletnek. Tekinte el arra, hogy az árfolyam alakulását jelentős részben az ún. carry trader-ek határozzák meg, az árfolyam viselkedését és a carry trade ak vitást ugyanazon a kis nyito országok paneljén becsült VAR modellen belül vizsgáljuk. Strukturális sokkokat iden fikálunk, megengedve, hogy a kamat és az árfolyam szimultán módon reagáljon a monetáris poli kai és kockáza prémium sokkokra. Eredményeink szerint a késleltete túllövés nem robusztus eredmény. Az árfolyam erősödése és a carry pozíciók felvétele szinte azonnal lezajlik egy váratlan kamatemelés után. A hazai kamatlépések és kockáza prémium sokkok a carry trade ak vitás nagyjából felét megmagyarázzák.
1 Introduc on
There is an unpleasant disconnect between the best prac ce of monetary policy and empirical tests of exchange rate theories.
While central banks’ forecasts and decision-making rely on models assuming some sort of uncovered interest parity (UIP), there seems to be a wide consensus among econometricians that UIP can be rejected with high certainty. Nevertheless, the dynamic rela onship between exchange rate and interest rate is of special interest for central banks in small open economies where the exchange rate channel of monetary transmission mechanism is important.
In our paper we focus only on one of the empirical puzzles, the so-called delayed overshoo ng (DOS). According to Dornbusch (1976)’s model in which UIP holds, a er an (unexpected) monetary ghtening the nominal exchange rate appreciates instantaneously and then gradually depreciates to its new level consistent with purchasing power parity. However, structural VAR es mates, like Eichenbaum and Evans (1995) or more recently Scholl and Uhlig (2008), o en show a protracted apprecia on las ng even for years.
There are, however, some authors who challenge the iden fica on strategy of the studies repor ng DOS. Already McCallum (1994) emphasized that the empirical failure of UIP may be caused by shocks to the exchange rate to which the monetary policy reacts within one period. Since in small open economies exchange rate movements can have a large impact on infla on and output, a quick response of central banks to those shocks can be jus fied. Cushman and Zha (1997), Kim and Roubini (2000), Faust and Rogers (2003), Bjørnland (2009), Jarocinski (2010) and Vonnák (2010) relax the assump on that monetary policy reacts to exchange rate shocks only with delay, which is o en implicitly made by Cholesky decomposi on of the variance-covariance matrix. Allowing simultaneity between monetary policy and the exchange rate yields impulse responses resembling to Dornbusch’s overshoo ng model. It should be noted, however, that Scholl and Uhlig (2008) find DOS without assuming recursive structure among the shocks and the variables.
Another issue which recently has received much a en on and is presumably related to delayed overshoo ng is carry trade ac vity. Carry traders borrow in low-interest-rate currency and lend in high-interest-rate currency. As long as UIP holds, the profit of this strategy is zero on average, since the interest rate premium is perfectly offset by the exchange rate deprecia on.
If we augment the UIP by a ( me-varying) risk premium term, the return of a carry trade posi on correlates with this risk premium which can be regarded as the compensa on for taking the exchange rate risk. S ll, as long as exogenous changes in the policy rate do not affect the risk premium, UIP holds condi onally,¹ and a er the infinitesimally short period during which the exchange rate jumps according to Dornbusch’s model, there is no incen ve for carry traders to change their exposure. Thus, a er a monetary shock we would expect only a very temporary change in specula ve posi ons.
On the contrary, the delayed reac on of exchange rate to monetary policy provides excess return for several periods. A er an interest rate hike a carry trader could make profit from higher return on domes c assets as well as from the apprecia on of the currency. Since the exchange rate appreciates gradually, DOS would imply protracted carry trade inflow. In the seminal paper of Brunnermeier et al. (2009) slowly moving carry traders and DOS are shown to be the two sides of the same coin. The authors es mate a VAR and show that the reac on of both the exchange rate and carry traders to an interest rate shock is protracted.
In the model of Plan n and Shin (2011) carry traders endogenously amplify the effect of monetary policy on the exchange rate. They assume that carry traders while going long in local currency, increase the credit supply and therefore generate an overhea ng in domes c demand. In response to this, the central bank increases further the interest rate which a racts more capital from abroad.² The result is a monetary policy generated bubble that ends up in a currency crash. In this model the role
¹ By “UIP holding condi onally” we mean that a er a shock the realized return on a carry posi on does not change which implies that the effect of the shock on the interest rate differen al is equal to its effect on the (expected) change in exchange rate.
² This mechanism is also known as Tosovsky-dilemma, named a er a former governor of the Czech central bank and appears o en in central bank publica ons and financial market experts’ analyses.
INTRODUCTION
of carry traders is destabilizing, as opposed to the conven onal UIP framework where it is the carry trader who helps the parity condi on to be fulfilled quickly.
In our paper we deploy a robust econometric methodology to inves gate the rela onship between monetary policy, exchange rate and carry trade. Similarly to Brunnermeier et al. (2009) we es mate the effect of the interest rate change on carry trade ac vity and the exchange rate within the same model. By doing this, we have the chance to uncover not only how monetary policy affects the exchange rate and carry trade, but also how carry trade transmits monetary policy shocks. We es mate our structural VAR on a panel of three small open economies (Australia, Canada, U.K.) having currencies considered to have been target for carry trade. However, unlike the above-men oned paper, we dis nguish between endogenous and exogenous interest rate movements by iden fying monetary policy and other structural shocks. Following the previously men oned studies that challenged the existence of DOS, we allow the monetary policy to react simultaneously to exchange rate or risk premium shocks by imposing sign instead of zero restric ons.
Our second contribu on to the literature is that we try to find the main driving forces behind carry trade. To this end, we iden fy four domes c and four foreign shocks. The variance decomposi on of carry trade data may inform us about whether the exchange rate is a shock absorber or a source of idiosyncra c shocks, and whether traders on the FX-market help the exchange rate react quickly to changes in fundamentals or generate undesired vola lity.
Our approach is similar to that of Anzuini and Fornari (2012). Although they focus more on determinants of carry trade and less on DOS, their approach is common with ours in recognizing the importance of the iden fica on of economically meaningful shocks. However, there are essen al differences in the model specifica on. Probably the most important is that while they es mate a VAR on rela ve variables (domes c minus foreign), we use the original me series. This may have crucial consequences, since domes c variables are more likely to track the foreign ones than vice versa. Imposing iden fying restric ons on the rela ve variables may cause substan al bias when there is high asymmetry in how foreign and domes c variables react to each other. The most obvious example is monetary policy, as we expect the central bank of a small open country to follow some extent the monetary stance in the big economy, but not the other way around. Therefore, we expect a be er iden fica on of the relevant structural shocks in our model. Furthermore, Anzuini and Fornari (2012)’s confidence shock resembles our risk premium shock to some extent, but they iden fy it by using measures of confidence and market risk (VIX), while we impose restric ons on the same macroeconomic variables as for the other shocks.
Our results show that delayed overshoo ng is not a robust finding. Our exchange rate impulse response func ons resemble rather Dornbusch (1976)’s overshoo ng model, consistently with UIP. Comparison with the Cholesky iden fica on scheme confirms previous findings that improper iden fying restric ons embedded implicitly in the recursive approach can be responsible to some extent for the puzzle found in some of the referred studies.
Another important finding is that carry traders react to monetary policy according to the UIP: the exogenous shi in monetary policy stance induces a contemporaneous change in specula ve currency posi ons which start rever ng already in the next period. These results suggest that the exchange rate channel of monetary transmission mechanism works as in the Dornbusch model and carry traders play an important role in it. Our findings are in line with those of Kisgergely (2012), who could reject the hypothesis that interest sensi ve capital flows can reverse the effect of monetary policy.
Variance decomposi on shows that roughly half of the carry trade movements can be a ributed to surprise movements in domes c monetary policy stance and changes in risk premium of the domes c currency. While the interpreta on of the former is straigh orward, the la er is not. On one hand, the dynamics of the exchange rate and carry trade a er a monetary policy shock suggest that specula ve posi on-taking help the UIP to restore quickly. On the other hand, the risk premium of a currency can change for two reasons: either because the fundamentals have changed and carry traders adjust their demand for compensa on for taking risk, or because there is an idiosyncra c shock to carry trade ac vity. In the first case the role of currency specula on can be considered as greasing, as the new informa on about the current or future state of the economy is channelled into the exchange rate by carry traders. In the second case, however, currency specula on is a source of shocks that can lead to welfare losses. Unfortunately within our modelling framework it is not possible to decompose risk premium shocks to changes in the risk profile of the economy and changes in risk appe te, therefore we cannot draw firm conclusions to what extent carry trade ac vity is welfare-improving.
The remainder of the paper is structured as follows. Sec on 2 presents our econometric model and the restric ons used in the iden fica on of the shocks. Sec on 3 describes our dataset. Sec on 4 presents the results. Sec on 5 shows results from alterna ve specifica ons as a robustness check. Finally, Sec on 6 concludes.
2 Modelling strategy
During the empirical analysis we build on the methodology presented in Uhlig (2005). By using a structural vector autoregression (SVAR) model we can iden fy structural, economically meaningful exogenous shocks and causal rela onships between them and the endogenous variables.
In par cular, a VAR is es mated in the form that is given by
yt A1yt 1 A2yt 2 ... Apyt p Czt t (1)
E( t t) ≡ (2)
wheret 1...T,ytis the vector of endogenous variables included in the VAR: the log of real gross domes c product, log of consumer prices, log of 3-month money market interest rate, log of the nominal exchange rate and a proxy for carry trade posi ons.Ais the coefficient matrix and is the variance-covariance matrix for the one-step ahead predic on error.ztis the vector of exogenous variables.
Intrinsically, we are interested in the parameters of the structural VAR
B0yt B1yt 1 B2yt 2 ... Bpyt p Dzt ut (3)
E(utut) ≡ u In (4)
whereutis the vector of mutually uncorrelated structural shocks,Inis an n-dimensional iden ty matrix and
t B01ut (5)
Equa on (2) imposesn(n 1)/2 restric ons onB0. To fully disentangle the structural shocks from the reduced-form innova ons, we needn(n 1)/2 addi onal restric ons. One can find several approaches in the literature to carry that out. One is assuming a recursive structure among shocks and their contemporaneous effect on the endogenous variables, the so-called Cholesky ordering. Kim and Roubini (2000)’s iden fica on scheme builds on non-recursive zero restric ons. Scholl and Uhlig (2008) use sign restric ons on impulse responses for a prolonged period (one year) a er the shock. Bjørnland (2009) employs long-run neutrality restric ons. Bjørnland and Halvorsen (2010) combine sign and short-run restric ons.
Since in a small open economy both monetary policy shocks and sudden swings in carry trade (exchange rate or risk premium shocks) may affect the interest rate and the exchange rate simultaneously, recursive ordering is not appropriate for our purposes. Therefore, we iden fy the structural shocks using mainly sign restric ons. Zero restric ons are used only for separate financial shocks from those origina ng in real economy. Sign restric ons have the advantage of robustness at the price of wider confidence bands of impulse responses than in just-iden fied VARs.
The endogenous part of our VAR consists of GDP, CPI, short-term interest rate, exchange rate and carry trade. Following the slightly modified nota on of Kilian (2011),B01can be wri en as
MODELLING STRATEGY
⎛
⎜
⎜⎜
⎜⎜
⎜
⎝
Prodt
Prices t Interest t Exchange t Carry t
⎞
⎟
⎟⎟
⎟⎟
⎟
⎠
⎡
⎢
⎢
⎢
⎢
⎢
⎢
⎢
⎢
⎣
0 0 ⋅
⋅ ⋅ ⋅
⋅ ⋅
⋅ ⋅ ⋅
⋅ ⋅ ⋅
⎤
⎥
⎥
⎥
⎥
⎥
⎥
⎥
⎥
⎦
⎛
⎜
⎜⎜
⎜⎜
⎜
⎝ uMonetaryt uRiskt uDemandt uSupplyt u5t
⎞
⎟
⎟⎟
⎟⎟
⎟
⎠
(6)
where and denotes the sign of the restricted impact response, 0 indicates zero restric on and⋅denotes no restric on.
According to the restric ons, an unan cipated monetary ghtening causes the domes c interest rate to increase and the exchange rate to appreciate on impact. Carry traders take long posi on in local currency due to higher interest rate.³ An unexpected increase in the risk premium leads to higher interest rate and weakening of the currency, accompanied by a fall in carry trade. We do not impose any restric ons on prices, while, in both cases, the contemporaneous effect of the shock on produc on is zero, that is GDP responds to these shocks with delay. The la er assump on may receive some cri cism as in small open economy produc on can be sensi ve to exchange rate movements within the same quarter. In order to check to what extent our conclusions depend on these restric ons, we es mate a model on monthly data as well as with a pure sign restric on approach. The results reported in Sec on 5 confirm the main results of the benchmark model.
We use the standard sign restric ons to iden fy domes c demand and supply shocks. An unan cipated posi ve supply shock causes produc on to increase and prices to fall, while a demand shock causes both produc on and prices to increase on impact.
Demand shocks are associated with an increase in the interest rate as monetary policy tries to counteract infla on. Finally, we leave the fi h domes c shock uniden fied.
Besides domes c factors, foreign shocks may be important drivers of carry trade ac vity. Thus, we iden fy foreign shocks as well. The corresponding restric ons are similar to the domes c ones, and are described in details in Sec on 4.3.
³ At first glance it may seem contradic ng to iden fy the effect of monetary policy shocks on exchange rate and carry trade by imposing restric ons on exchange rate and carry trade themselves. Indeed, imposing sign restric on on the impact response and being completely indifferent in the second period response may cause a bias against hump-shaped response func ons. S ll, we think that this bias is not that big as to influence significantly our results. Firstly, among our impulse responses there are several examples when a contemporaneous sign restric on is imposed, but the result is hump-shaped. Secondly, we es mated the same model by imposing the sign restric ons for 4 quarters and we got the same qualita ve results. We also es mated it without imposing any restric ons on carry trade. Again, the results are very similar.
3 Data
Due to the rela vely short me series we prefer the panel approach to the country-by-country es ma ons, similarly to Brunnermeier et al. (2009). Our panel consists of three developed countries (Australia, Canada and the United Kingdom) that can be considered as targets of carry trade ac vity on our sample.⁴ Our choice of this par cular group of countries was determined primarily by the availability of carry trade sta s cs.
We have quarterly data for the macroeconomic variables from 1992Q2 to 2007Q4 taken from the Interna onal Financial Sta s cs (IFS) database.⁵ In this way we leave out the recent financial crisis from the sample, as we are interested in monetary transmission and exchange rate dynamics in “normal mes”.⁶ The star ng period was chosen based on carry trade data availability.
Another op on would be to include all the countries having long enough carry trade data, like Japan and the United States. The reason for inves ga ng only these three countries is that pooling them together with big, closed economies would ques on our setup as we assume that the main dynamic proper es of the vector of variables are approximately the same across countries.
All GDP and CPI data are seasonally adjusted in the IFS database. However, United Kingdom CPI data seemed to have some remained seasonality, therefore we corrected for that.⁷ The end-of-period nominal exchange rates vis-à-vis the U.S. dollar are defined as the local currency price of one unit of foreign currency, thus an increase in the exchange rate means deprecia on.
The interest rate data is the quarterly average of short-term money market rate.
To control for foreign shocks, we use U.S. GDP, CPI, interest rate and exchange rate data as exogenous in the VAR. U.S. dollar exchange rate vis-à-vis the euro is taken from Eurostat. An increase in the exchange rate means deprecia on of the dollar.
Following Brunnermeier et al. (2009), we use the futures posi on data from the Commodity Futures Trading Commission (CFTC) as a proxy for carry trade ac vity. It is a widely used measure of specula ve posi ons. We use the latest available data for each quarter to construct the net futures posi on of non-commercial traders in Australian Dollar (AUD), Canadian Dollar (CAD) and Bri sh Pound Sterling (GBP), expressed as a frac on of total open interest.⁸ According to Brunnermeier et al. (2009), despite its shortcomings, it is the best publicly available data for carry trade ac vity.⁹
⁴ See the results of Brunnermeier et al. (2009).
⁵ See Table 1 in Appendix for details.
⁶ The sample ends before the recent global financial crisis, due to the possibility of nonlinear effects caused by the severe shocks that may pose a bias to the es ma on of the (linear) VAR model. For a robustness check, we extended the es ma on of the baseline model to the 1992Q2 - 2012Q2 period and found that the main results qualita vely s ll hold.
⁷ In 2000Q3 the Australian Government introduced a Goods and Services Tax, which results in a level shi in Australian CPI data. Controlling for this with a dummy variable does not alter our results, therefore we use the original data.
⁸ Classified by the CFTC, non-commercial traders use futures for specula ve purposes and not for hedging against currency risk.
⁹ One of the main deficiencies is that it does not cover all specula ve exchange rate posi ons as, for instance, hedge funds reportedly trade more in forward markets than in futures markets. Other proxies for carry trade ac vity also exist, but none of them seem to be more suitable enough to jus fy a devia on from the approach of Brunnermeier et al. (2009). Returns of Exchange Traded Funds (ETFs) and Exchange Traded Notes (ETNs) are linked to carry-trade strategies making them appealing candidates. But they have the same weakness as CFTC data as ETFs and ETNs are mostly used by retail investors and are unlikely to represent a large part of overall carry trade ac vity; and their me series start only in mid-2000s resul ng in rela vely short sample periods. Another poten al proxy is the BIS interna onal banking sta s cs that measure the amount of cross-border lending, including a currency breakdown of banks’ interna onal assets and liabili es. Unfortunately, banks report only their on-balance sheet posi ons, without explicitly dis nguishing between carry trade posi ons and other ac vi es, same problem as in case of CFTC futures posi ons data. For more details, see Curcuru et al. (2011).
DATA
Of course, the sum of specula ve posi ons reported to CFTC is only a frac on of total open interest. Hence, behaviour of CFTC carry trade does not necessarily apply to all interest sensi ve posi on-taking. S ll, if we find that CFTC carry traders eliminate excess return quickly, we can safely assume that there are no incen ves to take posi ons by other market par cipants.
A Bayesian VAR with 4 lags is es mated on quarterly frequency using the previously introduced panel data set.¹⁰ Contemporaneous and one period lagged U.S. data appear as exogenous variables. We use country-specific intercepts.
Following Uhlig (2005), we use flat prior. The coefficients are drawn from the posterior distribu on, which is a normal-inverse-Wishart distribu on parameterized by the OLS es mates of coefficient and variance-covariance matrices.
Calcula on of posterior distribu ons is made following Reppa (2009). 2000 draws sa sfying the sign restric ons have been generated.
In order to measure the failure of UIP, we calculate excess return impulse responses. We define (expected) excess return as the sum of the interest rate and the (expected) apprecia on expressed in annual terms¹¹:
zt it 4(et 1 et) (7)
where (it) is the (log) nominal interest rate and (et) is the (log) nominal exchange rate in periodt. If UIP holds condi onally a er a shock, a posi ve interest rate differen al is offset by the deprecia on of the domes c currency resul ng in no excess return.
In other words, the condi onal expecta onEtzt pmust be zero for allp 0 as long as UIP holds. The effect of the structural shocks on excess return can be calculated from the impulse responses of the domes c and U.S. interest rates, and the exchange rate.
¹⁰ Standard selec on criteria suggest 1-2 lags for the VAR; however, we include 4 lags to be able to reject serial correla on in the residuals.
¹¹ Since U.S. interest rate is assumed to be exogenous and not affected by domes c shocks, we can ignore it in the calcula on of excess return.
4 Results
In this sec on we discuss the empirical results obtained from our preferred iden fica on scheme, and then briefly compare our results with the Cholesky decomposi on. It is followed by an analysis of the effect of foreign shocks. Finally, we present variance decomposi on with focus on the determinants of carry trade ac vity.
4.1 THE EFFECT OF MONETARY POLICY AND RISK PREMIUM SHOCKS
We are interested first of all in the effect of monetary policy shocks. As men oned earlier, separa on of them from risk premium shocks can be crucial. Therefore we focus here on these shocks. Responses to all the iden fied domes c shocks can be found in the Appendix (Figure 13).
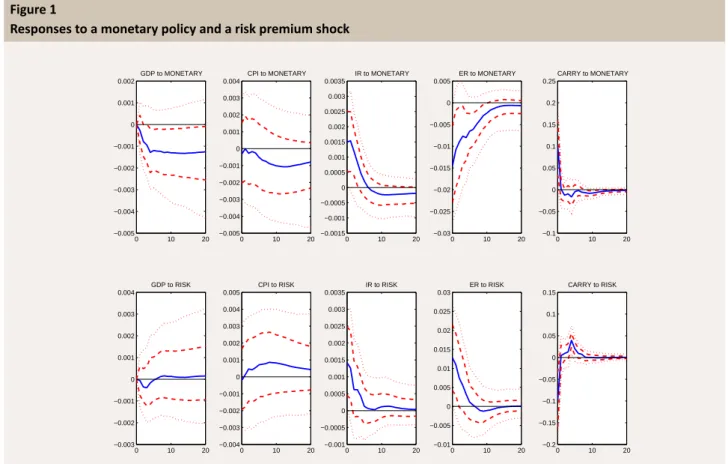
Figure 1 shows the es mated impulse responses to a domes c contrac onary monetary policy shock and an unfavourable risk premium shock, respec vely, up to 5 years a er the shock. We report the median, the 2.5th, 16th, 84th and 97.5th percen les of the posterior distribu on.
Figure 1
Responses to a monetary policy and a risk premium shock
0 10 20
−0.005
−0.004
−0.003
−0.002
−0.001 0 0.001 0.002
GDP to MONETARY
0 10 20
−0.005
−0.004
−0.003
−0.002
−0.001 0 0.001 0.002 0.003 0.004
CPI to MONETARY
0 10 20
−0.0015 −0.001
−0.0005 0 0.0005 0.001 0.0015 0.002 0.0025 0.003 0.0035
IR to MONETARY
0 10 20
−0.03
−0.025 −0.02
−0.015 −0.01
−0.005 0 0.005
ER to MONETARY
0 10 20
−0.1 −0.05 0 0.05 0.1 0.15 0.2 0.25
CARRY to MONETARY
0 10 20
−0.003
−0.002
−0.001 0 0.001 0.002 0.003 0.004
GDP to RISK
0 10 20
−0.004
−0.003
−0.002
−0.001 0 0.001 0.002 0.003 0.004 0.005
CPI to RISK
0 10 20
−0.001
−0.0005 0 0.0005 0.001 0.0015 0.002 0.0025 0.003 0.0035
IR to RISK
0 10 20
−0.01
−0.005 0 0.005 0.01 0.015 0.02 0.025 0.03
ER to RISK
0 10 20
−0.2
−0.15 −0.1
−0.05 0 0.05 0.1 0.15
CARRY to RISK
Note: The solid line is the pointwise median of all successful draws. Dashed and do ed lines encompass the middle 68 and 95 per cent of the posterior distribu on, respec vely. IR and ER stands for exchange rate and interest rate, respec vely. CARRY denotes the net futures posi on of non-commercial traders expressed as a frac on of total open interest.
RESULTS
The impulse responses are intui ve, albeit not always significantly different from zero. A typical monetary policy shock can be characterized by a 15 basis points interest rate increase, which then starts decreasing, finally dropping slightly below its ini al level. The gradual withdrawal of the ini al ghtening reflects some smoothing in the conduct of monetary policy, which is a well-known finding in the literature. The exchange rate appreciates by 1.5 per cent on impact, which is followed by a gradual deprecia on towards its ini al level. Hence, the adjustment of the exchange rate is instantaneous without any delayed overshoo ng pa ern, in line with the predic on of the Dornbusch (1976) model. We do not observe any significant price puzzle either; the price index starts declining in the second year a er the shock, but the effect of the monetary contrac on is not significant.¹² Output declines quickly and to a sta s cally significant¹³ extent, which is in line with what we expect a er a contrac onary monetary policy shock. The fast GDP and slow CPI responses resembles the monetary transmission in New Keynesian s cky price models.
Shocks to risk premium increase short-term interest rate and depreciates the currency on impact, according to our iden fying assump ons. The effect of higher interest rate and weaker currency on GDP is not significantly different from zero. They affect domes c produc on in different ways: while the increase in interest rate reduces domes c demand, the deprecia on makes export more compe ve. In the CPI response the exchange rate channel seems to dominate: domes c prices increase, presumably due to the weaker currency. The ini al drop in carry trade posi on is followed by a gradual recovery of risk appe te.
In the second year a er the shock long specula ve posi ons are significantly higher than originally. This can be explained by the higher interest rate and the s ll apprecia ng exchange rate.
The most important result is that exchange rate and carry trade seem to react quickly to monetary policy, and there is no sign of delayed overshoo ng or prolonged carry trade inflow. Our impulse responses are in favour of Dornbusch (1976) and contradict to Brunnermeier et al. (2009) and Plan n and Shin (2011).
Since drawing conclusions about the shape of impulse responses based on pointwise median can be misleading (Sims and Zha, 1999), we report the posterior distribu on of the horizon when exchange rate and carry trade have their maximum response.
We calculate two measures to describe the peak response. We call “turning point” the earliest quarter when apprecia on turns to deprecia on. We call “minimum” the quarter where the exchange rate response has its minimum value over the 20 quarters horizon. These defini ons apply to carry trade with similar logic. The histograms confirm our previous finding that carry traders respond to monetary policy within the same quarter which results in a prompt adjustment of the exchange rate (Figure 2). According to the le panel, the peaks of the impulse responses are in the first period in most of the cases. The first peak mostly also coincides with the extreme value of the impulse response, as shown in the right panel.
A more direct way to assess the role and incen ves of carry trade is to quan fy the realized return a er a shock. If the exchange rate appreciates fast enough to an unexpected rate hike by the central bank, the subsequent deprecia on can eliminate the excess return, which is the logic of the uncovered interest parity theorem. The impulse response of (predictable) excess return suggests that the reac on of the exchange rate is even stronger a bit than what the UIP would imply (Figure 3). Right a er the shock the excess return becomes slightly nega ve, sugges ng that the rate at which the exchange rate depreciates a er the quick apprecia on is a bit faster than the corresponding interest rate differen al. In the case of risk premium shock the response of excess return is posi ve for several quarters. This means that the exchange rate depreciates immediately, and during the subsequent periods, together with the higher interest rate, its gradual recovery offers an excess return to compensate for the lower risk appe te or the higher perceived risk.
4.2 COMPARISON WITH THE CHOLESKY DECOMPOSITION
We briefly discuss the results with the Cholesky decomposi on of the covariance matrix with a recursive ordering. This is a standard star ng point in the literature studying the effect of monetary policy shocks (see Bjørnland, 2009; Uhlig, 2005, among others). Besides, it allows us to highlight the main theore cal difference between the recursive and the sign restric ons approach. In the former case — as long as the interest rate is ordered before the exchange rate, which is usually the case — it is (implicitly) assumed that an “exchange rate” or “risk premium” shock has no immediate effect on the interest rate. However,
¹² It is worth to recall that we do not impose restric ons on the price level.
¹³ Since we adopt a Bayesian approach, “significant” means that large part of the posterior distribu on is below or above a certain value. In this par cular case the lower 84 (i.e. the en re middle 68) percent of the impulse response posterior is below zero.
MAGYAR NEMZETI BANK
Figure 2
Posterior distribu on of the loca on of peak response to a monetary policy shock (as a percent of total draws)
0 20 40 60 80 100
0 1 2 3 4 5 6 7 8 9 10 11 12
HISTOGRAM of EXCHANGE RATE TURNING POINT
0 20 40 60 80 100
0 1 2 3 4 5 6 7 8 9 10 11 12
HISTOGRAM of EXCHANGE RATE MINIMUM
0 20 40 60 80 100
0 1 2 3 4 5 6 7 8 9 10 11 12
HISTOGRAM of CARRY TRADE TURNING POINT
0 20 40 60 80 100
0 1 2 3 4 5 6 7 8 9 10 11 12
HISTOGRAM of CARRY TRADE MAXIMUM
central banks tend to incorporate informa on about the exchange rate into their decisions as well as any other data that may influence the evolu on of the key variables like consumer prices or output gap. Therefore, we need to take this channel into account to properly iden fy monetary policy shocks.
Using the same VAR model, we calculate the impulse responses assuming a recursive structure of shocks, too. Our ordering is the following: GDP, CPI, interest rate, exchange rate and carry trade. Here we iden fy monetary policy shocks as an unexpected increase in the interest rate that affects GDP and CPI only with delay. Note again that the recursive scheme implies that monetary policy does not react to the last two shocks (exchange rate and carry trade) on impact.
The results are displayed in Figure 4. Contrary to the findings in the benchmark model, the dynamic response of the exchange rate exhibits delayed overshoo ng, reaching its peak response nearly 2 years a er the shock. The sluggishness of the exchange rate response is comparable to what Scholl and Uhlig (2008) have found using sign restric ons and somewhat longer than in Bouakez and Normandin (2010). It is also similar to the Cholesky decomposi on results of Bjørnland (2009). Consistently with
Figure 3
Excess return to monetary policy and risk premium shocks
0 5 10 15 20
−0.04
−0.03
−0.02
−0.01 0 0.01 0.02 0.03 0.04 0.05
EXCESS RETURN to MONETARY
0 5 10 15 20
−0.04
−0.03
−0.02
−0.01 0 0.01 0.02 0.03 0.04 0.05
EXCESS RETURN to RISK
Note: The solid line is the pointwise median of all successful draws. Dashed and do ed lines encompass the middle 68 and 95 per cent of the posterior distribu on, respec vely.
RESULTS
Figure 4
Responses to a monetary policy (interest rate) shock, Cholesky decomposi on
0 10 20
−0.003
−0.0025 −0.002
−0.0015 −0.001
−0.0005 0 0.0005
GDP to IR
0 10 20
−0.002
−0.0015 −0.001
−0.0005 0 0.0005 0.001 0.0015 0.002
CPI to IR
0 10 20
−0.001
−0.0005 0 0.0005 0.001 0.0015 0.002 0.0025 0.003 0.0035 0.004
IR to IR
0 10 20
−0.014
−0.012 −0.01
−0.008
−0.006
−0.004
−0.002 0 0.002 0.004 0.006
ER to IR
0 10 20
−0.04
−0.03
−0.02
−0.01 0 0.01 0.02 0.03 0.04 0.05
CARRY to IR
Note: The solid line is the pointwise median of all successful draws. Dashed and do ed lines encompass the middle 68 and 95 per cent of the posterior distribu on, respec vely.
the delayed apprecia on, significant carry trade ac vity can be detected even one year a er the shock. Our median impulse responses are quite similar to what Brunnermeier et al. (2009) have found, which is line with expecta ons since they also applied Cholesky decomposi on.
The posterior distribu on of the peak exchange rate response as well as the excess return confirm that the recursive iden fica on scheme does favour for prolonged UIP failure more than the sign restric on approach (Figure 5 and 6). Our conclusion is that iden fica on based on Cholesky decomposi on may indeed generate delayed overshoo ng.¹⁴
Figure 5
Loca on of exchange rate peak response under various iden fica on schemes to a monetary policy (or interest rate) shock (as a percent of total draws)
0 20 40 60 80 100
0 1 2 3 4 5 6 7 8 9 10 11 12
Per cent
Cholesky 0
20 40 60 80 100
0 1 2 3 4 5 6 7 8 9 10 11 12
Per cent
quarters Sign restriction
Note: The loca on where exchange rate impulse response has its minimum value are shown, see Figure 2.
¹⁴ It is noteworthy that delayed overshoo ng is not a robust finding even with Cholesky iden fica on. Using 2 lags in the VAR, the mode of peak responses with recursive ordering takes place much earlier. This is in line with Istrefi and Vonnak (2012) who find that Cholesky decomposi on does not always yield delayed overshoo ng.
MAGYAR NEMZETI BANK
Figure 6
Response of excess return to a monetary policy shock using sign restric ons (le ) and Cholesky decomposi on (right)
0 5 10 15 20
−0.04
−0.03
−0.02
−0.01 0 0.01 0.02 0.03
EXCESS RETURN to MONETARY
0 5 10 15 20
−0,04
−0,03
−0,02
−0,01 0 0,01 0,02 0,03
EXCESS RETURN to IR
Note: The solid line is the pointwise median of all successful draws. Dashed and do ed lines encompass the middle 68 and 95 per cent of the posterior distribu on, respec vely.
4.3 IDENTIFICATION OF FOREIGN SHOCKS
Since foreign shocks may be important drivers of carry ac vity, iden fica on of them is essen al for a thorough variance decomposi on analysis. In the literature cited above, some a empts have been already made to dis nguish domes c and foreign structural shocks. Kim and Roubini (2000), for instance, include the Federal Funds rate to control for foreign monetary policy, but since they do not iden fy U.S. monetary policy shocks, its movements may reflect other structural shocks as well.
Anzuini and Fornari (2012) use their variables in terms of differences to the corresponding U.S. variables, so they cannot separately iden fy the effect of foreign shocks. We take it for important to dis nguish between domes c and foreign shocks because even if they may have similar short-run effect on the differences, due to the asymmetric behaviour between a small and a big country, the medium and long-run effects may differ a lot. A trivial example is a monetary policy shock. While in the small country we expect the monetary policy to react to the change in the foreign interest rate, the same is not expected from the central bank of the big country. Thus, the implica on on exchange rate and carry trade response may differ substan ally.
In order to iden fy foreign shocks, we es mate a structural VAR separately for the U.S. variables with the same methodology as in the domes c case. The VAR includes the same four U.S. variables used in the panel VAR as exogenous, with 4 lags¹⁵ on the same sample. The only difference is that we did not include carry trade data and exogenous variables. We iden fy demand, supply, monetary policy and risk premium shocks using the same restric ons as in the panel model presented before, obviously without the restric ons on carry trade.
To calculate the effect of foreign shocks to domes c variables, we randomly draw from the posterior of U.S. impulse responses for each draw from the panel VAR, and feed the former into the la er through the exogenous U.S. variables. Figure 14 in the Appendix depicts the es mated impulse responses of the U.S. VAR.
Regarding the response of domes c variables to U.S. shocks, domes c interest rate reacts posi vely and the exchange rate depreciates a er a contrac onary U.S. monetary policy shock (Figure 15 in the Appendix). GDP and CPI do not show sta s cally significant responses, neither the main variable of interest, the carry posi on, although its immediate response is intui ve. Carry trade jumps to an U.S. risk premium shock significantly, but the magnitude is again much smaller than in the case of domes c shock. This suggests that U.S. shocks have a minor role in carry trade ac vity.
4.4 VARIANCE DECOMPOSITION
Figure 7 shows the decomposi on of the variance of k-step ahead forecast error of the carry trade. According to the median es mates, domes c monetary policy and risk premium shocks explain more than 20-20 per cent of carry trade variability over
¹⁵ The number of lags was selected by looking at the usual informa on criteria and making sure that the residuals are free of autocorrela on.
RESULTS
almost the whole 5-year horizon. Median es mates are surrounded by large posterior uncertainty. The other shocks seem to play only a minor role in carry trade. This is consistent with the variance decomposi on of forecast error of the exchange rate (Figure 16 in the Appendix), where the explanatory power of domes c monetary policy and risk premium shocks is similarly high.¹⁶ The median of unexplained variance remained less than 10 per cent at each horizon.
It is worth men oning that the role of U.S. shocks, including monetary policy shocks is of second order in explaining carry trade varia on. The main reason for it can be that domes c monetary policy reacts to foreign shocks so that interest rate differen al does not change too much, which discourages carry trade and thereby mi gates the exchange rate response. This interpreta on is confirmed by the results as the posterior distribu on of the interest rate differen al a er a U.S. monetary policy shock¹⁷ is quite symmetric around zero at each horizon. On the other hand, domes c monetary policy shocks are important for carry trade, because they lead to persistent changes in interest rate differen al. Note again, that in order to get these results both domes c and foreign shocks have to be iden fied.
Figure 7
Variance decomposi on of carry trade
0 10 20
0 20 40 60 80 100
Monetary
0 10 20
0 20 40 60 80 100
Risk
0 10 20
0 20 40 60 80 100
Demand
0 10 20
0 20 40 60 80 100
Supply
0 10 20
0 20 40 60 80 100
Unexplained
0 10 20
0 20 40 60 80 100
US Monetary
0 10 20
0 20 40 60 80 100
US Risk
0 10 20
0 20 40 60 80 100
US Demand
0 10 20
0 20 40 60 80 100
US Supply
Note: The solid line is the pointwise median of all successful draws. Dashed and do ed lines encompass the middle 68 and 95 per cent of the posterior distribu on, respec vely.
¹⁶ Another issue in recent literature is the connec on between monetary policy shocks and exchange rate varia on. Our results show that monetary policy shocks explain 20 per cent of exchange rate fluctua ons at shorter horizon, while the contribu on is 5 per cent at longer horizon. This is broadly in line with Scholl and Uhlig (2008) but smaller than what Bouakez and Normandin (2010) have reported. Kim and Roubini (2000) have found much higher contribu on, around 60 per cent at short horizon.
¹⁷ Not shown in the paper, but available upon request.
5 Robustness analysis
In this sec on we test the robustness of the results to the iden fica on assump ons and the data frequency. Both tests are mo vated by the zero restric ons we imposed in our benchmark model. As men oned earlier, the assump on that GDP and prices respond to monetary policy and risk premium shocks with several months delay can be cri cised in case of small open economies where the exchange rate channel is strong. In the first experiment we relax the zero restric ons. In the second case we use higher frequency data to make zero restric ons more credible.
5.1 PURE SIGN RESTRICTION APPROACH
First, we consider a pure sign restric on approach as an alterna ve iden fica on strategy. More specifically, our restric ons are the following in this case:
⎛
⎜⎜
⎜
⎜⎜
⎜
⎝
Prod t Prices t Interest t Exchange t Carry t
⎞
⎟⎟
⎟
⎟⎟
⎟
⎠
⎡
⎢
⎢
⎢
⎢
⎢
⎢
⎢
⎢
⎣
⋅ ⋅
⋅
⋅ ⋅
⋅
⋅ ⋅ ⋅
⎤
⎥
⎥
⎥
⎥
⎥
⎥
⎥
⎥
⎦
⎛
⎜⎜
⎜
⎜⎜
⎜
⎝ uMonetaryt uRiskt uDemandt uSupplyt u5t
⎞
⎟⎟
⎟
⎟⎟
⎟
⎠
(8)
where the nota on is the same as in the benchmark model. Compared to the baseline specifica on, some addi onal restric ons are necessary to disentangle the shocks of interest. Par cularly, we use sign restric ons for the responses of GDP and prices, with the excep on of the unrestricted response of GDP to a risk premium shock (see the upper le 2×2 matrix). Furthermore, we assume that the exchange rate appreciates a er an unexpected demand shock, and depreciates following a supply shock, which is broadly in line with standard macroeconomic models.
Impulse responses that are in the centre of our interest do not alter significantly compared to the benchmark model (Figure 8). The price puzzle is now avoided by construc on, as in Uhlig (2005). No delayed overshoo ng of the exchange rate can be observed either in this case, and the responses of carry ac vity (which were unrestricted) move in the direc on presented previously (Figure 9).
Turning to the variance decomposi on, Figure 10 shows that monetary policy and risk premium shocks explain less variance in carry ac vity, and larger explanatory power is a ributed to other domes c shocks compared to the benchmark result. This can be a consequence of restric ng the sign of the exchange rate response to other shocks as well.
5.2 MONTHLY FREQUENCY
To make the zero restric ons more credible, we es mate the same model on monthly frequency. The assump on that the response of GDP and CPI to monetary and risk premium shocks is lagged by one month is more defendable than the one quarter delay. We use monthly data from 1992M4 to 2007M12 and the VAR includes 3 lags of the endogenous variables. In the U.S. VAR we use 7 lags.¹⁸ As GDP data is not available on monthly frequency, we opt for industrial produc on instead. The
¹⁸ The choice of lag numbers was mo vated by the rejec on of serial correla on in the residuals. We es mated an alterna ve version with 9 lags for both panel and U.S. models and no serial correla on was detected either. Results do not change significantly compared to the case described above.
ROBUSTNESS ANALYSIS
Figure 8
Responses to a monetary policy and a risk premium shock with pure sign restric ons
0 10 20
−0.006
−0.005
−0.004
−0.003
−0.002
−0.001 0 0.001
GDP to MONETARY
0 10 20
−0.005
−0.004
−0.003
−0.002
−0.001 0 0.001
CPI to MONETARY
0 10 20
−0.0015 −0.001
−0.0005 0 0.0005 0.001 0.0015 0.002 0.0025 0.003
IR to MONETARY
0 10 20
−0.03
−0.025 −0.02
−0.015 −0.01
−0.005 0 0.005 0.01
ER to MONETARY
0 10 20
−0.05 0 0.05 0.1 0.15 0.2
CARRY to MONETARY
0 10 20
−0.005
−0.004
−0.003
−0.002
−0.001 0 0.001 0.002 0.003 0.004
GDP to RISK
0 10 20
−0.001 0 0.001 0.002 0.003 0.004 0.005
CPI to RISK
0 10 20
−0.001
−0.0005 0 0.0005 0.001 0.0015 0.002 0.0025 0.003
IR to RISK
0 10 20
−0.01
−0.005 0 0.005 0.01 0.015 0.02 0.025 0.03
ER to RISK
0 10 20
−0.2
−0.15 −0.1
−0.05 0 0.05 0.1 0.15
CARRY to RISK
Note: The solid line is the pointwise median of all successful draws. Dashed and do ed lines encompass the middle 68 and 95 per cent of the posterior distribu on, respec vely.
Figure 9
Posterior distribu on of the loca on of peak response with pure sign restric ons to a monetary policy shock (as a percent of total draws)
0 20 40 60 80 100
0 1 2 3 4 5 6 7 8 9 10 11 12
HISTOGRAM of EXCHANGE RATE TURNING POINT
0 20 40 60 80 100
0 1 2 3 4 5 6 7 8 9 10 11 12
HISTOGRAM of EXCHANGE RATE MINIMUM
0 20 40 60 80 100
0 1 2 3 4 5 6 7 8 9 10 11 12
HISTOGRAM of CARRY TRADE TURNING POINT
0 20 40 60 80 100
0 1 2 3 4 5 6 7 8 9 10 11 12
HISTOGRAM of CARRY TRADE MAXIMUM
MAGYAR NEMZETI BANK
Figure 10
Variance decomposi on of carry trade with pure sign restric ons
0 10 20
0 20 40 60 80 100
Monetary
0 10 20
0 20 40 60 80 100
Risk
0 10 20
0 20 40 60 80 100
Demand
0 10 20
0 20 40 60 80 100
Supply
0 10 20
0 20 40 60 80 100
Unexplained
0 10 20
0 20 40 60 80 100
US Monetary
0 10 20
0 20 40 60 80 100
US Risk
0 10 20
0 20 40 60 80 100
US Demand
0 10 20
0 20 40 60 80 100
US Supply
Note: The solid line is the pointwise median of all successful draws. Dashed and do ed lines encompass the middle 68 and 95 per cent of the posterior distribu on, respec vely.
authori es of Australia do not publish monthly data on consumer prices and economic ac vity, therefore we have to restrict our panel sample to Canada and the United Kingdom.
The results depicted in Figure 11 confirm that the exchange rate and carry ac vity react within a quarter (1-2 months at most) to a monetary policy shock, generally. Unfortunately, the responses of industrial produc on and consumer prices are not significantly different from zero. Variance decomposi ons lead to the same conclusion, with monetary policy and risk premium remaining dominant in explaining the total variance of carry ac vity.
Our robustness checks confirm the main results of the benchmark model. However, their impulse responses are less convincing in general than the original specifica on. Moreover, relaxing zero restric ons requires addi onal restric ons, and changing the frequency decreases the sample. Taking all these trade-offs together, we find it reasonable to s ck to the benchmark model.
ROBUSTNESS ANALYSIS
Figure 11
Responses to a monetary policy and a risk premium shock with monthly data
0 20 40 60
−0.004
−0.003
−0.002
−0.001 0 0.001 0.002 0.003 0.004
IPROD to MONETARY
0 20 40 60
−0.002
−0.0015 −0.001
−0.0005 0 0.0005 0.001 0.0015 0.002
CPI to MONETARY
0 20 40 60
−0.001 0 0.001 0.002 0.003 0.004 0.005
IR to MONETARY
0 20 40 60
−0.02
−0.015 −0.01
−0.005 0 0.005
ER to MONETARY
0 20 40 60
−0.02 0 0.02 0.04 0.06 0.08 0.1 0.12 0.14 0.16 0.18
CARRY to MONETARY
0 20 40 60
−0.006
−0.005
−0.004
−0.003
−0.002
−0.001 0 0.001 0.002 0.003
IPROD to RISK
0 20 40 60
−0.002
−0.0015 −0.001
−0.0005 0 0.0005 0.001 0.0015 0.002 0.0025
CPI to RISK
0 20 40 60
−0.0005 0 0.0005 0.001 0.0015 0.002 0.0025 0.003 0.0035 0.004
IR to RISK
0 20 40 60
−0.005 0 0.005 0.01 0.015 0.02
ER to RISK
0 20 40 60
−0.2
−0.15 −0.1
−0.05 0 0.05
CARRY to RISK
Note: The solid line is the pointwise median of all successful draws. Dashed and do ed lines encompass the middle 68 and 95 per cent of the posterior distribu on, respec vely.