University of West Hungary Faculty of Economics
POSSIBILITIES OF MEASUREMENT OF CAPITAL SERVICES AND THE TASKS OF THE FIXED CAPITAL STATISTICS IN HUNGARY
Thesis of Doctoral (PhD) Dissertation
Tímea Cseh
Sopron 2015
Doctoral School: István Széchenyi Management and Organisation Sciences Doctoral School
Head of Doctoral School: Prof. Dr. Csaba Székely
Programme: Entrepreneurial economics and management program Head of Programme: Prof. Dr. Csaba Székely
Supervisor: Prof. Dr. Gusztáv Báger
……….
Supporting Signature of Supervisor
1 1. Objectives, hypotheses
Fixed capital largely determines the economic growth. Therefore fixed capital statistics is a very important part of national accounts, and essential to potential GDP and productivity calculations. Reliability of the results of economic analysis and forecasts are significantly related to the quality of input data. As a result of this, an increasing demand occurs for more detailed and more accurate data of fixed capital statistics. Thus it is very important to register the non-financial fixed capital more precisely and to measure them according to a comprehensive and a widely accepted methodology.
Accounting of fixed capital is a very comprehensive and a hardly implemented task because of the diversity of the assets. Often there are problems with the registry of the non- financial assets at the micro-level as well. Leading an accurate and up-to-date register of the different types, quality, age and often very special assets could be very difficult work for larger companies or those using very special asset types. However, rational management system needs to know the value of the assets, not just in the time of their acquisition but also in the whole lifetime during the production period. The difficulty of measuring capital comes from the diversity of their lifetime in addition to the diversity of the asset types (BLADES 1983). Determination of the value of different asset types is also crucial because the value of these is in many ways different (type, quality, age, service life) assets have to be aggregated for compiling the macro statistics. Information from the accounting records, in many cases, distorts the determination of the actual value of the assets because the expected lifetime of the assets are accounted according to the tax and accounting criteria. This may significantly divert the accounted value from the actual value in various stages of production. Unlike the tax and accounting statements, the macroeconomic statistics are aimed at a more accurate measurement of the value of the assets during the whole production period. However the methodology for this is still not fully described and explained. One of the main directions of development of the national accounts is to account the fixed assets as a production input value, volume and the unit price. Because of these practices, the main research findings were available in the field of capital measurement in economic statistics in the past 15 to 20 years.
The actuality of the topic is well-founded for several reasons. The measurement of capital is one of the most popular areas of the economic literature worldwide for several decades.
The international organizations such as the Statistical Department of the United Nations,
2
the OECD and the statistical office of the European Union (EUROSTAT) initiated several debate and workshops regarding the capital measurement. Dilemmas of fixed capital statistics – in conceptual and in practical aspects too – were highlighted in the handbooks published recently and in the Regulation of the national accounts statistics of the EU member states (ESA2010). Previously the main point of the capital measurement was the measuring of the gross (at replacement cost) and net value (at present prices) of the assets as well as the consumption of fixed capital. In these cases the asset value was determined by its ages. But after recent researches there is an increasing demand for measuring the capital services in statistics, which takes into account also the accuracy and effectiveness of the assets used in production.
The global financial and economic crisis included Europe too in the second half of 2008 and redrawn the role of statistical indicators, which further caused an increase of the relevance of the topic. Due to the crisis and the economic globalization an increasingly wider and closer cooperation was resulted between the national and international statistical institutions. There is greater attention and more demand on: new indicators and indicator systems; the elimination of the differences in methodologies; and the measurement of the stock data. In principle, stock data expresses the degree of well-being rather than flow data, which is used in practice (AHMAD et al. 2005). However, the wealth data or the changes in wealth are rarely used as indicator at the international level due to the difficulty of measuring capital (HÜTTL-VITA 2005).
1.1. Aims of the research
The goal of the research was to examine the current state of the Hungarian fixed capital statistics, to lay the foundation of the measurement of capital services and to conduct its first calculations. The dissertation concentrates on the fixed capitals, which represents the significant part of the value of the non-financial assets. It gathers the specificity of the measurement of the stock type (fixed capital stock) and flow type (fixed capital formation) indicators furthermore it demonstrates the significant points of the Hungarian practice.
The author intends to demonstrate: the possibilities of the measurement of capital services, which has not yet been used in Hungary; its implementation in the Hungarian statistics system; and its connections to the currently used methodologies.
3
Capital services data, available freely at the international level, was calculated in the framework of the EUKLEMS project in Europe, but the official Hungarian statistical offices have not published data in this field until recently. The EUKLEMS project – in a simplified way – used uniform parameters for the missing national data of the member states of the EU, ignoring some special characteristics of the countries. Based on this – since there are no calculations for estimating the capital services in Hungary – this research can be especially useful as exploratory study in the fixed assets statistics.
1.2. Hypotheses
In accordance with the objectives, five hypotheses were drafted. The hypotheses are based on the new tasks related to the implementation of the capital services calculations and on the expectations regarding the relationship of the results of the new calculations with the national accounts data. The test and proof or possible cancellation of the hypotheses were carried out based on the results of the empirical study.
1. The applied rate of return (cost of the capital) has significant impact on the user cost of the capital, which is the basis of the calculation of capital services.
Four different interest rates were examined in the research. First, the rate of return (endogenous rate of return) was determined from national accounts data. The net operating income was divided by the value of fixed assets in the market sectors. Assumptions for exogenous rate of return (3 to 4%, or mixed interest rates) were based on the monthly average interest rates of non-financial companies that came from the database of the National Bank of Hungary.
Results show that the user cost calculated by different rates of rent has significant differences in the case of each asset type in all years.
In the whole 14 year-long time series for all of the assets the user costs calculated by the endogenous rate of return are significantly higher (the level of significance is 5%) than the level of the user cost calculated by the three different types of exogenous rate of return.
4
Between 1996 and 2009 for all asset types the average annual user cost calculated by endogenous rate of return is 3 935 billion HUF. This same amount is 2 617 billion HUF if the mixed rate of return is used, 2 463 billion HUF in case of 4% rate of return, and 2 250 billion HUF if the rate of return is assumed to be 3%. The user cost calculated by the endogenous rate of return is by 60% higher than the value calculated by 4% rate of return.
The average value of user cost calculated by 4% rate of return, is 6% lower, than the user cost calculated by mixed rate of return, but 9% higher than the user cost calculated by 3%
rate of return in the investigated period.
In the case of endogenous rate of return, the share by asset types of the user cost shows that the average rate of the buildings is the highest (48%), the machines and equipment have 38%, while the transportation equipment has 12%, and software has around 1% of the whole between 1996 and 2009. In case of using a 4% rate of return to calculate the user cost of the assets, the machinery and equipment show the highest share between the assets (43%). The buildings show 41%, the transportation equipment 14%, and software 2% of the user cost for all asset types.
The impact of the different rate of return to the user cost is illustrated by the example of the time series of one asset type, the machinery and equipment. The share of user cost of machinery and equipment in total user cost show differences by the various rates of return.
This rate calculated by the endogenous rate of return is significantly lower than the rates calculated by exogenous rate of return (considering that the level of significance is 5%).
2. Utilizing a depreciation function differing from the linear function, in other words, utilizing geometric and hyperbolic functions for the determination of the value of the fixed capital, the results in both cases differ significantly from the linear fixed capital stock.
Fixed capital of four asset groups of non-financial corporations were analyzed, using different assumptions for the method of depreciation. The values calculated with the linear depreciation method were considered as benchmark. This method is used in the Hungarian fixed capital statistics. The results confirmed the expectations described below. The net fixed capital – considering everything else stationary – calculated with hyperbolic depreciation function is above the net fixed capital calculated by linear depreciation
5
function. The net fixed capital – considering everything else stationary – calculated with geometric method is below the net fixed capital calculated by linear depreciation function.
The differences for all asset categories show similar relations and considering p=0.05 they are significant both at current and constant prices. The net fixed capital was studied in the non-financial corporation’s sector between 1995-2009. The values of the geometric net fixed capital stock at current prices were below the values of linear net fixed capital stock with an average of 15.6%. The values of the hyperbolic net fixed capital stock at current prices were above the values of linear net fixed capital stock with an average of 28.2%.
3. In the framework of fixed capital statistics – considering that besides the depreciation, efficiency of the assets decreases as well – a depreciation profile consistent with the efficiency profile shall be used. In this case, it is probable that for the calculation of depreciation a profile other than the linear depreciation function – which is currently used in the Hungarian practice - shall be used.
Considering the average life expectancy data used in the current Hungarian PIM model, and assuming that the efficiency of assets follows geometric depreciation during their service lives, it was proven that the depreciation function shows a geometric decrease.
In this case assuming the geometric depreciation and efficiency functions, it was demonstrated that the value of the net fixed capital is less than the value of net stock determined by the currently used linear calculation methodology.
Consumption of fixed capital of a given year can be determined based on the time series of the net fixed capital values. The depreciation affects the level of the GDP in the case of non-market producers (non-profit sectors serving governments and households).
Considering the average of the years studied (1996-2009), the depreciation data calculated with the geometric method are 11% higher than the values calculated with linear model – in contrast to the evaluation of the net fixed capital. The depreciation data calculated with the hyperbolic method are 23% lower than the values calculated with linear model – in contrast to the evaluation of the net fixed capital.
6
4. Service life of the non-financial assets has impact on the volume indices of net fixed capital.
Volume indices can be calculated from the value of net fixed capital at constant (at 1999) prices. It is calculated by three different models (assuming linear, geometric and hyperbolic depreciation function) for the period 1996-2009.
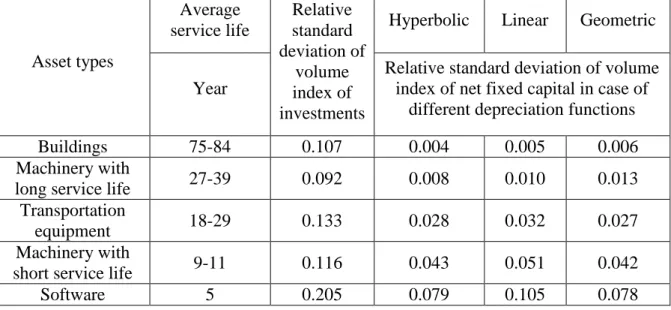
There are significant differences between the average service lives of the asset groups in the national economy; the extent of the average service life is 70-79 years. The average service life of software is 5 years; in case of the buildings this average is between 75 and 84 years. The average service life and the variability of the investment values by asset groups show an inverse relation based on the time series of 1996-2009. These can be seen from the relative standard deviations of volume indices on investments by asset groups (Table 1). The relative standard deviation of volume indices of software investments is about double of the same indicator for buildings.
Table 1: Average service life and relative standard deviation of volume indices of net capital stock by asset groups in the national economy, 1995-2009
Asset types
Average service life
Relative standard deviation of
volume index of investments
Hyperbolic Linear Geometric
Year
Relative standard deviation of volume index of net fixed capital in case of
different depreciation functions
Buildings 75-84 0.107 0.004 0.005 0.006
Machinery with
long service life 27-39 0.092 0.008 0.010 0.013
Transportation
equipment 18-29 0.133 0.028 0.032 0.027
Machinery with
short service life 9-11 0.116 0.043 0.051 0.042
Software 5 0.205 0.079 0.105 0.078
The relative standard deviations of volume indices on net fixed capital by asset groups and by all the three models in 1996-2009 – like in case of investments – change in inverse way than the average service life. Considering the models, the relative standard deviations of volume indices of net capital of software are 13-20 times higher than the values derived for buildings.
7
Considering the three model, the relative standard deviations of volume indices of net capital with a short service life are higher in the case of linear depreciation model than using the geometric or hyperbolic model. The relative standard deviations of volume indices of assets with a long service life do not show significant differences between the three models.
From the relative standard deviation values of volume indices it can be deduced that the variability of the investment costs of assets with a long service life appears to a smaller extent in the value of net capital stock as in the case of the assets with a short service life.
In case of assets with a long service life (buildings) the relative standard deviation of the investment is about 20 times higher than the relative standard deviation of the net capital stock, while this ratio in case of software is just about double.
These results are reflected in the correlation coefficient of volume indices. The correlation coefficient of the time series of volume indices of investments and of the time series of volume indices of net capital stock is higher for buildings than for software, in case of all three models. The coefficient of determination is based on the coefficient of correlation and defines how the volume indices of net capital can be explained by the volume indices of investments.
5. The gross operating surplus of Hungarian national accounts is underestimated compared to the theoretic values, because the gross operating surplus does not include all of the capital services of non-market producers.
By definition the gross operating surplus of the non-market producers is equal to the value of the consumption of produced non-financial assets (depreciations). However the real value of the contribution of the assets to the production is the value of capital service. This amount covers not just the depreciation of the assets, but also the opportunity cost of the value of fixed capital and the value of taxes less subsidies on the fixed capital used in the production.
The opportunity cost of capital should be calculated for every non-financial asset independently from the owners’ sector classification. Consequently opportunity cost should be calculated also in the non-market sector. To calculate the opportunity cost an applied rate of return is needed. However by definition the calculated rate of return of a
8
non-market producer is zero, therefore either the rate of return from the market producer (endogenously), or an exogenous rate of return shall be applied. According to this, capital services were calculated by four different rates of return (by 3%, 4%, mixed and endogenous rate of return) and the results of the calculation prove that if the opportunity cost of the fixed assets is ignored in the calculation, than the gross operating surplus of the national economy is underestimated. Consequently, because the gross operating surplus is part of the output, the level and the growth of the output are also underestimated. Growth of the operating surplus for non-market producers can be calculated as the difference between the user cost of the fixed capital – depending on the selected interest rates – and the consumption of fixed capital.
The growth of the gross operating surplus between 1996 and 2009 suggests that in case of the economic growth and productivity calculations, the contribution of the non-financial assets to the production is underestimated in average by 600-2000 billion HUF depending on the applied rates of return. Thus, by accounting for capital services, the GDP would increase with this value in the time of 1996-2009.
In conclusion, it can be stated that – based on the above findings – all the hypotheses of this dissertation were confirmed.
2. Content, method and justification of research
The research was based on collecting and processing of secondary information and methodologies. For the time being literature is limited in Hungarian in the field of capital services, therefore mainly English literature was used. There was also a search for the best practices; therefore foreign country practices (e.g. Netherlands, Canada) were also studied in the research. Proceeding of secondary data and information means that several methodologies, analysis and papers were studied, and existing models were used for the estimations as well as for the analysis and interpretation of the results. Contents of the dissertation similarly to the official statistical publication of fixed capital statistics are consistent with the Handbook of OECD (2009), Measuring Capital. This Manual summarises the most important definitions, estimation methods and relations in the case of fixed capital at the macro level.
9
A questionnaire was compiled for the primary research which has the objective that the new indicator, the capital services, can be calculated more accurately by analysing the fixed capital used in production. However, the questionnaires were refused by data providers, who stated the data and information of the questionnaire was too sensitive data due to the breakdowns in the data.
After the lack of response the questionnaire, data of surveys of the Hungarian Central Statistical Office were used for the calculation. Studying the information on the data collection (conditions of data collection, units covered by the survey and so forth) was necessary before processing the data. In the dissertation the fixed capital statistics data were analysed based on the information collected in the seconder research, considering the methodology of capital services. Calculations, charts and tables of the dissertation were edited in Microsoft Excel software.
3. Research findings
The results of the research show that the analysis of the value of the capital from various aspects is required. On one hand, regardless of the purpose of the further use of the measurement on capital, the choice between the right assumptions and parameters is essential because it may significantly affect the value of the level of capital. On the other hand, the purpose of the use of the results must be taken into account. Thus it is not the same whether the purpose of the measurement of a capital for further studies is to calculate the value of wealth or the value of the production capacity. In the latter case the value of capital services should be used instead of net capital stock, which is calculated often in the current practice. The calculation of the capital services does not require more data collection than in the case of calculation of capital stock. Mainly the same statistical information can be used for the calculation of different type of asset value.
Besides improving the analysis of contribution of capital to the production, the calculation of the capital services has impact on the data of the national accounts system as well.
Capital services are partly included in the Hungarian national accounts. On the one hand the gross operating surplus of market producers and a part of mixed income can be considered as a part of the capital services (but it does not make it possible to measure the
10
value of capital services by asset types). On the other hand, capital services of non-market producers are only partially covered by the value of consumption of fixed capital.
Assuming constant rate of decline, the geometric depreciation function could be used instead of the linear depreciation function which is currently used in the present Hungarian statistical calculations. In case of the geometric profile, the profiles used for calculating consumption of fixed capital and profiles used for calculating capital services, namely the age-price and age-efficiency profiles are identical.
The output, the value added and the gross operating surplus of the non-market producers are increasing by the introduction of the capital services in the system of the national accounts. These have significant impact on the level of the GDP, but not on the growth rate.
The rate of return used in the calculation of capital services has impact on the increase of the capital input used in the production processes as well. Therefore, the rate of return has influence on the contribution of the fixed capital to the growth and on the economic growth itself. Thus empirical results have impact on the conclusions considering the development of the competitiveness of the national economy.
Based on the above described information the result of the research may contribute to the introduction of the calculation of capital services in an official statistical framework.
Results of this thesis can contribute to the widening and precision of the indicators of Hungarian fixed capital statistics by taking into account analytical needs and the international data supply.
11 3.1. New research findings
By processing the secondary literature, data and information, as well as with the help of the empirical study, new scientific research results in the Hungarian fixed capital statistics were produced.
1. The dissertation mapped and summarized the most important changes and improvements of the fixed capital statistics in Hungary in the past one and a half decade.
2. Mathematical-statistical analyses were conducted to show the effect of the modification of calculation of consumption of fixed capital to the net wealth, furthermore to the most important indicator of the national accounts, which is the gross domestic products indicator.
3. As an innovative scientific result, a comprehensive research and a pilot calculation was carried out in order to determine the value of the capital services.
4. One of the most important components of the calculation of the capital services, the return on capital, which is the required for the calculation of the yield of capital used for production. The effects of the use of different rates, were examined thoroughly in the dissertation as well
4. Conclusions and recommendations
4.1. Theoretical use of the research
The productivity is a ratio between inputs and outputs of the production, which expresses the combined effect of all the factors that has impact on the production of outputs but are not included in the production inputs. Factors which are detectable and separate, (e.g. the embodiment of technological progress, and their contribution to the production) are not included in the productivity. For the factors which cannot be detected separately, it can be assumed that weather the value of them does not change, or the value of it is incorporated
12
in the productivity (e.g. efficiency. scale and capacity utilization). Therefore accurate calculation of capital input is essential to measure the productivity of capital.
The gross (or net) value of the capital stock is used incorrectly in the production process analysis in many research studies and analysis. However, this method is only appropriate in some special cases. The capital service, namely the calculating of the value of capital input, enables to calculate the contribution of the assets to the value added of more precisely production (a production indicator) and makes it possible to calculate for a more complete accounting of fixed assets in the national accounts system.
4.2. Practical use of the research
Measuring the participation of the capital in the production process is a relevant area of research in economics for nearly 50 years. Considering the fixed assets, summarizing the theoretical and practical achievements in international researches and gaining knowledge about the general principles are essential for the development of the fixed assets statistics related to the Hungarian national economy. The objectives of this research were to map the broad international research literature and summarize the most important facts of that related to fixed capital statistics. Whit this it is aimed to provide assistance to the Hungarian statistics to put into practice the theory described in the methodology. Besides the summary of the theoretical background, several parameters used in the calculations of this thesis could be useful for the introduction of the capital services for the official fixed capital statistics.
Assumptions and parameters applied in the model of the dissertation are methodologically sound and are applicable within the Hungarian economical framework. Furthermore they can be used in the calculations of the official statistical services. This allows calculating the capital services and the productive capital stock, examining the connections between productive capital stock and operating profit (value added and GDP). These may greatly contributes to improve a more accurate calculation and analysis of productivity, competitiveness and economic growth and to increase the international comparability of the Hungarian data.
13 4.3. Suggested further research directions
As it was discussed in the dissertation and in national professional conferences, institutions which intend to introduce the capital services have to carry out major researches and analytical studies. The current measurement of stock and that of consumption of fixed capital data need to be developed and revised too in order to implement the new approach in the calculation of capital services. Calculation of capital services can be implemented in the system only with consistency with the above mentioned data and the indicators of national accounts.
The one and a half decades since the last survey on fixed assets and the changes of classifications (classification by activity (NACE) of owners of assets as well as the new classification of assets in ESA2010 methodology), require a new and detailed survey. A comprehensive, long capital formation time series measured by the NACE 2008 and by detailed breakdown or disaggregation of the asset groups could ensure the calculation of the capital services and their implementation in the official statistics.
It would be important to widen the data collection and estimation for several asset types, to measure the value also of the non-produced assets, and to integrate these data in capital service calculations. In addition, the importance of this work is confirmed by the increasing appearance of intellectual property products and the information and communications equipment.
Based on the results of the research, it is recommended that not only horizontally extensive data but vertically deeper disaggregated data would be required for more accurate estimates (for example, in case of intellectual property products software data need to be detailed, as well as computer hardware should be separated from other machines and devices).
In the time of the official implementation of the capital services and during the improvement of the fixed capital statistics, more analysis could be needed, e.g. the present depreciation function and the assumption used for the disposals should be reviewed. In
14
case of average lifetime of an asset group by industries normal dispersion is assumed. It could be useful to analyse the impact of the uses of other distribution function (e.g.
Winfrey type) on the Hungarian fixed capital indicators as well.
Analyses of the international practices show that the spread of disaggregated data of economic statistics are increasing. Considering the Hungarian fixed capital statistics, this trend requires – in addition to the above mentioned more detailed asset groups – the improvement of the calculation methods of regional and quarterly data of fixed capital, consumption of fixed capital and capital services. In case of annual data the expansion of the observed asset groups could be the main task for the statisticians. By contrast, initially the development of the methodology of the measurement of the most important asset groups could be satisfactory in case of the quarterly and regional data of fixed capital statistics. Then step by step also the estimation of the regional and quarterly data could be refining by using the results of the annual calculations.
15
5. Publications related to the dissertation’s subject
Cseh Tímea: Új módszertani fejlesztések az állóeszköz-statisztikában Magyarországon. In:
Statisztikai Szemle. 92. évfolyam 11-12. szám. 2014. November-december. 1037-1053.
Cseh Tímea: Az eszközárak változása és a jövedelmezőség makroökonómiai mérése. In:
Statisztikai Szemle. 92. évfolyam 11-12. szám. 2014. November-december. 1093-1097.
Cseh Tímea: Integrating Assets in National Accounts. In: The Evaluation of Natural Resources. Szerk.: Ugrósdy Gy. – Molnár J. – Szűcs I. Szent István Univerity. Gödöllő.
2014. 261-268.
Cseh Tímea: Fajlagos ágazati tőkehozamok a magyar gazdaságban 1995 és 2009 között.
In: Statisztikai Szemle. 91. évfolyam 3. szám. 2013. Március. 287-305.
Cseh Tímea: Vélemények az új tevékenységi (NACE Rev. 2) osztályozások bevezetésének feltételeiről; In: Gazdaság és Statisztika 17. (56.) évfolyam. 4. szám. 2005. augusztus. 71- 75.
Cseh Tímea: A köz- és magánszféra sikeres együttműködése Írországban; In: Gazdaság és Statisztika 17. (56.) évfolyam. 2. szám. 2005. április. 68-73.
Cseh Tímea: Crisis in Europe – in View of National Accounts. In: Science for Sustainability. International Scientific Conference for PhD Students. University of West Hungary. Győr. March 19-20. 2013. ISBN 978-963-334-103-2. 315-320.
Cseh Tímea: Az állóeszközök statisztikai megfigyelésének sajátosságai. In: V. KHEOPS Tudományos Konferencia Előadáskötete. Mór. 2010. május 19. ISBN: 978-963-87553-6-0.
167-176.
Cseh Tímea: Állóeszköz-statisztika Magyarországon az elmúlt 50 évben. In: Erdei Ferenc V. Tudományos Konferencia I. kötet. Kecskemét. 2009. szeptember 3-4. ISBN: 978-963- 7294-74-7. 65-69.