COMPARISON OF DIFFERENT SPACE INDEXING METHODS FOR ECOLOGICAL EVALUATION OF URBAN OPEN SPACES
TAKÁCS,D.*–VARRÓ,D.K.–BAKAY,E.
Corvinus University of Budapest, Department of Garden and Open Space Design 1118 Budapest, Villányi út 29–43., Hungary
(phone: +36-1-482-6290)
*Corresponding author
e-mail: daniel.takacs@uni-corvinus.hu
(Received 23rd July 2014; accepted 12th Aug 2014)
Abstract. Nowadays we meet many different evaluation methods regarding the ecological performance of green surfaces and parks. All these methods are extremely valuable in determining how well a green surface performs from ecological aspect and to what extent the environment were damaged if these sites would be built or would be developed any other way causing reduction of green surfaces. The goal of the article is to clarify the differences between two evaluation methods (GSI – Green Space Intensity, BARC – Biological Activity Rate Calculation) suitable for urban green infrastructure analysis and to see if any significant difference can be observed evaluating the same site by these methods. Our research sites are in Budapest and their sizes vary between 2,5-8 acres. The most important aspects of site analysis are the following: size and boundaries of the park, existence or lack of water features, the characteristics of their surfaces and the complexity of vegetation. We summarize the data of the site analysis in tables, make a summarizing diagram for visual representation and draw conclusions from the results. As a final step, we evaluate how these two evaluation systems relate to urban open space developments.
Keywords: remote sensing, urban vegetation, vegetation index, biological activity, green surface
Introduction
Nowadays we meet many different evaluation methods regarding the ecological performance of green surfaces and parks. Some of them measure the ecological or biological assessment of a park by using questionnaires. The answers are converted into numbers referring to the ecological value of the measured site. There are also methods which evaluate infrared photo and conclude the biological performance of the site from certain data gained from the photo.
All these methods are extremely valuable in determining how well a park or green surface performs from an ecological aspect and to what extent the environment were damaged if these site would be built or would be developed any other way causing reduction of green surfaces and loss of recreational function of the site.
In our time we have more and more opportunities to evaluate any specific site by different methods. Sometimes even professionals get lost among the many different methods. Are all of them usable for the same purposes, or should we prefer certain methods in certain cases? Learning more about the different evaluation methods and comparing them will help in getting a clearer picture.
The goal of the article is to clarify the differences between two evaluation methods [GSI – Green Space Intensity (according to Jombach, 2012: “… the GSI database contains values from 0 to 100 percent, representing a special mixture of green coverage and quality, called green space intensity.”) and BARC – Biological Activity Rate Calculation (ÖTM, 9/2007.)] suitable for urban green infrastructure analysis to see if any significant variance can be observed evaluating the same site by these methods. We
used the data emerged from Normalized Difference Vegetation Index (NDVI) evaluation method to determine GSI value of each sample plot.
Review of Literature
While there is only Hungarian literature about the description and calculation method of Biological Activity (BA), the satellite-based green surface mapping processes – NDVI calculations as well – have been being used for decades in international practice.
One of the very first comment and description of this method is in a periodical (1973 March – Sept.) report of Remote Sensing Center at Texas A&M University. The documentation discusses the calculation procedure in detail, which was called Vegetation Index (VI) calculation. The scientific name NDVI (Normalized Vegetation Index) came in use only few years later (Rouse et al., 1973).
The evaluation method has become more and more popular in vegetation monitoring procedures since the middle of 1990s. In 1994 Myneni and Williams investigated the influence of pixel heterogeneity, background, atmospheric and bidirectional effects on the relationship between fraction of photosynthetically active radiation absorbed by the photosynthesizing tissue in a canopy (FAPAR) and Normalized Difference Vegetation Index (NDVI) by using a three-dimensional model of radiation transfer (Myneni, 1994).
Three years later, Carlson and Riziley used a simple rudiative transfer model with vegetation, soil, and atmospheric components in their study to illustrate how the NDVl, Leaf Area Index (LAI), and fractional vegetation cover are dependent on each other (Carlson, 1997).
In 2005 a study was made, which reviewed the rapidly increasing use of the NDVI in recent ecological studies and outlined its possible key role in latter research of environmental change in an ecosystem context (Pettorelli et al., 2005).
In 2012 a detailed research was made in the United States, which dealt with the exploration of the applicability of Biophysical Composition Index (BCI) in various remotely sensed images at different spatial resolutions. The results indicate that, BCI has a closer relationship with impervious surface abundance than those of Normalized Difference Vegetation Index (NDVI), Normalized Difference Built-up Index (NDBI) and Normalized Difference Impervious Surface Index (NDISI). The study compared several recent evaluation methods in same aspect, which constitutes the value of it (Deng, 2012).
In Hungary, evaluation methods based on NDVI came into use in the last decade. As a result a supporting study was made in 2006 to create the Development Concept and Program of Green Space System in Budapest (Pro Verde!). According to the workgroup, to justify the recommendations of the program a complex green surface analysis is necessary, which shows processes and trends related to green surfaces in the last 15 years by objective Geographical Information System (GIS) methods. They made the analysis by comparing the changes in NDVI indices on several land-use units in Budapest between 1990 and 2005 (Gábor et al., 2006). It is important to be mentioned, that the study uses the expression ‘BA index’ for NDVI values.
In 2007 a regulation regarding the calculation method of BA on different surfaces has been introduced by the Hungarian Ministry of Governance and Urban Planning. The main goal of this regulation is to set up a control mechanism to control the modification of urban development plans regarding new developments. From that time on the domestic practice uses ‘BA rate’ expression in the legal regulation (ÖTM, 9/2007.).
In 2008 a detailed study was made regarding the analysis of green surface-covering in Budapest as a result of the research started in 2006. The base of the research was also the evaluation of satellite photos taken in 1990 and 2005 (Ongjerth, 2008).
In the last few years, the opportunities offered by NDVI evaluation method are more and more popular in the domestic scientific life. The introduction of BA evaluation method into the legal regulation offers a possibility to control to certain degree the urban development processes from ecological aspect.
Materials and Methods
The biological activity is the conditioning effect of vegetation-covered surfaces on the environment through different physical, physiological and biological processes. The Biological Activity Rate (BAR) represents the level of biological intensity (Jámbor- Szilágyi, 2006).
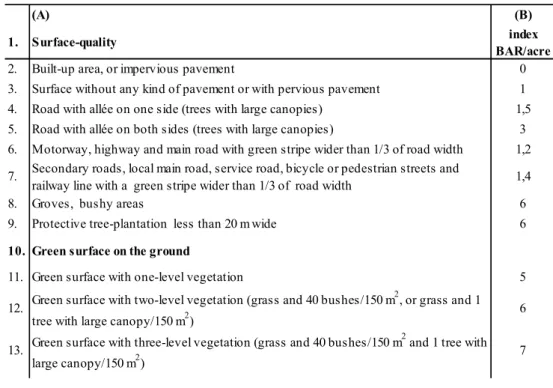
According to the BA regulation aforementioned, every kind of surface could be characterized by a BAR, which has to be calculated from the area’s size and a pre- determined BA rate/acre relating to the features of the area (ÖTM, 9/2007.). The regulation has two tables in its annex. The first includes the determined BA rates of several land-use units and the second shows the values to be used for BA rate calculations on different kind of surfaces (Table 1.). Each biologically active surface has significant effect on its environment. Closed and multi-level vegetation has significantly higher effect on its close environment than a paved surface, therefore it also has higher BA rate. From this point of view, this formula can be used well in valuating any kind of surface in ecological and/or environmental aspects.
Table 1. Pre-determined Biological Activity Rates of several surfaces (2. annex in ÖTM, 9/2007)
(A) (B)
1. Surface-quality index
BAR/acre
2. Built-up area, or impervious pavement 0
3. Surface without any kind of pavement or with pervious pavement 1
4. Road with allée on one side (trees with large canopies) 1,5
5. Road with allée on both sides (trees with large canopies) 3 6. Motorway, highway and main road with green stripe wider than 1/3 of road width 1,2 7. Secondary roads, local main road, service road, bicycle or pedestrian streets and
railway line with a green stripe wider than 1/3 of road width 1,4
8. Groves, bushy areas 6
9. Protective tree-plantation less than 20 m wide 6
10. Green surface on the ground
11. Green surface with one-level vegetation 5
12. Green surface with two-level vegetation (grass and 40 bushes/150 m2, or grass and 1 tree with large canopy/150 m2)
6
13. Green surface with three-level vegetation (grass and 40 bushes/150 m2 and 1 tree with large canopy/150 m2)
7
14. Green roof on built structure
15. Green roof with one-level vegetation, extensive green roof 2 16. Green roof with one-level vegetation, semi-intensive green roof 2,5 17. Green roof with two-level vegetation (grass and 40 bushes/150 m2, or grass and 1 tree
with large canopy/150 m2), intensive green roof
3
18. Green roof with three-level vegetation (grass and 40 bushes/150 m2 and 1 tree with large canopy/150 m2), intensive green roof
4
19. Plough land 3,2
20. Grassland, pasture 6
21. Orchard, vineyard, garden 5
22. Forest 9
23. Reed surface 8
24. Water surface 6
25. Open pit, quarry, regularly disturbed area, waste deposit 0,2
The NDVI is a simple numerical indicator, which has been being used by natural resource researches, forestry and agricultural for decades (Jombach, 2012). Its value is determined by the quotient of the difference and the amount of radiation intensity reflected by plants in Near-Infrared (NIR) (λ ~ 0,8 μm) and Visible Red (VIR) (λ ~ 0,6 μm) regions (Carlson, 1997).
NDVI = (NIR – VIR) /( NIR + VIR) (Eq.1)
Chlorophyll in plants is responsible for the light absorption and reflection in the visible and near-infrared regions (Eredics, 2007). Therefore the quantity and quality of chlorophyll production determines the Normalized Difference Vegetation Index, whose value is largely influenced by the healthiness of the vegetation and by the size of tree canopy. Therefore it is a suitable indicator for evaluating the physical condition of the vegetation in a certain area. The rate of the chlorophyll coverage can be estimated on satellite photos which by and large matches the vegetation (green) coverage of the area, thus irrespective of its thickness (Ongjerth, 2008).
NDVI takes on values between -1.0 and +1.0. The vegetation is very poor near the 0.0 values, between -1.0 and 0.0 there is no plant life (only impervious surfaces:
buildings, pavement or naked surface). Above 0.5 the vegetation is perfect (complex, prolific and rich) (Bakay, 2012).
These numbers are being utilized and processed by the Green Space Intensity (GSI) method. This method was born to could the existence and quality of regional and urban green spaces be revealed simply. It is based on the numbers of NDVI. The GSI percentages could be directly got from the NDVI indices by multiplying them by 200.
Every negative value has 0 % GSI and every value between 0,5 and 1 get 100 % GSI (Jombach, 2012). The distribution of the intermediate GSI percentages is demonstrated by the Table 2.
An area’s GSI is determined by averaging the GSI percentages of each pixel covering its whole surface.
Table 2. The correlation between GSI percentages and NDVI indices
NDVI GSI (% )
(-1) - 0 0
0 - 0,1 0,01 - 19,99 0,1 - 0,2 20 - 39,99 0,2 - 0,3 40 - 59,99 0,3 - 0,4 60 - 79,99 0,4 - 0,5 80 - 99,99
0,5 - 1 100
We also used these two evaluation methods to quantify the urban ecological significance of several areas in Budapest in this study. As mentioned before, both evaluation methods provide good opportunity to evaluate certain sites in ecological aspect, but their evaluation procedures are considerably different.
The GSI valuation is based on the physical features of the vegetation in contrast with the biological activity valuation, which can be determined by site analysis and by grouping the different surfaces into categories. We made a detailed analysis in order to compare the GSI and BA evaluation methods of eight sample plots with different characteristics. The main aims of this study are to analyze the applicability of these methods in urban ecological aspects, to reveal their strengths and weaknesses by comparing them and to determine their potential role in recent urban planning processes.
We chose eight urban parks as research sites. Significant attention was paid on their surface characteristics, so that the differences and similarities between GSI and BA evaluations could be analyzed and determined more easily. We could use satellite photos taken by Landsat 8 satellite in 2013 of the research areas to determine their NDVI and GSI value. Each pixel of the photos covers 30 x 30 m area. We made site analysis on each site and categorized the different surfaces - according to the second table in the official regulation of BA calculation. We had vector-graphical and pixel- based site plans as well as geodesic surveys about each area. Besides, we checked all the site plans in case of all areas and if it was necessary, we actualized and refined the data by complemented the survey plans manually during site visits in July 2014.
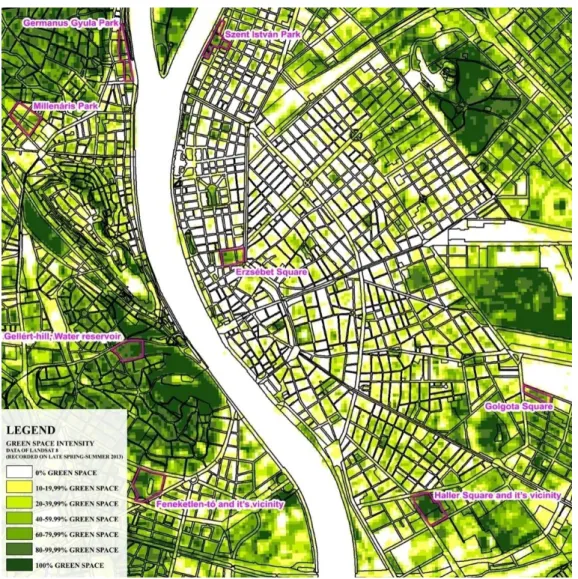
The GSI maps we used during the research are fitted onto vector graphic surveys.
The plot boundaries of each area are also represented on these vector graphic maps and they could be clearly observed on the Fig. 2. as well. We made the BA analyzes inside these boundaries and created the site maps by using the same vector graphic system.
Although the satellite photos used for NDVI analysis were taken in spring-summer 2013, there was no significant change on the areas which could affect the success of the analysis. Therefore we consider the influence effect of the occurring deviations negligible in point of this analysis. Due to continental climate in Hungary, the vegetation has the most active period in spring and summertime. Therefore the analyzed satellite photos were taken in these seasons.
Sample plots in Budapest
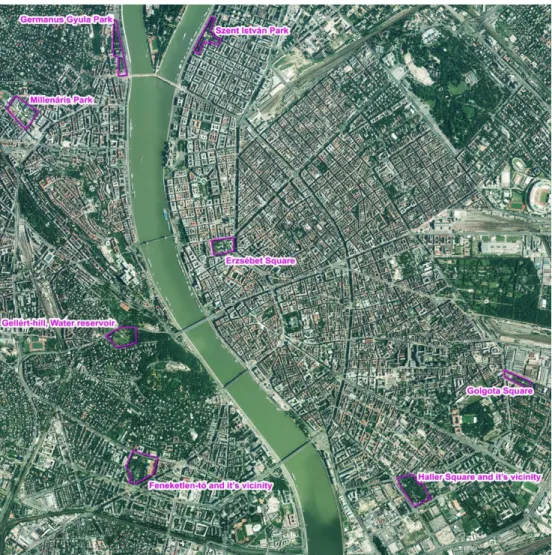
All of the researched areas are in Budapest, the capital city of Hungary. Their sizes vary from 2-3 to 6-8 acres. Four of the sites (Millenáris Park, Gellért Hill water reservoir, Germanus Gyula Park and Lake Feneketlen) are located in Buda, the other four (Erzsébet Square, Golgota Square, Haller Park and Szent István Park) are on the Pest side of the Danube river (Fig. 1.).
Figure 1. Location of analyzed and reference parks on the orthophoto of Budapest (2010)
The most important aspects of site analysis are the following: size and boundaries of the park, existence or lack of water features, the characteristics of their surfaces and the complexity of vegetation. All kind of surfaces had to be categorized according to the 2nd table in the appendix of the decree about the biological activity calculation (ÖTM, 9/2007.). The values and rates of different ecological evaluation methods referring to each plot are summarized in tables.
According to the regulation of BA calculation method, beside the built-in surfaces two kinds of pavement quality was differentiated: the solid pavements with waterproof surface (e.g. asphalt, rubber) having 0 BAR/acre and the pervious pavements with pervious and diffuse surface (e.g. rubble pavement, sand) having 1 BAR/acre. The green surfaces which are directly connected to the ground could be divided into several
categories depending on the structure of their vegetation. The one-level vegetation has 5, the two-level has 6 and the three-level vegetation which consists of trees, shrubs and grass has 7 BAR/acre. There is one more category for groves having the same BAR/acre value (6) as the two-level vegetation (ÖTM, 9/2007.).
In case of green roofs, the following BAR/acre values are determined depending on the number of levels the vegetation has: one-level has 2,5, two-level has 3 and the three- level vegetation on green roofs has 4 BAR/acre (ÖTM, 9/2007.).
Although water surfaces are disregarded by NDVI, they obviously have positive effect on the environment. Therefore they are being considered with significant 6 BAR/acre in the biological activity calculations (ÖTM, 9/2007.).
By using the data got from the vector graphic maps, we created tables for each site which include the sizes of the surveyed surfaces. We calculated the BA rates of each surface and determined the Total Biological Activity Rate (TBAR) of each sample area, by summarizing the BA rate of each surface. We determined the Total Area (TA) of each sample plot by measuring the regions inside their boundaries. The tables are also representing the area which was got by summarizing the pixels of NDVI maps on each plot. In addition we represented the Green Space Index (GSIN) which shows the percentage of the green surfaces related to the TA, and the GSI.
Figure 2. Intensity of green surface in Budapest (late spring-summer 2013)
Erzsébet Square and Park
Erzsébet Square is located in the heart of the city at a downtown location. The eastern part of the 3,4 acres size park was a former bus terminal; the western part of it was a formal park earlier with a large decorative fountain in the middle. The two parts are separated by the building of a previous bus terminal, now a historical monument used as an exhibition area. The eastern part of the site is roof garden with 2 m soil cover and with a glass-bottom pool in the center. In this part of the park there is maximum two-level vegetation, while on the other side of the park mostly two- and three-level vegetation can be found. Besides, the trees on the western part are much older (mostly middle-aged) and taller than on the east, they also have larger canopies whereby they have positive effect on the park’s climate.
The duality of the park could be obviously noticed during the site visits. The eastern part of the park has got large scale of paved and built-up surfaces which could not be reduced by the existing green roof with one- and two-level vegetation even in visually aspect. Due to its central location, the park is extremely popular, which was noticeable even in the western part. To serve the needs of the visitors lots of pavements, built structures and equipments could be found here (Table 3.).
Table 3. Biological activity and green surface calculation of Erzsébet Square and Park, Budapest
34 200 m2 33 500 m2
Surface BAR
Built-in area 1 235,1 m2 3,69 % 0,00
Solid pavement 15 010,4 m2 44,81 % 0,00
Pervious pavement 2 722,2 m2 8,13 % 0,27
Water surface 630,3 m2 1,88 % 0,38
Green surface with one-level
vegetation 3 113,0 m2 9,29 % 1,56
Green surface with two-level
vegetation 6 516,2 m2 19,45 % 3,91
Green surface with three-level
vegetation 712,2 m2 2,13 % 0,50
Half-intensive green roof with
one-level vegetation 2 005,8 m2 5,99 % 0,50 Intensive green roof with two-
level vegetation 1 554,8 m2 4,64 % 0,47
41,50 % 57,45 % Total Area (TA) determined by plot boundaries:
7,58
Green Space Intensity (GSI):
Green Surface Index (GSIN):
Total Biological Activity Rate (TBAR):
5 6 7 BAR /acre 0 0 1 6 Area
Surface rate (based on
the TA) Total area calculated from NDVI maps:
2,5 3
Lake Feneketlen and its vicinity
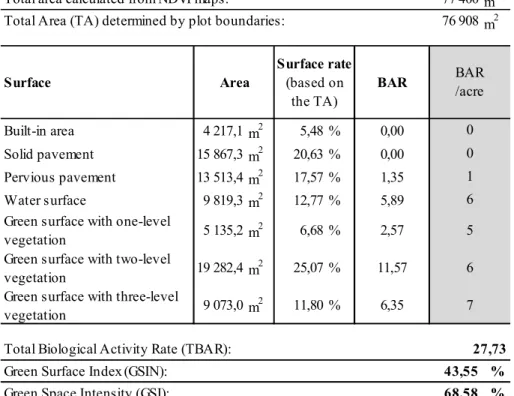
Lake Feneketlen (“Bottomless Lake”) and its vicinity can be found in the 11th district in a residential area. The 7,7-acre site is around a former clay pit, which had to be closed down quite urgently, due to subsurface waters which broke in rather unexpectedly in the 1930s. In the place of the former pit a 1 acre size natural lake was created, which is approx. 5 m deep. The most significant built structure in the park is an open-air theater, which is out of use recently. There is a big playground in the northwestern corner of the site. The park has never been renewed, but many trees have been planted here since the 1960s. The vegetation is rather overgrown today. About one third of the park’s area is covered by solid and pervious pavement and one fourth is covered by two-level vegetation (mostly by trees and grass under it) (Table 4.).
Table 4. Biological activity and green surface calculation of Lake Feneketlen and its vicinity, Budapest
77 400 m2 76 908 m2
Surface BAR
Built-in area 4 217,1 m2 5,48 % 0,00
Solid pavement 15 867,3 m2 20,63 % 0,00
Pervious pavement 13 513,4 m2 17,57 % 1,35
Water surface 9 819,3 m2 12,77 % 5,89
Green surface with one-level
vegetation 5 135,2 m2 6,68 % 2,57
Green surface with two-level
vegetation 19 282,4 m2 25,07 % 11,57
Green surface with three-level
vegetation 9 073,0 m2 11,80 % 6,35
43,55 % 68,58 % Total area calculated from NDVI maps:
Total Area (TA) determined by plot boundaries:
Surface rate (based on
the TA)
Area BAR
/acre 0 0 1 6 5 6 7
27,73 Total Biological Activity Rate (TBAR):
Green Surface Index (GSIN):
Green Space Intensity (GSI):
The site has an important role in the green surface provision of the district due to the large percentage of pervious pavements and to old and multi-level vegetation surfaces.
There is a huge water surface in the middle of the site which is not only popular among the citizens but influences significantly the climatic features of the park by its conditioning effect (Oláh, 2012). This surface was not considered by GSI analysis in absence of chlorophyll.
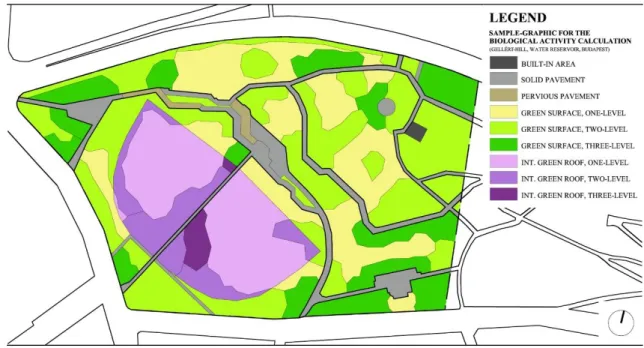
Water reservoir on Gellért Hill
The 4,7-acre park on the northern slopes of Gellért Hill was built around 1975 as a compromise. Due to the huge housing estate developments in the southern part of Buda
at that time, the need for potable water grew tremendously, which could be fulfilled only by building a new water reservoir. From technical point it had an ideal location at the top of Gellért Hill. On the other hand it is visually an extremely sensitive location in the city, and a great tourist attraction with a fantastic view. As a compromise an underground water reservoir was built, very unusual at that time with a public park on the top of it. The soil cover above the tanks (each 40 000 m3) varies between 0,6 to 1 m.
Unique retaining wall system made of concrete, reminiscent of old fortification and steep slopes span the elevation difference. In the eastern part of the site, where no big scale earth work was done, some old honey-locust (Robinia sp.) trees from the time before the construction can be still found. Most of the woody vegetation was planted at the time of the construction and the plants are located to strengthen the grading concept, so more or less along contour lines (Fig. 3.).
Figure 3. Site map for biological activity calculation (water reservoir on Gellért Hill, Budapest)
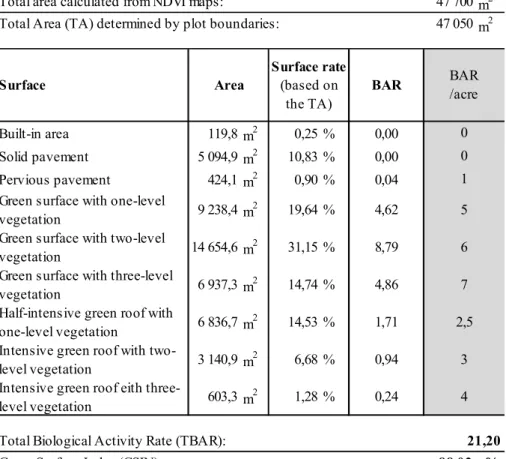
Large part of the area is covered by vegetation. The paved walkways take up about 12% of the total area which is one of the lowest percentages among our sample areas. It is important to be mentioned, that green surfaces above the water tanks must be classified in the green roof categories, therefore their BAR values are lower than the other green surfaces (Table 5.).
Germanus Gyula Park
Germanus Gyula Park (approx. 4,1 acres) is located close to the Danube just north from Margaret Bridge on the Buda side. It is a narrow site with main traffic artillery on the eastern border. The strange feature about the park is that even if the Danube is very close, there is no visual or mental connection to the river due to the extremely intensive traffic line dividing them. On the other side the park is bordered by a hospital building and by an indoor spa. The park is used mainly by dog owners, though there is also a small playground. Huge sycamore (Platanus sp.) trees make the park really shady. It
has not been renewed since 1958 except the area in front of a hospital, which was designed in 1980 with a small water feature, which does not function any more.
Table 5. Biological activity and green surface calculation of water reservoir on Gellért Hill, Budapest
47 700 m2 47 050 m2
Surface BAR
Built-in area 119,8 m2 0,25 % 0,00
Solid pavement 5 094,9 m2 10,83 % 0,00
Pervious pavement 424,1 m2 0,90 % 0,04
Green surface with one-level
vegetation 9 238,4 m2 19,64 % 4,62
Green surface with two-level
vegetation 14 654,6 m2 31,15 % 8,79
Green surface with three-level
vegetation 6 937,3 m2 14,74 % 4,86
Half-intensive green roof with
one-level vegetation 6 836,7 m2 14,53 % 1,71 Intensive green roof with two-
level vegetation 3 140,9 m2 6,68 % 0,94
Intensive green roof eith three-
level vegetation 603,3 m2 1,28 % 0,24
88,02 % 92,55 %
2,5 3 4 Total area calculated from NDVI maps:
Total Area (TA) determined by plot boundaries:
Surface rate (based on
the TA)
Area BAR
/acre 0 0 1 5 6 7
21,20 Total Biological Activity Rate (TBAR):
Green Surface Index (GSIN):
Green Space Intensity (GSI):
About 46% of the park is covered by pavement which includes walkways of several length and width, traffic roads and leisure surfaces (Table 6.). Therefore the green surfaces with mostly two-level vegetation are extremely fragmented, with old and tall trees having huge canopy.
Golgota Square
Golgota Square Park is a 2,3-acre local park in the southeastern side of the 8th district. In 1966 a playground and a football field were built on the western part of it. In 1999 a gas station was placed in the corner of the park reducing its size and causing serious environmental damages. Most of the solid (impervious) pavement can be found around this gas station, only small size solid paved areas are next to the playground and football fields.
In the park there are green surfaces mostly with two-level vegetation (approx. 15 000 m2) except in the vicinity of the petrol station. These surfaces are fragmented by several walkways with pervious pavements. Tall trees with huge canopy stand around the
leisure part of the park but unfortunately lots of them are in very poor condition (Table 7.).
Table 6. Biological activity and green surface calculation of Germanus Gyula Park, Budapest
41 400 m2 41 425 m2
Surface BAR
Built-in area 138,6 m2 0,33 % 0,00
Solid pavement 17 639,3 m2 42,58 % 0,00
Pervious pavement 1 617,6 m2 3,90 % 0,16
Water surface 143,4 m2 0,35 % 0,09
Green surface with one-level
vegetation 7 172,3 m2 17,31 % 3,59
Green surface with two-level
vegetation 10 143,0 m2 24,49 % 6,09
Green surface with three-level
vegetation 4 570,8 m2 11,03 % 3,20
52,83 % 55,02 % Total area calculated from NDVI maps:
Total Area (TA) determined by plot boundaries:
Surface rate (based on
the TA)
Area BAR
/acre 0 0 1 6 5 6 7
13,12 Total Biological Activity Rate (TBAR):
Green Surface Index (GSIN):
Green Space Intensity (GSI):
Table 7. Biological activity and green surface calculation of Golgota Square, Budapest 22 500 m2 22 950 m2
Surface BAR
Built-in area 263,5 m2 1,15 % 0,00
Solid pavement 2 209,0 m2 9,63 % 0,00
Pervious pavement 3 637,3 m2 15,85 % 0,36 Green surface with one-level
vegetation 1 444,5 m2 6,29 % 0,72
Green surface with two-level
vegetation 15 395,7 m2 67,08 % 9,24
73,38 % 59,20 % 10,32 Total area calculated from NDVI maps:
Total Area (TA) determined by plot boundaries:
Total Biological Activity Rate (TBAR):
Green Surface Index (GSIN):
Surface rate (based on
the TA)
Green Space Intensity (GSI):
Area BAR
/acre 0 0 1 5 6
Haller Square and its vicinity
The 6,5-acre Haller Square in the outer part of the 9th district actually did not exist till the beginning of the 1960s. At the time a typical district park was created here. In the southern part of the park there are some residential buildings, belonging to a housing estate built also in the 1960s. Nowadays different sport fields, a playground, a dog runner and some elements for roller skaters can be found in the site. There is well developed vegetation with large shrubs and significant size of trees.
Just by looking at the data it is obvious, that the park has got large scale of green surface. (approx. 70%) The pervious pavements with good water absorbing capacity and the groves including tall trees with closed canopy are very important features regarding total biological activity rate (TBAR) of the site (Table 8.).
Table 8. Biological activity and green surface calculation of Haller Square and its vicinity, Budapest
67 500 m2 65 000 m2
Surface BAR
Built-in area 4 057,0 m2 6,24 % 0,00
Solid pavement 9 772,1 m2 15,03 % 0,00
Pervious pavement 5 269,8 m2 8,11 % 0,53
Water surface 0,0 m2 0,00 % 0,00
Green surface with one-level
vegetation 6 362,9 m2 9,79 % 3,18
Green surface with two-level
vegetation 28 257,7 m2 43,47 % 16,95
Green surface with three-level
vegetation 4 268,1 m2 6,57 % 2,99
Grove, copse 7 012,4 m2 10,79 % 4,21
70,62 % 88,69 %
BAR /acre 0 0 1 6 5 6 7
27,86 Total Biological Activity Rate (TBAR):
Green Surface Index (GSIN):
Green Space Intensity (GSI):
Total Area (TA) determined by plot boundaries:
6 Surface rate
(based on the TA) Area
Total area calculated from NDVI maps:
Millenáris Park
Millenáris Park is a typical brown-field development in the heart of Buda. The 5,4- acre site used to be an electrical machine factory, causing a severe soil and groundwater contamination. Before the construction works of a cultural and entertainment center started in 2000, the soil had to be removed 1-1,5 m deep. This made it possible to create extended water surfaces in the park. Some of the old factory building were turned into exhibition halls or were used for other cultural purposes. There is a popular playground in one corner of the site. Recently a community garden was placed in the park. Due to the industrial past and the extended earthwork all the trees were planted at the same time of the constructions, so they are approx. 15 years old by now.
The park as a popular place and with multi-functional buildings has small scale (only 34%) of green surface coverage. The water surface in the middle is giving an extra 5 % to the conditioning surfaces. The vegetation of the park is relatively young; therefore it has not created yet a closed, multi-level green surface. The TBAR is being decreased by the underground garages serving the two office buildings in the southwestern part (Table 9.).
Table 9. Biological activity and green surface calculation of Millenáris Park, Budapest 55 800 m2 53 930 m2
Surface BAR
Built-in area 18 172,1 m2 33,70 % 0,00
Solid pavement 10 776,4 m2 19,98 % 0,00
Pervious pavement 4 007,0 m2 7,43 % 0,40
Water surface 2 594,6 m2 4,81 % 1,56
Green surface with one-level
vegetation 5 443,3 m2 10,09 % 2,72
Green surface with two-level
vegetation 7 222,6 m2 13,39 % 4,33
Green surface with three-level
vegetation 1 672,7 m2 3,10 % 1,17
Half-intensive green roof with
one-level vegetation 2 879,6 m2 5,34 % 0,72 Intensive green roof with two-
level vegetation 1 161,7 m2 2,15 % 0,35
34,08 % 40,61 %
BAR /acre 0 0 1 6 5 6 7
11,25 Total Biological Activity Rate (TBAR):
Green Surface Index (GSIN):
Green Space Intensity (GSI):
Total Area (TA) determined by plot boundaries:
2,5 3 Surface rate
(based on the TA) Area
Total area calculated from NDVI maps:
Szent István Park
Szent István Park is located next to the Danube on the Pest side opposite to Margaret Island. This 3,4-acre park was built in the 1930s, as part of an extensive residential development in the neighborhood. The ’T’ shaped site determines the unique form of the park with two symmetrical green surfaces at both sides and a bigger paved area in the middle. The green „wings” are mostly for strolling or jogging, most of the activities are concentrated in the middle, like a small sport field, pergolas, a 2000 m2 pool, fountains. The playground is separated from the rest of the park by a street. There are impressive alleys in the park; some of them are even protected.
Beside the low amount of built-up areas, large scale (approx. 73%) of the paved surfaces are pervious pavement, only the pedestrian, the traffic areas and the sport field have solid (e.g. asphalt and stone) pavements. The green surfaces are covered mostly by two-level vegetation, only a small part of the area near the paved leisure surface in the middle has three-level structure with approx. 600 m2. (Fig. 4., Table 10.)
Figure 4. Site map for biological activity calculation of Szent István Park, Budapest
Table 10. Biological activity and green surface calculation of Szent István Park, Budapest 33 300 m2
34 025 m2
Surface BAR
Built-in area 34,6 m2 0,10 % 0,00
Solid pavement 4 162,8 m2 12,23 % 0,00
Pervious pavement 11 513,2 m2 33,84 % 1,15
Water surface 585,0 m2 1,72 % 0,35
Green surface with one-level
vegetation 5 571,8 m2 16,38 % 2,79
Green surface with two-level
vegetation 11 548,9 m2 33,94 % 6,93
Green surface with three-level
vegetation 608,7 m2 1,79 % 0,43
52,11 % 69,08 %
BAR /acre 0 0 1 6 5 6 7
Green Space Intensity (GSI):
11,64 Green Surface Index (GSIN):
Total area calculated from NDVI maps:
Total Area (TA) determined by plot boundaries:
Total Biological Activity Rate (TBAR):
Surface rate (based on
the TA) Area
Results
We summarized the data of the site analysis in a summary table and made a summary diagram for the visual representation. The GSI and the TBAR indicators cannot be compared with each other directly because of their different units. The GSI applies to the ratio of green surfaces based on the whole size of the plot and the TBAR is the sum
of the BA rates of each surface of the area. (GSI index is a ratio, while TBAR index is just a value depending on the size of the analyzed surface.) A new index had to be introduced in order to make the GSI and TBAR values comparable. This is Maximum Biological Activity Rate (MBAR) which shows the activity rate that can be reached in the case of maximum (100%) GSI. We supposed that the maximum GSI can be reached in case of three-level vegetation which situation also corresponds with the maximum TBAR affordable on these urban located areas. The analysis and comparison of the graphic maps, based on site visits and the satellite pictures (taken by the Landsat 8 satellite) verified our supposal (Fig. 5.).
BA map of Feneketlen-Lake and its vicinity
Joint short-wave infrared and ortho map of Feneketlen-Lake and its vicinity
NDVI map of Feneketlen-Lake and its vicinity
BA map of Millenáris Park Joint short-wave infrared and ortho map of Millenáris Park
NDVI map of Millenáris Park
BA map of Haller Square Joint short-wave infrared and ortho map of Haller Square
NDVI map of Haller Square
Figure 5. Comparison of Biological Activity, short-wave infrared and NDVI maps
Where the pixels on the NDVI pictures are dark green, the vegetation structure is mostly two- or three-level on each plot. Therefore it is proposed to determine the
MBAR on each sites supposed that there are green surfaces with three-level vegetation.
We used the following formula:
MBAR = 7 * TA (Eq.2)
where MBAR means the Maximum Biological Activity Rate, no. 7 is the Biological Activity Rate (BAR) of green surface with three-level vegetation and TA means the Total Area of the site. Finally we determined the Total Biological Activity Index (TBAI) of each areas by using the following formula:
TBAI = TBAR / MBAR * 100 (Eq.3)
[Total Biological Activity Rate (TBAR) of each plot is calculated, by summarizing the BA rates of each surface.]
In Table 11. TBAI and GSI are based on common benchmark, thus they can be compared with each other. We calculated the Green Surface Index (GSIN) of each site as well as their rank (R) among the sample plots according to different rates (TBAR, TBAI, GSI, GSIN) for further analyses.
Table 11. Summary table of TBAR, TBAI, GSI and GSIN rates
Sample-area TBAR (rate)
TBAI*
(% ) P GSI
(% ) P GSIN
(% ) P
Erzsébet Square and Park
7,58 32,34 7 57,45 6 41,50 7
Feneketlen-Lake and
its vicinity 27,73 51,51 4 68,58 4 43,55 6
water reservoir on
Gellért-Hill 21,20 64,38 1 92,55 1 88,02 1
Germanus Gyula Park 13,12 45,24 6 55,02 7 52,83 4
Golgota Square 10,32 64,26 2 59,20 5 73,38 2
Haller Square 27,86 61,23 3 88,69 2 70,62 3
Millenáris Park 11,25 29,81 8 40,61 8 34,08 8
Szent István Park 11,64 48,89 5 69,08 3 52,11 5
* According to Eq.3
As it can be noticed from the summary diagram, there are significant differences between the TBAI and GSI values in cases, like at water reservoir on Gellért Hill (Fig.
6.). The main reason of it is particularly the difference between the evaluation processes. Based on the comparison of data in the summarizing table we can make certain statements regarding the different evaluation methods.
The calculations of the two methods using different evaluation processes and the rates associated to them as reference points gave similar results regarding the hierarchy (position) of the analyzed plots.
The water reservoir on Gellért Hill is a significant area, which reached the best rank (R = 1) according to all three methods. The reason of this is obvious just by looking at the survey map: This area has the lowest built-up and paved surface-rate (11,98%). The Millenáris Park reached the worst rank (R = 8) according to every aspects. The reason
of this – in contrast to the water reservoir on Gellért Hill – the high built-up (33,7%) and impervious pavement (27,51%) surface-rate.
Figure 6. Summary diagram of TBAI, GSI and GSIN rates
In the case of Golgota Square, the TBAI (64,26%) is much higher than the GSI (59,20%). A reason could be that the structure of the vegetation is more significant for the BA calculation, then its condition. In contrast to this, in the case of GSI rate the condition of vegetation is concluded from the chlorophyll amount. Another reason of the difference comes from the resolution of the satellite photos. The photos which are available for us, are not detailed enough to get exact view of the GSI data of each areas.
This is true especially in the case of long and narrow sites, where 80-90% of a pixel is on the edge of the inner and outer part of the area. In this case the chlorophyll index of the pixel is determined by rate of the inner and outer areas’ chlorophyll indices like on Golgota Square.
The GSI (92,55%) and GSIN (88,02%) values of the water reservoir on Gellért Hill are very close to the 100% and to each other. In contrast to this, the TBAI (64,38%) is pretty low, which could be explained by the high green-roof rate (22,49%). These green surfaces cannot participate in to the water circulation of the natural areas in the city;
therefore they have lower BAR value, than the green surfaces on the ground.
We have to highlight the Lake Feneketlen and its vicinity, because only this is the only site having higher TBAI (51,51%) than GSIN (43,55%). The reason is, that the site has a huge water surface (approx. 9800 m2 – 12,77%) in the middle, which is noted with very high BAR/acre value (6) during the calculations. This case is a good example for showing the defect of the BA calculation process: The formula gives a BAR/acre value for water surfaces, but does not deal with the way these elements were created, whether they are natural lakes or just ornamental pools, which make a huge difference in urban ecology.
In five out of the eight analyzed sites, there is a significant difference (14,18% - 25,03%) between the GSI and the GSIN. Based on these differences it can be stated that NDVI does not give real picture about the green surface rates of any areas.
Summary
This study deals with the comparison of the GSI and BA evaluation methods in urban ecology aspects. The comparison process was based on the analysis of eight sample plots in Budapest, whereby we could enlighten the strengths and weaknesses of the two methods.
The GSI evaluation method is based on high resolution satellite photos and analyzes the physical features of the vegetation, which helps to evaluate the quality of the vegetation quite precisely:
It can judge the condition of the vegetation through the quantity of chlorophyll.
Although the GSI value is determined by the chlorophyll quantity, it is suitable to estimate the vegetation structure (one-, two- or three-level) as well.
Based on our analysis it is evident, that many factors influence its accuracy, and the following mistakes cannot be eliminated:
The tree-canopies covering paved surfaces deform the result.
Except vegetation it cannot differentiate the ecological efficiency of different surfaces.
In some cases it gives an extreme (usually extremely high) green surface rate of the sites.
The BA evaluation method is based on pre-determined values, and it can demonstrate the ecological effects of several surfaces. But at the same time there are also many factors which cannot be eliminated by the method:
Although the method considers the absorbing ability of the pavements, it does not calculate its capacity.
Although water surfaces as biologically active surfaces are taken into account, but the method does not deal with the character of the water feature (natural or man-made) so important from urban ecological point.
It is based on flat areas: It disregards the overlapping surfaces, for example the size of overlapping tree canopies.
The evaluation procedure is based on pre-determined rates. These rates are fixed; therefore they do not refer to the present biological state of vegetation.
According to the results it can be stated that neither GSI nor BA evaluation methods could be used solely for making a detailed ecological evaluation on urban areas. Both methods have strengths as well as weaknesses.
The BA evaluation method is dealing not only with the vegetation and its structure but other surfaces (e.g. water surfaces and pervious pavements) which have ecological effect on urban environment as well. The GSI method, due to NDVI indices is more sensitive for the actual physical condition of surfaces. None of existing empiric evaluation method could match its accuracy.
The recent technology provides opportunity to make several different evaluations related to urban ecological aspect. The Leaf Area Index (LAI) mentioned in Review chapter, is the total one-sided area of leaf tissue per unit ground surface area. It is a key parameter in ecophysiology, especially for scaling up the gas exchange from leaf to
canopy level. It characterizes the canopy-atmosphere interface, where most of the energy fluxes exchange (J. J. Bréda, 2003). The evapotranspiration ability of different plant surfaces and their effect on microclimate could be measured by LAI.
This study, as well as the review chapter reveal, that ecological evaluation of urban areas is getting more and more important especially in recent urban development processes. The growing popularity of BCI and NDISI evaluation methods used in the United States is good example to show this tendencies. It is high time to overview the domestic BA evaluation method, to which the detailed analyzes performed in the study on different sample sites with different characteristics could be a potential base. Due to the differences of urban surfaces it is neccessary to know and create methodologies for evaluations, which are sensitive for their physical and biological features. By summarizing the strengths of these procedures, a more advanced evaluation method can be worked out, which gives a more detailed picture about the ecological value of different urban areas.
Besides the methods which measure the ecological value of a site by using remote sensing we should not underestimate the importance of field study. The database provided by orthophotos or satellite images cannot give a comprehensive view of the ecological diversity of a certain site. However the diversity of the flora and the fauna cannot be “measured” by the above mentioned methods, they can be useful indicating those areas which are likely to be ecologically complex and rich enough, to be studied more detailed on the field.
The „green city password” as synonym of livable and pleasant urban environment pops-up frequently in urban development programs all over Europe. The landscape, the green and open spaces play a significant role in these urban development or urban rehabilitation projects (Pro Verde!, 2006). One of the most important aspects in recent urban ecological design processes is the evaluation of existing green surfaces, parks, squares and urban neighborhoods in environmental aspects. Due to this demand, more and more evaluation methods are coming up (e.g. Leadership in Energy and Environmental Design – LEED which is a green-building certification program and based on an ecological/green index calculated during the evaluation process of any kind of project; or the Green City Idea which primarily focuses on open space projects and helps cities restoring and use their potential and opportunities instead of taking further territories away from nature and agriculture); some of them are based on quantity, others on quality aspects. The complexity of the growing cities’ structures and the continuous development of information technology strongly require the common usage of both aspects in any evaluation methods.
Acknowledgements. We thank Sándor Jombach for technical assistance. The short-wave infrared photos, NDVI maps and GSI values were provided by the Department of Landscape Planning and Regional Development, Corvinus University of Budapest.
REFERENCES
[1] Bakay, E. (2012): The role of housing estates’ green surfaces in forming the city climate of Budapest. Applied Ecology and Environmental Research 10(1): 1-16.
[2] Carlson, Toby N. – Ripley, David A. (1997): On the relation between NDVI, fractional vegetation cover, and leaf area index. Remote Sensing of Environment 62(3), pp. 241-252
[3] Deng, Chengbin – Wu, Changshan (2012): BCI: A biophysical composition index for remote sensing of urban environments. Remote Sensing of Environment 127:247–259.
[4] Gábor, P. – Jombach, S. – Ongjerth, R. (2006): A biológiai aktivitás változása Budapesten és a Budapesti Agglomerációban 1990-2005 között. 4D: Tájépítészeti és Kertművészeti Folyóirat 5:21.
[5] J. J. Bréda, Nathalie (2003): Ground-based measurements of leaf area index: a review of methods, instruments and current controversies. Journal of Experimental Botany 54(392):
2403-2417
[6] Jámbor, I. – Szilágyi, K. (2006): Green field development in the context of biological activity the anatomy of a new paragraph in the hungarian building law. 4D Tájépítészeti és Kertművészeti Folyóirat 1:44-47.
[7] Jombach, S. (2012): Térségi vagy települési szintű zöldfelület-intenzitás távérzékelési elemzésének módszere. 4D Tájépítészeti és Kertművészeti Folyóirat Különszám, p. 238.
[8] Myneni, R. B. – Williams, D. L. (1994): On the Relationship between FAPAR and NDVI. Remote Sensing of Environment 49:200-211.
[9] Ongjerth, R. (2008): Budapest zöldfelületi borítottságának vizsgálata. Falu-Város-Régió 2008/1., p. 28.
[10] Pettorelli, Nathalie – Vik, Jon Olav – Mysterud, Atle – Gaillard, Jean-Michel – Tucker, Compton J. – Stenseth, Nils Chr. (2005): Using the satellite-derived NDVI to assess ecological responses to environmental change. TRENDS in Ecology and Evolution 20(9):503-510.
[11] Rouse, John W., Jr. – Haas, R. H. – Deering, D. W. – Schell, J. A. (1973): Monitoring the vernal advancement and retrogradiation (green wave effect) of natural vegetation. Perf.
Org. Report No. RSC 1978-1, Remote Sensing Center, Texas A&M University, College Station pp. 75-76.
OTHER RESOURCES
[12] Eredics, A. (2007): Planning and development of Vegetations Indexmeter (NDVI).
Nyugat-Magyarországi Egyetem Erdőmérnöki Kar, Sopron
[13] Oláh, A. B. (2012): A városi beépítettség és a felszíntípusok hatása a kisugárzási hőmérsékletre, Budapesti Corvinus Egyetem – Tájépítészeti és Tájökológiai Doktori Iskola, Budapest, p. 69.
[14] ÖTM (2007): 9/2007. (IV. 3.) ÖTM rendelet a területek biológiai aktivitásértékének számításáról (Hungarian Ministry of Governance and Urban Planning - regulation about the calculation method of Biological Activity (BA) on several surfaces)
[15] Pro Verde! (2006): Budapest Zöldfelületi-rendszerének Fejlesztési Koncepciója és Programja (Development Concept and Program of Green Space System in Budapest) p. 5.