Vladimir Markovic´1 •Imre Nagy1,2•Andras Sik3• Kinga Perge3•Peter Laszlo3•Maria Papathoma-Ko¨hle4• Catrin Promper4•Thomas Glade4
Received: 27 April 2015 / Accepted: 17 September 2015 Springer Science+Business Media Dordrecht 2015
Abstract Climate changes alter the frequency and magnitude of a range of physical processes that often have negative consequences on life and property. Decision makers, local authorities and other end users are in need of tools and methodologies for assessing the risk of natural hazards in order to be able to design strategies for reducing it. The SEERISK project is an EU project that aims at the harmonization of risk assessment methodologies in southeast Europe. For this reason, a common risk assessment method- ology has been developed and was applied in six case study areas. One of them is Kanjizˇa municipality in Serbia. Major environmental concerns in Kanjizˇa municipality include the occurrence of drought and drought-related wildfires. Between 2001 and 2012, 12 drought periods were registered, and between 2007 and 2012, 210 wildfire incidents were recorded.
The direct and indirect estimated damage of these events exceeded 200 million Euros.
Apart from the monetary loss related to these incidents, there were one victim and one injured person related to a wildfire event in this period. This study demonstrates an application of the SEERISK methodology for drought and drought-related wildfire risk assessment. The results show that more than 80 % of the area under study belongs to the very high and high-risk categories. The SEERISK methodology and its application provide a useful tool for wildfire risk assessment. Given the high priority on protecting human life, crops and environment, the methodology we present here could have wide application across Serbia as well as in other countries facing similar hazards.
& Vladimir Markovic´
vladimir.markovic@dgt.uns.ac.rs
1 Department of Geography, Tourism and Hotel management, Faculty of Science, University of Novi Sad, Trg Dositeja Obradovic´a 3, Novi Sad 21000, Serbia
2 Department of Regional and Environmental Studies, Kaposvar University, Guba Sandor u. 40, Kaposvar 7400, Hungary
3 Ministry of Interior, National Directorate General for Disaster Management, Mogyoro´di Street 43, Budapest 1149, Hungary
4 Department of Geography and Regional Research, University of Vienna, Universitaetsstrasse 7, 1010 Vienna, Austria
Keywords Risk assessmentRisk mappingDroughtWildfiresGISKanjizˇa (Serbia)
1 Introduction
There is no universal definition for drought due to differences in hydrometeorological variables and socioeconomic factors, or to the stochastic nature of water demands in various areas. Belal et al. (2014) distinguish the drought definitions in the two categories:
conceptual and operational, and list them. A broad definition of drought according to UNISDR (2009) is ‘‘a deficiency of precipitation over an extended period of time, usually a season or more, which results in a water shortage for some activity, groups or environ- mental sectors.’’ Droughts are classified in the following types: meteorological, agricul- tural, hydrological and socioeconomic (UNISDR2009). In the present paper, the focus is on agricultural droughts.
Drought risk assessment involves the analysis of the drought hazard and the vulnera- bility of exposed elements at risk and provides information on the exposed population property, services and livelihoods (UNISDR2009). However, drought risk assessment is a challenging task and a complex process that includes many influential factors (Belal et al.
2014). Drought risk analysis is a suitable approach in order to design ex ante measure able to anticipate effects of drought on agricultural production (Hao et al.2012).
As far as droughts are concerned according to the IPCC (2012, 13) SREX report:
‘‘There is a medium confidence that droughts will intensify in the twenty-first century in some seasons and areas due to reduced precipitation and/or increased evapotranspiration.’’
However, the confidence is ‘‘medium’’ and not ‘‘high’’ due to definitional issues, lack of data and inability to include all the factors that influence droughts (IPCC2012). Climate change predictions suggest that wildfires may become more frequent and more intense with global climate change (Prior and Eriksen 2013; Westerling et al. 2006) and became emphasized around the world constantly (Liu et al. 2012). The higher temperatures recorded globally might affect directly the population and the agriculture, but they may also cause secondary effects that have also catastrophic consequences for the environment and the communities such as wildfires. Wildfires present a particular challenge for nature conservation because they are temporally and spatially highly variable (McKenzie et al.
2004). Prolonged drought combined with extreme weather conditions such as high air temperature, wind and low relative humidity often leads to the occurrence of wildfires (Moritz 2003; McKenzie et al. 2004; Keeley2004) and can have devastating impact on regional agriculture, water resources and the environment (Sheffield et al.2012; Scott et al.
2012). Drought indices, but also fuel in vegetation (Gibbons et al.2012), are one of the long-term factors that intensify the occurrence of wildfires through the year (Wotton and Flannigan1993; Bradstock et al.2009) and can contribute to the initiation and spread of severe wildfires (Yongqiang et al.2010). Suburban communities in fire-prone regions are at increasing risk from wildfires due to population growth and climate change (Bradstock et al.2009; Gibbons et al.2012). Large wildfires can have important environmental, social and economic consequences such as death and injuries, population mobility, destruction of buildings, crops and infrastructure (Keeley and Fotheringham2001; Gill2005; Bradstock et al.2009; Potop and Soukup2009; McLeman et al.2010; Gray and Mueller2012; Potop et al.2013).
of Serbia, especially in the northeastern, eastern and southern parts. These were recorded in the last two decades (RSOG2011). In 1990, drought was particularly intense in the wide area of southwest Serbia and in the northeastern part. In 2000, the drought in all parts of Serbia was catastrophic, especially in the northern part of Vojvodina (Kanjizˇa), Timocˇka Krajina and the southeastern areas (Spasov 2003). More recently, droughts have been recorded in 2000, 2001, 2007, 2008, 2011 and 2012. Moreover, Serbia was particularly affected by the heat wave in 2012, with temperatures of up to 40C, damaging crops and triggering hundreds of wildfires (SEERISK2014).
In particular in the Kanjizˇa municipality (Serbia), the occurrence of drought and drought-related wildfires is of major environmental concern. Drought may have significant adverse impact on agriculture and related activities, which are the basic economic source of the municipality. However, apart from economic losses droughts also cause negative physical and ecological impacts. Between 2001 and 2012, 12 drought periods were reg- istered with an average of 30-day duration. The latest drought event in 2012 was the most severe, lasting for more than 90 days. Its direct estimated damage exceeded 20 million Euros, and indirect estimated damage was ten times greater (SEERISK2014). In Kanjizˇa, wildfires mostly occur on pastures, meadows and natural grasslands, frequently along the highway, regional and local roads and near settlements. Between 2007 and 2012, 210 wildfires caused one death and one injury as well as damages of about 65.000 Euros (SEERISK2014).
The relationship between fire occurrence and drought has important implications for fire prediction under current and future climates. Karin et al. (2013) evaluated correlations between drought and fire-danger-rating indices representing short- and long-term drought, to determine which had the strongest relationships with large fire occurrence at the scale of the western USA during the years 1984–2008. Calkin et al. (2011) described options for assessing alternative investments to mitigate wildfire risk, suggesting the use of compar- ative risk assessment as a rigorous basis for analyzing the ignition, spread, suppression, duration, costs, and ecological and economic impacts of wildfires.
National-level alerts and available data often do not reach the relevant local authorities responsible for the intervention, and even more typically, the ones suffering from the consequences. The perception of citizens and the local authorities regarding the impacts of climate change varies by country and region, but it is generally inadequate (Hungarian Academy of Sciences et al.2013; National Directorate General for Disaster Management et al. 2013). Due to the regionally varying social awareness and preparedness, the same climatic event may result in different consequences within the SEE region. This study focuses on the impacts of drought and drought-related wildfire, the associated risk, as well as, on existing and potential adaptation strategies.
Due to the significant impact of drought and drought-related wildfires in the area, the effects of climate change would require systematic integration of risk assessment results in territorial planning. In order to assess the risk from drought and drought-related wildfires, we apply the SEERISK common methodology for risk assessment and mapping (Pap- athoma-Ko¨hle et al.2013). The methodology was developed within the SEERISK project.
The project aims at the development of a methodology for risk assessment, the analysis of risk awareness and the development of suggestions on how to incorporate climatic aspects
into existing territorial and sector-specific planning regimes to enable communities to make harmonized, strategically elaborated actions to deal with the new challenges. The main purpose of SEERISK is to improve coherence and consistency among risk assess- ments and emergency preparedness of society undertaken by the countries at national and local level, and especially in case of disasters intensified by climate change. A description of the SEERISK methodology is given in the following chapter.
2 SEERISK common risk assessment methodology
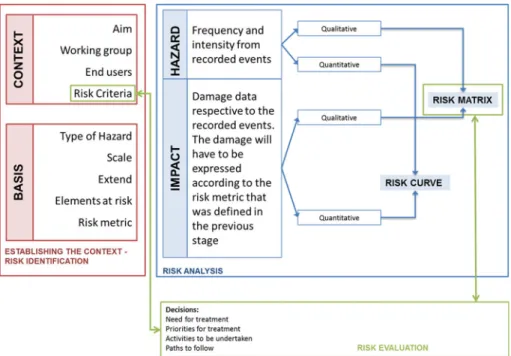
The Ministry of Internal Affairs of Serbia provides national guidelines which contain a methodology for risk assessment, protection plans and rescue in emergency situations caused by natural and man-made disasters at the national level. However, the SEERISK common methodology for risk assessment and mapping may be used at different scales (national, regional and local or site specific). It has been developed under the consideration of the ‘‘EC Guidelines for Risk Assessment and Mapping’’ (EC 2010) and offers alter- natives in order to overcome common obstacles such as the lack of data and lack of documentation of past events. The methodology has been developed as a neutral frame- work (Fig.1), but within the SEERISK project it has been adapted for five climate change- related hazard types: flood, drought, heat wave, wildfire and extreme winds. The methodology for wildfire and drought has been adopted due to the high number of annual wildfires during severe droughts and is shown in Figs.1and2. The impact, in the case of drought hazard rating, was the affected crop type and its associated value, while in the case
Fig. 1 SEERISK methodology (Papathoma-Ko¨hle et al.2013)
of the wildfire, the impact was data on land cover type, based on its value but also on its importance from a civil protection viewpoint.
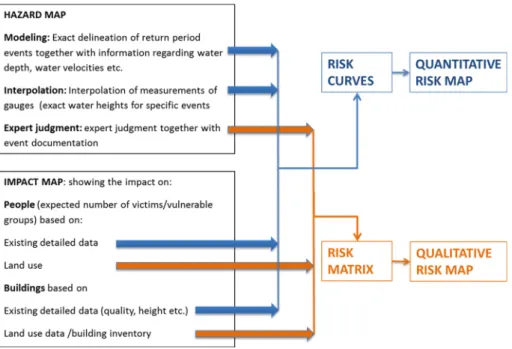
Risk assessment according to the EC guidelines for risk assessment and mapping (EC 2010) involves the assessment of the probability of occurrence of an event and the assessment of its impact on elements at risk. In other words, risk analysis addresses hazard and vulnerability analysis. In Fig.2, the SEERISK methodology for droughts is demon- strated. It incorporates the development of a hazard and an impact map that will lead to a quantitative or a qualitative risk map according to the available data.
In the present paper, a qualitative risk map is developed following the methodology of Fig.2. The steps of the risk assessment and mapping are described below:
1. The development of a risk matrix by implementing the following actions based on information on past events
• Indicating the likelihood or probability of occurrence of drought events
• Indicating the impact of droughts on crops
• Setting the drought risk levels (low, medium, high, very high) 2. The development of a hazard map
3. The development of an impact map
4. Overlay of the above maps and development of a risk map showing the different risk levels as they have been rated in the risk matrix
The Standardized Precipitation Index (SPI) was used to express the drought intensity.
The SPI is a widely used probabilistic drought index, which is simple and spatially con- sistent in its interpretation (Guttman1998; Hayes et al.1999; Shamsuddin and Behrawan
Fig. 2 SEERISK common risk assessment methodology modified for droughts (Papathoma-Ko¨hle et al.
2013)
2008). It is official index of Republic Hydrometeorological Service of Serbia for assessing drought risk. An SPI based on precipitation data daily delivered from three stations (Kikinda, Palic´ and Becˇej) was obtained for 12-month period from mean index for the interval 2000–2012, for the municipality of Kanjizˇa.
Drought-related wildfire risk analysis requires assimilation of physical information from many sites with a unique geographical location. Detailed database for wildfires in municipality of Kanjizˇa is available since 2007. The database consists of the date of the wildfire event, the exact location, the duration, the extend of the affected area, data on human causalities, damages and material loss of agriculture, damages and material loss of residential buildings and the maximum temperature during each event. Records for events before 2007 have many gaps. In more detail, before 2007 only information regarding the date of wildfire event, the total damages, the quantity of spent water for fire fighting and the description of the site without exact location (which is crucial for GIS analyzing and mapping) is available. From these reasons, we are using data for wildfires only since 2007.
GIS maintains the spatial location of sampling points or area and provides tools to relate the sampling data contained through a relational database, by integrating data from dif- ferent sources (Pandey et al.2012). Therefore, GIS has been used in this study to induce levels of drought-related wildfires risk through the analysis of spatially distributed mete- orological, land use and land cover data from the general plan of the municipality, i.e., from land use and land cover plan, settlement network, public services and infrastructure plan and natural resources, protection of natural and cultural resources and environmental protection plan.
The multi-hazard matrix rates the hazard based on the number of wildfires ranging from 0 to 14 events during two-class drought category. Based on that information, the risk matrix has been established. In both cases (drought and wildfire), the element at risk considered was the type of agriculture, in case of drought, the risk metric was their value in Euros/ha, while in case of wildfire the risk levels were formulated from a civil protection aspect (fire protection of people and inhabited areas).
The output is a qualitative risk maps for drought and drought-related wildfires at regional level. The maps may be used for the design of preventive and mitigation measures or emergency planning. Hazard, impact and risk maps were based on available data on the identified hazards for the Kanjizˇa municipality collected from municipal sector for emergency situations and Municipal Fire Brigade.
3 The study area
The territory of municipality of Kanjizˇa is situated in Vojvodina region (Serbia) and geographically extends from 45550to 46100N latitude and from 19480to 20050E lon- gitude (Fig.3). Kanjizˇa municipality consists of 13 settlements and is located in the North Banat District in Vojvodina by the Hungarian border at 78–108 m above sea level. It has a population of 25,950 people. Its administrative area covers 399 km2. Tisa River flows East of Kanjizˇa and around 200 km of artificial channel network crosscuts the municipality.
The climate is moderate continental, with cold winters and warm and dry summers. In 2012, there were many warm days (meanT[25C for 121 days and meanT[30C for 62 days). In 2012, the mean annual temperature was 12.3C, insolation was 2517.8 h per year with an average precipitation of 434 mm per year (RHMZS 2012). The average annual precipitation in the period from 1949 to 2010 for meteorological station Palic´ is
556 mm (Milosˇevic and Savic2013), and in the period from 1971 to 2000 for the mete- orological station Szeged 490 mm, and the average for the same period in the spring of 117 mm as compared to the average of the last 100 years means a reduction in about 30 % (HMS, 2000). Meteorological stations Palic´ and Szeged (Hungary) are two nearest meteorological stations to the study area. In the southeast border areas of Hungary and in the territory of Kanjizˇa, the number of days with precipitation decreased. Although a slight increase in the number of days with precipitation over 20 mm can be observed, the length of the dry period (the longest period when daily rainfall does not reach 1 mm) significantly increased from the beginning of the twentieth century. According to the National strategy for climate change of Hungary based on data for the period 1961–1990, projected growth of the average monthly temperature for the period 2021–2050 will be 1–2.5C (SNCCS 2013).
The typical vegetation types in the region include crops, bulrush, pastures, meows and shrubs, all of them are very prone to wildfires. Vojvodina is one of the European regions with poorest forest areas in terms of spatial extent—only 6.5 % of the territory is covered by forest (Sekulic´ et al.2012). Moreover, forest cover in study area is only around 2 % (SORS2008), while agricultural land covers 75 % of the territory. The remaining areas are characterized by pastures, meadows and wetlands.
The spatial plan of municipality of Kanjizˇa does not contain information about climate change scenarios, projected temperatures and future risk scenarios. However, it emphasizes the priority of the development of natural disaster protection system. The regional spatial plan of Autonomous Province of Vojvodina addresses the topic of risk management and
Fig. 3 Study area Kanjizˇa in the Vojvodina region (Serbia)
assessment for droughts and on the hazard map of this chapter municipality of Kanjizˇa appears to be (threatened by drought) in the high hazard area. The municipality of Kanjizˇa has local headquarters for emergency situations. The municipality has a vulnerability assessment and emergency situations rescue plan, which is aligned with other official (structures) plans of the Republic of Serbia (RSOG2011). This plan states that the land-use planning in the territory of Kanjizˇa for specific purposes must be in accordance with law on environmental protection and the law of the fire protection, to conserve natural resources and minimize the risk to human health. However, these plans are not hazard specific.
4 Application and results
Risk matrices were developed separately for drought and in combination with wildfires.
The first risk matrix describes the drought risk levels based on SPI (Standardized Pre- cipitation Index) classification and the associated impacts (Fig.4). SPI was analyzed for the time period 2000–2012.
As there are only two SPI values in the pilot area, the drought risk-level rating uses a two-category hazard classification, where SPI score between-1.282 and-1.645 means high hazard (severe drought), while bellow -1.645 score represents very high hazard (extreme drought) (RHMZS2010). The impact level is basically determined by the value of the affected crop type during a drought period. Very low SPI score associated with high- value crop type represents the highest drought risk level in the matrix. The risk levels change depending on crop value types and SPI scores. Very high-risk-level (red color code) cases need more intensive and frequent irrigation and have priority in building of irrigation systems. The other risk levels are ranging from orange and yellow to green accordingly. High risk (orange color code) includes building of alternative water supply, while medium risk (yellow color code) means investments in public awareness. Low risk level (green color code) means the least drought intensity where local authorities operate in a conventional manner. The insignificant risk level (white color code) relates to the geo- graphical locations such as urban areas, water areas and wetlands where drought has no consequences.
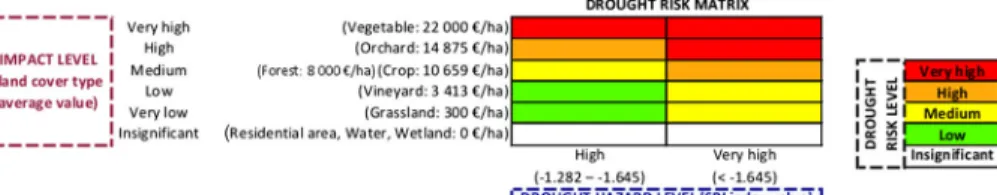
The second risk matrix describes the drought-related wildfire risk levels, which repre- sent the combination of hazard and impact levels (Fig.5). The multi-hazard level is a combination of the drought index and the wildfire hazard. The impact rating is based on the type of elements at risk, where the land cover type ranges from residential area and forest with very high impact, orchard and vineyard with high impact, crop and vegetable with medium impact, grassland with low and finally water bodies and wetlands with insignif- icant impacts during very high multi-hazard level. Apart from the agriculture damage, we took in consideration civil protection point of view because for whole analyzed period
Fig. 4 Drought risk matrix
Fig. 5 Drought-related wildfire risk matrix
Fig. 6 Drought hazard map
(2007–2012) drought-related wildfires caused one victim and one injured. Very high-risk levels (red color code) represent situations with the highest frequency of wildfire occur- rences in residential areas or forests. These cases need the most urgent emergency actions as preparedness for evacuations and fire extinguishing. High risk (orange color code) includes more extensive and frequent presence of fire brigades, while medium risk (yellow color code) means investments in public awareness. Low (green color code) risk level
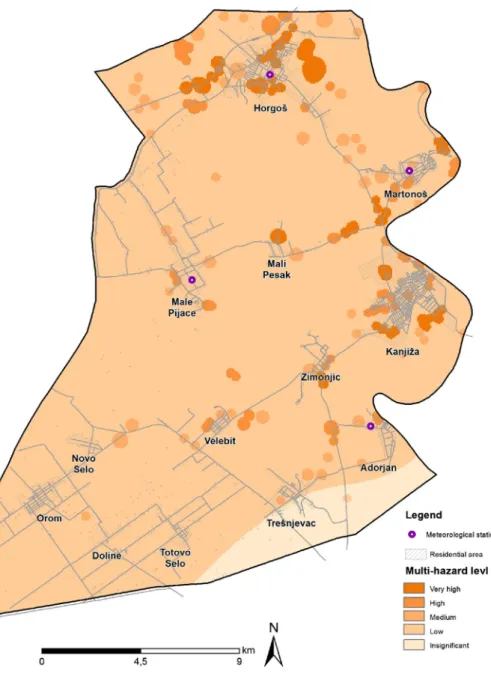
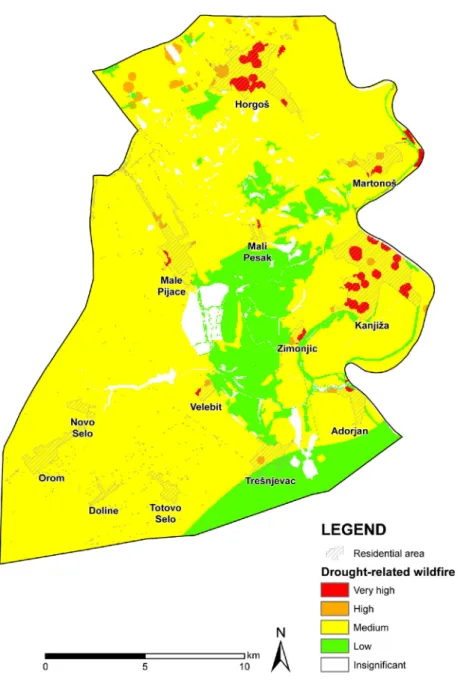
Fig. 7 Drought-related wildfire hazard map
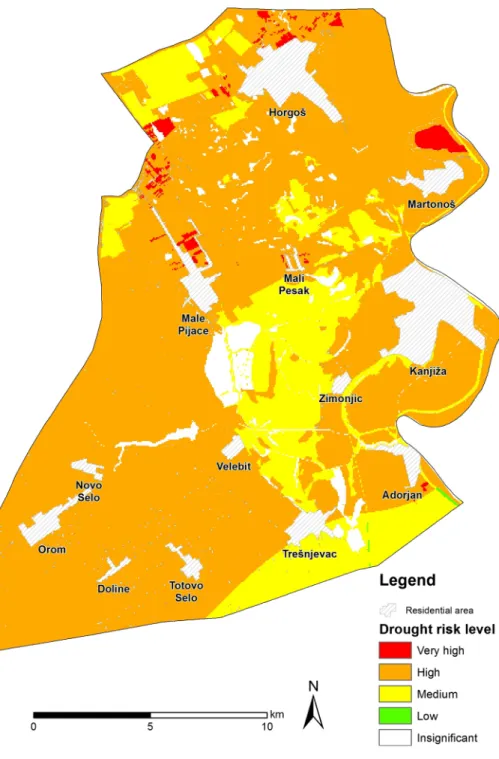
Risk mappingThe risk mapping process started with the calculation and interpolation of drought data (SPI) based on provided precipitation data (Fig.6) and the number of occurrences of wildfire, placed on the map, with a 200-m buffer zone. The drought-related wildfire multi-hazard map was created by combination of these two above-mentioned factors (Fig.7).
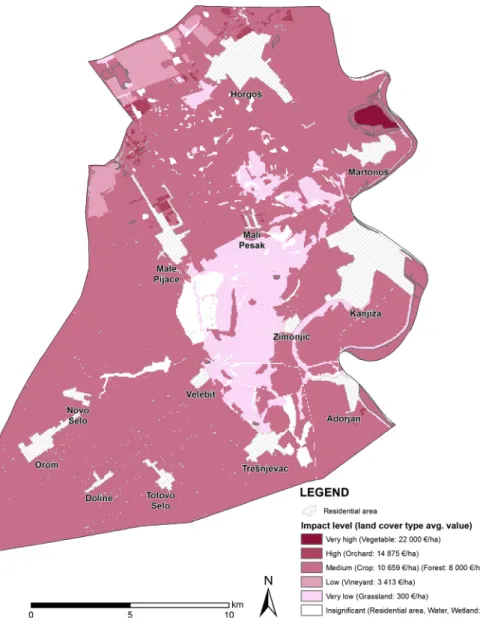
Fig. 8 Drought impact map
In the next step, the drought and the drought-related wildfire impact maps were created.
The impact, in the case of drought hazard rating, was the affected crop type and its associated value (Fig.8). In the case of the wildfire hazard ratings, the impact was data on land cover type, based on its value but also on its importance from a civil protection viewpoint (Fig.9).
In the final step, a risk map for each hazard was created. The risk map was based on the intersection of the hazard and the impact maps. The hazard and impact value of each pixel led to a risk value based on the risk matrix. This value for each pixel is demonstrated in the
Fig. 9 Drought-related wildfire impact map
Fig. 10 Drought risk map
monetary terms greater than 30 million Euros of direct and indirect damage), health problems (from injury to death cases), wildlife habitat changing, livestock mortality and disruption of economic activity.
The analysis of the area percentage under different drought-related risk categories shows that 1.41 % of the area is exposed to very high risk, 0.82 % of the area to high risk, 77.97 % of the area to moderate risk, 14.89 % of the area to low risk and 4.91 % of the area to insignificant (Table1).
Fig. 11 Drought-related wildfire risk map
The wildfire hazard map (Fig.7) clearly shows the occurrence of the wildfire events along the road network. It is an assumption that this hazard type (wildfire event) is in the majority of the cases a consequence of the human activity related to the glass garbage disposal and cigarette stubs (Mr. Laszlo Cikos, pers. communication, 2013).
Highest risk levels show places along the highway E-75 near the settlement of Horgosˇ, in the neighborhood of Kanjizˇa city, and the dumpsite located on the right side of the road between Mali Pesak and Kanjizˇa. Highest risks level, but in the lesser extent, show areas near settlements Martonosˇ, Zimonjic´, Velebit, Adorjan, Mali Pesak and Male Pijace. The risk level is lower near other settlements or roads elsewhere in the municipality. In the low risk, categories belong to places situated far away from settlements (or roads). Typical land cover types within the highest risk areas include artificial surfaces, such as road networks, and associated grassland and seminatural areas (scrub and herbaceous vegetation associ- ations).Water areas as rivers, fish pounds and wetlands risk have insignificant risk level.
5 Discussion
The present study’s objective was to investigate impact and hazard of drought and drought- related wildfires in Kanjizˇa municipality and to assess and map the associated risk. As expected, high-risk areas correspond with areas characterized by high hazard and high impact. The areas of highest wildfire hazard correspond very well with the areas of high drought hazard and impact (high level of hazard due to droughts). On the other hand, this area also corresponds very well to the areas around settlements and the road network which indicate on direct human impact.
Human population patterns and environment have been influenced and modified by climatic variability, changes and extreme events. For areas affected by drought and wildfires such as Kanjizˇa municipality, risk assessment is very essential. Such investiga- tions may assist in the design of mitigation measures and in the identification of potential points of intervention to moderate negative socioeconomic impact if and when they occur.
As the assessment of risk is one of the main aspects of drought and wildfires mitigation and planning, we hope that these maps and the study in general will strengthen the operational responses of the authorities.
The application of the common risk assessment methodology in this case study can be the basis for the future regional planning in the Vojvodina province. It could be applied to neighboring municipalities that also belong to arid areas (Novi Knezevac, Kikinda, Subotica, Cˇ oka, Senta).
The main advantage of the methodology is comparability although amount of available data is limited. It offers a common platform to the involved parties so that individuals from different authorities (local authorities emergency services, etc.) and with different interests may work together and contribute their experience and knowledge for the development of a
common risk map or risk assessment. The use of GIS enables the updating of the database helping in this way the decision makers to consider future changes not only concerning the climate but also the spatial pattern of the elements at risk. Using this methodology and GIS, field researches can identify with greater spatial precision places they seek to investigate.
Last but not least the visualization of risk enabled through GIS alters the risk perception of decision makers and the public supporting in this way effective risk management.
However, many limitations are associated with the application of the specific methodology. Due to lack of data, many assumptions had to be made increasing in this way the level of uncertainty in the study. In more detail in the hazard assessment phase due to lack of relevant information regarding the probability of wildfire initiation, high hazard was assumed around settlements and the road network. Moreover, concerning the impact assessment, due to almost annually changes in land cover (planting different crops) the yearly update impact inputs every year are considered essential although it would increase the mapping costs.
As mentioned above, the main limitation of the methodology is the lack of reliable good quality data. Better event documentation in the future will lead to the collection of reliable good quality detailed data regarding the impact of drought-related wildfire, or other climate change-related hazards and, consequently, to an improved risk assessment and mapping.
Furthermore, more information on events and their location will contribute to reliable hazard maps demonstrating the probability of events in the area.
This article is a starting point for future investigation of drought and drought-related wildfires in Kanjizˇa municipality. The major outcome of this study is the production of a drought and drought-related wildfires risk maps. It is hoped that the study will be beneficial to a number of stakeholders, particularly disaster management, but also agricultural organizations, health centers, planning authorities, risk insurers and others to improve their understanding on drought and wildfire impacts.
6 Conclusion
The presented research illustrates the application of the SEERISK common risk assessment methodology on drought-related wildfire hazard in municipality of Kanjizˇa (Serbia). The risk maps developed can be used to give a quick estimate whether there is a high, medium or low risk in the affected area. Analysis of the presented map results may lead to an easier update of local action and development plans and legislation by taking into account the wildfire and drought hazards.
This methodology, represented with an integrated measure of drought-related wildfire hazard and impact, provides a useful tool for wildfire risk assessment. There is a potential for improvement in the way governments manage drought-related wildfire impacts. This research presents novel approaches to assess drought-related wildfire hazard. Given the high priority on protecting human life, crops and environment, the nature of analysis we present here could have wide application across the Serbia and other countries which face with similar natural hazard.
Acknowledgments This study represents one of the results of the project SEERISK project (contract number SEE/C/0002/2.2/X) financed by Europe Union. We are very thankful to project partners and to data providers—Sector for emergency situation in Kanjizˇa municipality, Municipal Fire Brigade and for fruitful discussions to Mr. Laszlo Csikos—Head of the Department of Civil Protection and Crisis Management Municipality of Kanjizˇa.
berston-Day MJ (2011) A comparative risk assessment framework for wildland fire management—the 2010 Cohesive strategy science report. Fort Collins, USDA
EC (2010) Staff working paper on risk assessment and mapping guidelines for disaster management.
European Commission
Gibbons P, Van Bommel L, Gill AM, Cary GJ, Driscoll DA, Bradstock RA, Knight E, Moritz MA, Stephens SL, Lindenmayer DB (2012) Land management practices associated with house loss in wildfires. PLoS ONE. doi:10.1371/journal.pone.0029212
Gill AM (2005) Landscape fires as social disasters: an overview of ‘the bushfire problem’. Global Environ Change B Environ Hazards 6(2):65–80
Gray C, Mueller V (2012) Drought and population mobility in rural Ethiopia. World Dev 40(1):134–145 Guttman NB (1998) Comparing the Palmer drought index and the standardized precipitation index. J Am
Water Resour As 34(1):113–121
Hao L, Zhang X, Liu S (2012) Risk assessment to China’s agricultural drought disaster in county unit. Nat Hazards 61:785–801
Hayes MJ, Svoboda MD, Wilhite DA, Vanyarkho OV (1999) Monitoring the 1996 drought using the standardized precipitation index. Bull Am Meteorol Soc 80(3):429–438
HMS (2000) Hungarian meteorological service http://www.met.hu/eghajlat/eghajlatvaltozas/megfigyelt_
valtozasok/Magyarorszag/. Accessed 14 March 2014
Hungarian Academy of Sciences, Research Centre for Regional Studies, National Directorate General for Disaster Management (2013) Analysis of the local level planning documents for the occurrence of natural disaster.https://seerisk.rsoe.hu/share/page/site/seeriskproject/document/details?nodeRef=work space://SpacesStore/79da4bea-eff1-40c0-94c1-e60c54fcc857. Accessed 4 Nov 2014
IPCC (2012) Managing the risks of extreme events and disasters to advance climate change adaptation. In:
Field CB, Barros V, Stocker TF, Qin D, Dokken DJ, Ebi KL, Mastrandrea MD, Mach KJ, Plattner GK, Allen SK, Tignor M, Midgley PM (eds) A special report of working groups I and II of the inter- governmental panel on climate change. Cambridge University Press, Cambridge, New York, p 594 Karin LR, Abatzoglou JT, Grenfell IC, Klene AE, Heinsch FA (2013) The relationship of large fire
occurrence with drought and fire danger indices in the western USA, 1984–2008: the role of temporal scale. Int J Wildland Fire 22(7):894–909
Keeley JE (2004) Impact of antecedent climate on fire regimes in coastal California. Inter J Wildland Fire 13:173–182
Keeley JE, Fotheringham CJ (2001) Historic fire regime in southern California shrublands. Conserv Biol 15:1536–1548
Liu X, Zhang J, Tong Z, Bao Y (2012) GIS-based multi-dimensional risk assessment of the grassland fire in northern China. Nat Hazards 64(3):81–395
McKenzie D, Gedalof Z, Peterson DL, Mote P (2004) Climatic change, wildfire, and conservation. Conserv Biol 18:890–902
McLeman R, Herold S, Reljic Z, Sawada M, McKenney D (2010) GIS-based modeling of drought and historical population change on the Canadian Prairies. J Hist Geogr 36:43–56
Milosˇevic D, Savic´ S (2013) Analysis of precipitation quantities and trends from Pannonian and Peripan- nonian parts of Serbia. Dela 39:125–139
Moritz MA (2003) Spatiotemporal analysis of controls on shrubland fire regimes: age dependency and fire hazard. Ecology 84:351–361
MWSDR (2007) Technical report on water scarcity and drought management in the Mediterranean and the Water Framework Directive, Produced by the Mediterranean Water Scarcity and Drought Working Group (Med Ws&D Wg) Mediterranean Water Scarcity and Drought Report 2007.http://www.emwis.
net/topics/WaterScarcity. Accessed 13 March 2014
National Directorate General for Disaster Management, Hungarian Academy of Sciences, Institute for Regional Studies (2013) Social awareness questionnaire—SEERISK. https://seerisk.rsoe.hu/share/
page/site/seerisk-project/document_details?nodeRef=workspace://SpacesStore/18b0dcda-1e00-46ab- a6e0-75ca30c4709e. Accessed 4 Nov 2014
NMI (2013) Extreme weather events in Europe: preparing for climate change adaption. Norwegian Mete- orological Institute.http://www.easac.eu/fileadmin/PDF_s/reports_statements/Extreme_Weather/Extre
me_Weather_full_version_EASAC-EWWG_final_low_resolution_Oct_2013f.pdf. Accessed 20 March 2015
Pandey S, Pandey AC, Nathawat MS, Kumar M, Mahanti NC (2012) Drought hazard assessment using geoinformatics over parts of Chotanagpur plateau region, Jharkhand, India. Nat Hazards 63:279–303 Papathoma-Ko¨hle M, Promper C, Glade T, Szekely M (2013) SEERISK: common risk assessment methodology for the Danube macro-region. https://seerisk.rsoe.hu/share/page/site/seerisk-project/
document-details?nodeRef=workspace://SpacesStore/656b0d96-bc9e-4a67-8f99-3805087533f9.
Accessed 4 Nov 2014
Potop V, Soukup J (2009) Spatiotemporal characteristics of dryness and drought in the Republic of Mol- dova. Theor Appl Climatol 96(3–4):305–318
Potop V, Boroneant C, Mozny M, Sˇtepanek P, Skalak P (2013) Observed spatiotemporal characteristics of drought on various time scales over the Czech Republic. Theoret Appl Climatol 112(3–4):563–581 Prior T, Eriksen C (2013) Wildfire preparedness, community cohesion and social–ecological systems.
Global Environ Chang 23:1575–1586
RHMZS (2010) Implementation of standardized precipitation index—SPI, report. Republic Hydrometeo- rological Service of Serbia.http://www.hidmet.gov.rs/podaci/agro/ciril/REPORT_SPI_in_Serbia.pdf.
Accessed 14 March 2014
RHMZS (2012) Meteorological yearbook of Republic Hydrometeorological Service of Serbia for 2012 year.
Republic Hydrometeorological Service of Serbia.http://www.hidmet.gov.rs/podaci/meteo_godisnjaci/
Meteoroloski%20godisnjak%201%20%20klimatoloski%20podaci%20-%202012.pdf. Accessed 14 March 2014(in Serbian)
RSOG (2011) National strategy for the protection and rescue in emergency situations. ‘‘RS Official Gaz- ette’’, No. 86/11. 2011.http://prezentacije.mup.gov.rs/svs/HTML/Nacionalna%20strategija%20zastite%
20i%20spasavanja%20u%20VS.pdf. Accessed 13 March 2014
Scott J, Helmbrecht D, Thompson M, Calkin D, Marcille K (2012) Probabilistic assessment of wildfire hazard and municipal watershed exposure. Nat Hazards 64:707–728
SEERISK (2014) Guideline on climate change adaption and risk assessment in the Danube macro-region.
National Directorate General for Disaster Management, Hungary
Sekulic´ G, Dimovic´ D, Kalmar KJZ, Todorovic´ N (2012) Climate vulnerability assessment Serbia.
Seeclimateforum. http://www.seeclimateforum.org/upload/document/cva_srbija_english_final.pdf.
Accessed 4 Feb 2014
Shamsuddin S, Behrawan H (2008) Drought risk assessment in the western part of Bangladesh. Nat Hazards 46:391–413
Sheffield J, Wood EF, Roderick ML (2012) Little change in global drought over the past 60 years. Nature 491:435–438
SNCCS (2013) Second National Climate Change Strategy 2014-2025 with an outlook for 2050.http://www.
kormany.hu/download/7/ac/01000/M%C3%A1sodik%20Nemzeti%20%C3%89ghajlatv%C3%
A1ltoz%C3%A1si%20Strat%C3%A9gia%202014-2025%20kitekint%C3%A9ssel%202050-re%20-%
20szakpolitikai%20vitaanyag.pdf. Accessed 13 March 2014(in Hungarian)
SORS (2008) Municipalities databasehttp://webrzs.stat.gov.rs/WebSite/Public/ReportResultView.aspx?rpt Key=indId%3d2002IND01%2635%3d80195%262%3d200800%26sAreaId%3d2002%26dType%
3dName%26lType%3dEnglish. Statistical Office of the Republic of Serbia. Accessed 14 March 2014 Spasov P (2003) Occurrence of drought in Serbia, its monitoring and forecasting capabilities. Vodoprivreda
35:30–36(in Serbian)
UNISDR (2009) Drought risk reduction framework and practices: contributing to the implementation of the Hyogo framework for a Action. United Nations Secretariat of the International Strategy for Disaster Risk reduction (UNISDR), Geneva, pp 213
Westerling AL, Hidalgo HG, Cayan DR, Swetnam TW (2006) Warming and earlier spring increase western US forest wildfire activity. Science 313:940–943
Wotton BM, Flannigan MD (1993) Length of the fire season in a changing climate. For Chron 69:187–192 Yongqiang L, Stanturf J, Goodrick S (2010) Wildfire potential evaluation during a drought event with a
regional climate model and NDVI. Ecol Inf 5:418–428