Error processing during the online retrieval of probabilistic sequence knowledge
Kata Horváth a,b,c, Zsófia Kardos d,e, Ádám Takács f, Valéria Csépe d,g, Dezso Nemeth c,b,h, Karolina Janacsek b,c,i, Andrea Kóbor d
a: Doctoral School of Psychology, ELTE Eötvös Loránd University, Izabella utca 46, H–
1064, Budapest, Hungary
b: Institute of Psychology, ELTE Eötvös Loránd University, Izabella utca 46, H–1064, Budapest, Hungary
c: Brain, Memory and Language Research Group, Institute of Cognitive Neuroscience and Psychology, Research Centre for Natural Sciences, Magyar tudósok körútja 2, H–1117, Budapest, Hungary
d: Brain Imaging Centre, Research Centre for Natural Sciences, Magyar tudósok körútja 2, H–
1117, Budapest, Hungary
e: Department of Cognitive Science, Budapest University of Technology and Economics, Egry József utca 1, H-1111, Budapest, Hungary
f: Cognitive Neurophysiology, Department of Child and Adolescent Psychiatry, Faculty of Medicine of the TU Dresden, Fetscherstraße 74, 01307 Dresden, Germany
g: Faculty of Modern Philology and Social Sciences, University of Pannonia, Egyetem u. 10., H–8200, Veszprém, Hungary
h: Lyon Neuroscience Research Center, INSERM, CNRS, Université de Lyon,
Centre Hospitalier Le Vinatier - Bâtiment 462 - Neurocampus 95 Boulevard Pinel 69675 Bron, Lyon, France
i: School of Human Sciences, Faculty of Education, Health and Human Sciences, University of Greenwich, Old Royal Naval College, Park Row, 150 Dreadnought, London, United Kingdom
Author Note
Correspondence and requests for material should be addressed to Prof. Dr. Dezso Nemeth, CRNL - Lyon Neuroscience Research Center, Université Claude Bernard Lyon 1, Lyon, France. Address: CRNL - Centre Hospitalier Le Vinatier - Bâtiment 462 - 95 Bd Pinel - 69675 Bron Cedex – France. Phone: +33 4 81 10 65 46. Email: dezso.nemeth@univ-lyon1.fr.
Abstract
Adaptive behavior involves rapid error processing and action evaluation. However, it has not been clarified how errors contribute to automatic behaviors that can be retrieved to
successfully adapt to our complex environment. Automatic behaviors strongly rely on the process of probabilistic sequence learning and memory. Therefore, the present study
investigated error processing during the online retrieval of probabilistic sequence knowledge.
Twenty-four healthy young adults acquired and continuously retrieved a repeating stimulus sequence reflected by reaction time (RT) changes on a rapid forced-choice RT task.
Performance was compared with a baseline that denoted the processing of random stimuli embedded in the probabilistic sequence. At the neurophysiological level, event-related brain potentials synchronized to responses were measured. Error processing was tracked by the error negativity (Ne) and the error positivity (Pe). The mean amplitude of the Ne gradually decreased as the task progressed, similarly for the sequence retrieval and the embedded baseline process. The mean amplitude of the Pe increased over time, likewise, irrespective of the type of the stimuli. Accordingly, we propose that automatic error detection (Ne) and conscious error evaluation (Pe) are not sensitive to sequence learning and retrieval. Overall, the present study provides insight into how error processing takes place for the retrieval of sequence knowledge in a probabilistic environment.
Keywords: adaptation, error negativity, error positivity, error processing, probabilistic
sequence learning
Introduction
Adaptive behavior requires a monitoring system that evaluates actions, adjusts performance to the environmental conditions, and detects the possible negative outcomes, such as errors.
Although errors have been widely researched in the context of learning in general (Gehring, Goss, Coles, Meyer, & Donchin, 2018; Rüsseler, Münte, & Wiswede, 2018), it has remained less clear how error processing takes place during the retrieval of the acquired knowledge.
Probabilistic sequence learning enables us to form automatic behaviors that can be retrieved to successfully adapt to the environment (Armstrong, Frost, & Christiansen, 2017; Turk- Browne, Scholl, Johnson, & Chun, 2010). The most prominent neurophysiological correlates of error processing are the error negativity (Ne, Falkenstein, Hohnsbein, Hoormann, &
Blanke, 1991) or error-related negativity (ERN, Gehring, Goss, Coles, Meyer, & Donchin, 1993) and the error positivity (Pe, Falkenstein, Hohnsbein, Hoormann, & Blanke, 1991) event-related brain potential (ERP) components. Here we use these neurophysiological markers to investigate the different aspects of error processing in an intentional probabilistic sequence learning task. We report evidence that both the Ne and the Pe are sensitive to performance improvement and adaptation to the task, but these components are not affected by the predictability of the sequence.
The Ne is a response-locked negativity of fronto-central maximum peaking
approximately 50–150 ms after an error is committed by the individual (Falkenstein et al., 1991; Gehring et al., 1993). The Ne has been shown to indicate the automatic detection of an erroneous response (i.e., independently of the error-apperception; Nieuwenhuis, Ridderinkhof, Blom, Band, & Kok, 2001). The Ne is usually followed by the Pe that is a response-locked positivity occurring with a centro-parietal maximum in a wider time window, ca. 100-500 ms after the onset of the erroneous response (Falkenstein et al., 1991; Overbeek, Nieuwenhuis, &
Ridderinkhof, 2005). The Pe has been predominantly linked to conscious error evaluation (Nieuwenhuis et al., 2001).
The exact underlying processes of the Ne are still debated; nevertheless, several theories have emerged so far. According to the error detection/mismatch theory, the magnitude of the Ne reflects the discrepancy between the actual and the intended response (Bernstein, Scheffers, & Coles, 1995; Falkenstein et al., 1991; Gehring et al., 1993). The reinforcement learning theory (Holroyd & Coles, 2002) claims that the Ne serves as a
reinforcement learning signal when the outcome of the behavior is worse than expected. The conflict theory (Botvinick, Braver, Barch, Carter, & Cohen, 2001; Carter et al., 1998; Yeung,
Botvinick, & Cohen, 2004) postulates that the Ne is a result of a process that continuously evaluates coactive and competing response representations. Finally, the motivational
significance theory states that the magnitude of the Ne reflects the emotional significance of
an error (Gehring et al., 1993; Hajcak, Moser, Yeung, & Simons, 2005): The larger the significance of the error, the larger the Ne.
The functional significance of the Pe is still argued, as well. This component is most often linked to error awareness (Endrass, Reuter, & Kathmann, 2007; Nieuwenhuis et al., 2001). In turn, another approach claims that the Pe is a P3b-like component reflecting error relevance (Falkenstein et al., 1991; Overbeek et al., 2005; Ridderinkhof, Ramautar, & Wijnen, 2009). A more recent line of research states that the Pe reflects the accumulated decision evidence that an error has occurred (Boldt & Yeung, 2015; Steinhauser & Yeung, 2012).
Previous studies investigating error processing during sequence knowledge formation mostly focused on the initial acquisition processes (Beaulieu, Bourassa, Brisson, Jolicoeur, &
De Beaumont, 2014; Ferdinand, Mecklinger, & Kray, 2008; Rüsseler, Kuhlicke, & Münte, 2003; Rüsseler et al., 2018) and usually investigated only the Ne (but see Ferdinand et al.,
2008). Further, the retrieval of sequence knowledge has been approached by the investigation of stimulus- or correct response-related ERP components so far (Ferdinand, Rünger, Frensch,
& Mecklinger, 2010; Miyawaki, Sato, Yasuda, Kumano, & Kuboki, 2005; Rüsseler & Rösler, 2000; Steinemann, Moisello, Ghilardi, & Kelly, 2016). Thus, the question remains, how error processing takes place during the retrieval of the acquired sequence knowledge.
To fulfill this gap, we introduce a probabilistic sequence learning task that involves the fast initial acquisition of a repeating sequence followed by the continuous retrieval of this sequence (Kóbor et al., 2018; Nemeth, Janacsek, & Fiser, 2013; Simor et al., 2019; Song,
Howard, & Howard, 2007a, 2007b). Namely, participants perform a rapid forced-choice RT task, in which stimulus presentation follows a repeating probabilistic sequence that can be learned and retrieved during task solving to achieve a better performance. The probabilistic nature of the sequence enables us to measure a retrieval-free baseline process, as well, that refers to the incidental RT improvement on the embedded random elements in parallel with the retrieval of the repeating sequence. Participants are asked to react to the direction of the stimuli according to a simple stimulus – response mapping rule. Over the course of
continuous task performance, we investigate the possible change of the Ne and the Pe components synchronized to the onset of the responses.
Although theories approach the Ne from different aspects, a converging conclusion can be drawn: For the acquired sequence knowledge, all theories predict an increasing Ne over the task, since it is presumable that any hypothesized underlying process of the Ne would be facilitated by learning and retrieval processes. In contrast, the Ne for the embedded
baseline is predicted to remain similar throughout the task. Accordingly, we expect an increase in the amplitude of the Ne selectively for the repeating sequence, as the retrieved knowledge strengthens. Similarly, it is presumable that learning and retrieval processes can facilitate the processes underlying the Pe, therefore, the above-detailed approaches predict an
increasing Pe for the repeating sequence and an unvarying Pe for the embedded baseline.
Thus, we also expect an increasing Pe for the repeating sequence opposing random events in the task, as the acquired representations become more consciously available.
Methods Participants
The data was collected in the study reported by Kóbor et al. (2018), where stimulus-locked ERPs were analyzed for correctly responded trials. Forty-one healthy young adults
participated in the experiment. One of them was excluded because of technical reasons. For the purpose of the present study, the inclusion criterion was set to a minimum of eight erroneously responded, artifact-free EEG segments for both the sequence and random trial types (see details below) in each time period of the task (Meyer, Riesel, & Proudfit, 2013;
Olvet & Hajcak, 2009). Therefore, further 16 participants were left out from the original sample due to the low number of erroneous responses or excessive artifacts. Hence, 24 participants (age range: 19-24 years, M = 20.9 years, SD = 1.4 years; mean education: M = 14.4 years, SD = 1.4 years; male/female ratio: 9:15) remained in this final sub-sample.
Handedness was measured by the Edinburgh Handedness Inventory (Oldfield, 1971);
the laterality quotient varied between 0 and 100 (M = 71.09, SD = 21.27), where -100 means complete left-handedness and 100 means complete right-handedness. Participants had normal or corrected-to-normal vision, none of them reported histories of any psychiatric and/or neurologic conditions, and none of them were taking any psychoactive medications. All participants provided written informed consent before enrolment and received payment (ca.
10 Euros) or course credit for taking part in the experiment. The study was approved by the
United Ethical Review Committee for Research in Psychology (EPKEB) in Hungary and was conducted in accordance with the Declaration of Helsinki.
Task and procedure
Probabilistic sequence knowledge formation was measured by a modified cued version of the Alternating Serial Reaction Time (ASRT) task (Kóbor et al., 2018; Nemeth, Janacsek, &
Fiser, 2013). In this task, an arrow stimulus appears at the center of the screen. Participants are instructed to press the response key corresponding to the spatial direction of the arrow (left, up, down, or right) on a response box (Cedrus RB-530, Cedrus Corporation, San Pedro, CA) as fast and as accurately as possible using their left or right index finger or thumb, respectively.
The presentation of the arrow stimuli follows an eight-digit sequence within which predefined pattern and random (r) trials alternate. One example of the sequence is 1-r-2-r-4-r- 3-r, where numbers represent the four possible spatial directions (1 = left, 2 = up, 3 = down, 4
= right) and rs denote randomly chosen spatial directions out of them. The sequence structure is cued by different colors: Predefined pattern trials appear as black arrows, while random trials appear as red ones (Figure 1A). Participants are informed that the presentation of black arrows follows a predefined sequence, while red arrows point to randomly chosen spatial directions. They are instructed to learn the exact order of the black arrows.
In the present study, we examine error processing during probabilistic sequence retrieval, hence, we focus on the differences between pattern trials and the embedded random trials. However, due to the alternating nature of the sequence, a hidden predictability structure emerges in the task based on the frequency of chunks of trials – referred to as triplets – instead of single trials. Some of these triplets occur more frequently than others. Each trial is
categorized as either the third element of a high- or a low-frequency triplet; therefore, the terms “trial” and “triplet” are used interchangeably for the remainder of the paper. Frequency also defines the predictability of a triplet’s third element. This structure results in two
different types of random trials, which are differently related to learning and retrieval processes. While the pattern trials always appear with high frequency, random trials appear either with high- or low-frequency. Therefore, while frequent random trials become as predictable as the pattern ones, infrequent random trials remain less predictable. Overall, the combination of the sequential and the frequency properties results in three possible trial types:
pattern trials, high-frequency random trials, and infrequent random trials (Figure 1B; for more details, see Kóbor et al., 2018; Nemeth et al., 2013; Simor et al., 2019). In the present study, all high-frequency random trials were excluded from the analyses to avoid possible retrieval- related confounds. Previous ASRT studies showed that the acquisition of sequence knowledge takes place early in the cued version of the task (Kóbor et al., 2018; Nemeth et al., 2013;
Simor et al., 2019). It is, therefore, presumable that further RT improvement is based on the online retrieval of this knowledge. Generally, RTs to the infrequent random trials also
improve along with decreasing accuracy, which is not explained by speed-accuracy trade-off (Tóth et al., 2017). From now on, random trials are referred to as infrequent random trials.
Figure 1. Schematic of the task. (A) In the cued Alternating Serial Reaction Time (ASRT) task, the presentation of the stimuli follows an eight-digit alternating sequence, within which predefined pattern (P) trials alternate with random (r) ones. Pattern trials are marked by black and random trials are marked by red (shown by grey on this figure). (B) In the sequence structure, numbers denote the four spatial directions (1 = left, 2 = up, 3 = down, 4 = right) of the arrows. High-frequency triplets are denoted with dark grey shading and low-frequency triplets are denoted with light grey shading. We determined for each pattern and random stimulus whether it was the last trial of a high- or a low-frequency triplet, thus, three different trials could occur: pattern (P – r – P structure, always high-frequency), random-high (high- frequency with r – P – r structure) and random-low (low-frequency with r – P – r structure).
(C) Timing and strucutre of an erroneous trial.
Thirty blocks of the ASRT task added up the experiment and the whole procedure lasted about 2.5 hours including the application of the electrode cap. One block contained 85 trials: The eight-digit alternating sequence repeated 10 times in each block after five warm-up trials consisting only of random trials. To ascertain that conscious sequence knowledge
emerges, a sequence report was administered after each block. Participants were asked to type the order of pattern trials using the same response keys as in the ASRT task. This method allowed us to determine the duration (in terms of the number of blocks) participants needed to learn the sequence correctly as defined by consistently reporting the same sequence from that point on in the remaining blocks.
The structure of the task was the following. An experimental trial started with the presentation of the stimulus (arrow) for 200 ms. Then, a blank screen occurred until the participant gave a behavioral response but no longer than 500 ms. After the response, a blank
screen was presented for a fixed delay of 700 ms before the next trial started. This is called as response-to-stimulus interval (RSI). Participants could also provide a response during the 200 ms time window of stimulus presentation; in that case, the stimulus disappeared after the response onset, followed immediately by the RSI. A blank screen was presented for 500 ms after every erroneous response, followed by a black “X” at the center of the screen for another 500 ms (Figure 1C). For the lack of response, a black “!” was displayed for 500 ms. These warning stimuli served as visual feedback for error commission or missing response, respectively. RSIs were presented after both warning stimuli. If the participant provided a further response to correct the erroneous or missed trial, it influenced neither the presentation nor the timing of the next trial; thus, the task proceeded without providing the correct
response. After each block, the participant received feedback about the mean reaction time and accuracy on the predefined pattern trials (black arrows) in the given block. The ASRT task was written in and run by the Presentation software (v. 18.1, Neurobehavioral Systems, Inc., Berkeley, CA, USA), and stimuli were presented on a 19’’ CTR screen with a viewing distance of 125 cm.
EEG recording and analysis
The EEG measurement was conducted in an acoustically attenuated, electrically shielded, dimly lit room. The EEG was recorded with 64 Ag/AgCl electrodes, placed according to the international 10-20 system, using Synamps amplifiers and Neuroscan software 4.5.
(Compumedics Neuroscan, Charlotte, NC, USA). The tip of the nose served as reference and the electrode AFz served as ground. Vertical and horizontal eye-movements were measured by electrodes attached above and below the left eye, and in the left and right outer canthi. The sampling rate was 1000 Hz, electrode impedance levels were kept below 10 kΩ, and a 70 Hz low-pass filter (24 dB/oct) was applied online.
Data analysis was conducted in the Brain Vision Analyzer software (Brain Products GmbH, Gilching, Germany). First, a 0.5-30 Hz band-pass filter (48 dB/oct) and a 50 Hz notch filter were applied offline. Then, independent component analysis (ICA) was used to correct vertical and horizontal eye-movements and heartbeats (Delorme, Sejnowski, & Makeig, 2007). After, the EEG data were re-referenced to the average activity of all electrodes. The continuous EEG data were segmented in two steps. First, the data were cut into three equal time periods, each containing ten ASRT blocks, to measure the temporal changes in error processing. Second, within each time period, response-locked ERPs were calculated, based on the correctness of the response (erroneous or correct) and the type of the given trial (pattern or random). Thus, altogether 3x2x2 segment types were created according to the periods,
response correctness, and the trial types.
Following segmentation, an automatic artifact rejection method was applied (segments with activity above or below +/– 100 µV were rejected), then, the artifact-free segments were baseline corrected based on the averaged pre-stimulus activity in the -200 ms to 0 ms time window. For erroneous pattern trials, the average number of artifact-free response-locked segments was 19.5 (SD = 7.3; MPeriod 1 = 16.9, SDPeriod 1 = 5.2, MPeriod 2 = 21.1, SDPeriod 2 = 9.5, MPeriod 3 = 20.4, SDPeriod 3 = 10.0). For erroneous random trials, this average was 19.5, as well (SD = 8.6; MPeriod 1 = 20.3, SDPeriod 1 = 7.8, MPeriod 2 = 20.3, SDPeriod 2 = 7.1, MPeriod 3 = 18.1, SDPeriod 3 = 6.8). The overall number of erroneous response-locked segments did not differ across trial types (t(23) = -0.03, p = .975). For correct pattern trials, the average number of artifact-free response-locked segments were 366.1 (SD = 9.8; MPeriod 1 = 367.1, SDPeriod 1 = 9.9, MPeriod 2 = 363.7, SDPeriod 2 = 12.0, MPeriod 3 = 367.5, SDPeriod 3 = 6.7). For correct random trials, this average was 176.1 (SD = 12.3; MPeriod 1 = 179.2, SDPeriod 1 = 9.9, MPeriod 2 = 171.7, SDPeriod 2
= 13.6, MPeriod 3 = 177.3, SDPeriod 3 = 14.3). The overall number of correct response-locked segments was higher for pattern trials than for random trials (t(23) = -88.48, p < .001). Please,
note that this difference partly originates from the fact that frequent random trials were excluded at the beginning of the analysis (see above), which decreased the number of artifact- free random segments. Segments were averaged for correct and erroneous responses,
separately for pattern and random trials in each period.
Commonly, error commission is scarce and decreases over time in learning situations.
However, it has been shown that as few as three to six EEG segments can yield reliable Ne and Pe effects (Meyer et al., 2013; Olvet & Hajcak, 2009; Pontifex et al., 2010). Therefore, it is plausible to calculate these components as markers of error processing in learning tasks, such as the present one. Consequently, the grand average ERPs calculated for the conditions detailed above were visually inspected, then, the observed and previously reported
topographical distributions of the Ne and Pe components (Gehring et al., 1993) were
considered. Accordingly, the Ne was quantified as the mean amplitude of the 0-100 ms time range relative to the erroneous response onset at electrode Cz, where this ERP component showed maximum amplitude. The Ne for correct responses was quantified in the same way as for erroneous responses. The Pe appeared earlier for correctly responded trials than for
erroneous trials, therefore, its time window was chosen to match both response conditions.
Accordingly, the Pe was quantified as the mean amplitude of the 100-300 ms time range relative to the erroneous as well as the correct response onset at electrode Cz. Erroneous minus correct difference waveforms were calculated for each ERP component, as well.
Data analysis
In order to measure error processing during the online retrieval of probabilistic sequence knowledge, we focused on the trajectory of the responses to pattern trials. Therefore, behavioral and ERP data from pattern trials were analyzed in smaller time bins, each containing ten task blocks (i.e., periods, see also above). Data from the random trials were
analyzed separately and according to the pattern trials; and, these data were used to indicate a retrieval-free baseline process, where incidental practice could happen. In terms of the
behavioral data, for each participant, trial type, and period, median RTs for correct and erroneous responses as well as error ratios were calculated.
Behavioral measures (error ratios and RTs for correct and erroneous responses) for each trial types (pattern, random), respectively, were analyzed in repeated measures analyses of variance (ANOVAs) with the factors PERIOD (Period 1, 2, 3) and TRIAL TYPE (pattern vs. random). ERP mean amplitudes for both components (Ne, Pe) were analyzed in repeated measures ANOVAs with the factors RESPONSE (erroneous vs. correct), PERIOD (Period 1, 2, 3), and TRIAL TYPE (pattern vs. random). Greenhouse-Geisser epsilon (ε) correction was used when necessary. Original df values and corrected p values (if applicable) are reported together with partial eta-squared (ηp2) as the measure of effect size. Bonferroni correction was used for pair-wise comparisons to correct for Type I error.
Results Behavioral results
Behavioral measures in the three periods are presented in Figure 2 separately for pattern and random trials.
Figure 2. Group-average learning performance at the behavioral level. Black lines indicate perfromance on pattern trials and grey lines indicate performance on random trials. (A) Error ratio as a function of period (1-3, represented on the X axis). (B) Correct RTs as a function of period. (C) Erroneous RTs as a function of period. Error bars represent the standard error of mean.
Error ratio slightly varied across the time bins (main effect of PERIOD: F(2, 46) =
3.07, p = .056, ηp2 = .12; Period 1: 6.8%, Period 2: 7.9%, Period 3: 7.3%). Participants
committed less errors on pattern trials than on random ones (significant main effect of TRIAL TYPE: F(1, 23) = 40.75, p < .001, ηp2 = .64; pattern trials: 4.9%, random trials: 9.8%). The significant PERIOD * TRIAL TYPE interaction (F(2, 46) = 4.33, ε = .79, p = .028, ηp2 = .16) revealed that while error ratio on pattern trials did not change over time (Period 1: 5.2%, Period 2: 5.1%, Period 3: 4.5%; all ps ≥ .179), it increased on random trials (Period 1: 8.5%, Period 2: 10.8%, Period 3: 10.1%; Period 1 vs. Period 2: p = .040; Period 2 vs. Period 3: p = .904; Period 1 vs. Period 3: p = .279). The pattern – random difference did not change over the task (all ps ≥ .070), and participants were more accurate on pattern trials than on random ones in all periods (all ps < .001). Altogether, these results suggest that the online retrieval of the sequence knowledge could have helped participants to maintain accurate performance on
pattern trials throughout the task, while performance was less consistent on the embedded baseline trials.
Correct RTs became faster with practice (significant main effect of PERIOD: F(2, 46)
= 24.29, ε = .72, p < .001, ηp2 = .51; Period 1: 337 ms, Period 2: 316 ms, Period 3: 309 ms;
Period 1 vs. Period 2: p < .001; Period 2 vs. Period 3: p = .088; Period 1 vs. Period 3: p <
.001), and participants responded faster for pattern trials than for random ones (significant main effect of TRIAL TYPE: F(2, 46) = 63.43, p < .001, ηp2 = .73; pattern trials: 288 ms, random trials: 354 ms). These main effects were qualified by the significant PERIOD * TRIAL TYPE interaction (F(2, 46) = 12.65, ε = .73, p < .001, ηp2 = .36). Pair-wise
comparisons showed that the pattern – random difference increased as the task progressed (all ps < .001), and participants responded faster for pattern than for random trials in all periods
(all ps < .001). Performance gradually improved on pattern trials (Period 1: 313 ms, Period 2:
284 ms, Period 3: 266 ms; all ps ≤ .022), while on random trials, this improvement was present only in the beginning of the task (Period 1: 360 ms, Period 2: 349 ms, Period 3: 351 ms; Period 1 vs. Period 2: p = .001; Period 2 vs. Period 3: p = .719; Period 1 vs. Period 3: p = .015). These results also reflect that sequence knowledge was acquired and retrieved online.
Slight speed-up was observed on the embedded baseline trials, which, together with the increasing error ratio, suggests a moderate performance improvement, achieved incidentally throughout practice.
The analysis of erroneous RTs also revealed that erroneous responding became faster over time (significant main effect of PERIOD: F(2, 46) = 10.13, p < .001, ηp2 = .31; Period 1:
297 ms, Period 2: 284 ms, Period 3: 275 ms; Period 1 vs. Period 2: p = .024; Period 2 vs.
Period 3: p = .208; Period 1 vs. Period 3: p = .002) and were overall faster for pattern trials than for random ones (significant main effect of TRIAL TYPE: F(1, 23) = 13.23, p = .001, ηp2
= .36; pattern trials: 275 ms, random trials: 296 ms). The PERIOD * TRIAL TYPE interaction
was not significant (F(2, 46) = 0.91, p = .410, ηp2 = .04), hence, the trajectory of erroneous RTs did not differ across trial types. In sum, participants committed errors faster on pattern trials, thus, this measure further reflects the effect of online sequence retrieval, opposing the moderate practice effect observed on the embedded baseline trials.
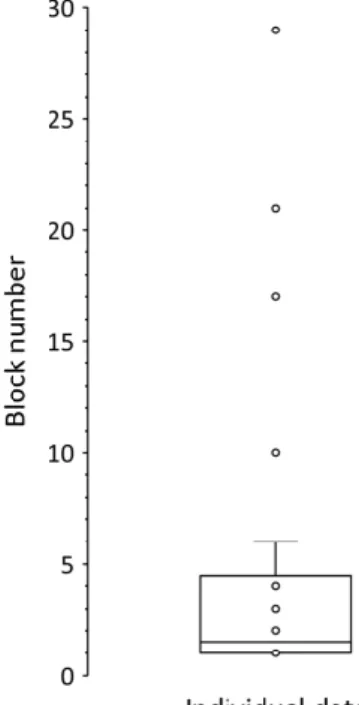
According to the sequence report, the discovery of the order of pattern trials emerged early in the task. Here, we excluded two participants who failed to provide at least 10 correct responses even after the final block of the task or reached this threshold during earlier blocks but failed to do so consistently in the remaining blocks. Participants consistently reported the repeating sequence from around the 5th block (M = 5.0, SD = 7.1, Figure 3).
Figure 3. Boxplot indicating the discovery of the sequence based on the sequence report task.
The Y axis represents the number of blocks (1-30). The box marks the interquartile range (i.e., the 50% of all values), the horizontal line marks the median value, the upper whisker marks the 25% of values above the interquartile range, and the dots mark individual values. Please, note that two participants are excluded here as indicated in the main text.
Post-error behavioral performance
To investigate whether adaptation is present and changes over time in the current experiment, post-error performance was tested, as well. The most common behavioral correlate of
adaptation processes is the post-error slowing effect: Usually, RTs increase on the error- subsequent trials as a compensation (Simons, 2010). Thus, we compared RTs before and after an error has occurred (Dutilh, Van Ravenzwaaij, et al., 2012). First, we excluded errors that were immediately followed by another error, that is, only correct RTs were compared.
Second, we calculated the median RTs for error-preceding and error-subsequent trials separately for pattern and random trials in each period. Third, these data were submitted to a 2x3x2 repeated measures ANOVA with the factors ORDER (error-preceding vs. error-
subsequent), PERIOD (1, 2, 3), and TRIAL TYPE (pattern vs. random). It is important to note that due to the sequence – random alteration in the task, an inevitable confound is present in the dataset: If an error occurs on a pattern trial, two random trials are compared in the present analysis and vice versa.
The significant main effect of ORDER confirmed the presence of the post-error slowing effect (F(1, 23) = 40.30, ε = .74, p < .001, ηp2 = .64): Participants responded 40 ms (SD = 54 ms) slower after than before error commission. The main effect of PERIOD (F(2, 46) = 6.80, p = .007, ηp2 = .23) and the main effect of TRIAL TYPE (F(1, 23) = 9.12, p = .006, ηp2 = .28) were also significant, reflecting the above-described general speed-up and pattern vs. random difference, respectively. The significant ORDER * PERIOD interaction (F(2, 46) = 4.76, p = .013, ηp2 = .17) qualified the main effects. Pair-wise comparisons
showed that the difference between error-preceding and error-subsequent RTs decreased over time (Period 1 = 51 ms; Period 2 = 47 ms; Period 3 = 23 ms; Period 1 vs. Period 2: p = .749, Period 2 vs. Period 3: p = .006, Period 1 vs. Period 3: p = .011). Error-subsequent RTs were slower than error-preceding RTs in all periods (all ps ≤ .003). Moreover, while error-
preceding RTs decreased from Period 1 to Period 2 (p = .013; Period 1 = 324 ms, Period 2 = 293 ms, Period 3 = 290 ms; all other ps ≥ .107), error-subsequent RTs decreased throughout the task (Period 1 = 374 ms; Period 2 = 340 ms; Period 3 = 312 ms; Period 1 vs. Period 2: p = .015; Period 2 vs. Period 3: p = .341; Period 1 vs. Period 3: p = .001). The ORDER * TRIAL TYPE, the PERIOD * TRIAL TYPE, and the ORDER * PERIOD * TRIAL TYPE
interactions were not significant (F(2, 46) = 2.75, p = .111, ηp2 = .11, F(2, 46) = 0.34, p = .714, ηp2 = .02, F(2, 46) = 0.92 p = .406, ηp2 = .04, respectively). Overall, the post-error slowing effect decreased over time similarly for pattern and random trials.
ERP results
Grand average ERP waveforms for erroneous and correct responses as well as for their difference are presented in Figure 4 and Figure 5, separately for pattern and random trials in each period at electrode Cz. For erroneous responses, the Ne appeared as a sharp negative wave followed by the Pe as a broad positive wave. For the correct responses, the
corresponding ERP waveforms were attenuated. In addition, while the Ne for correct responses appeared as a relative negativity with similar latency (with a peak around ca. 40 ms) as for the erroneous responses, the Pefor correct responses occurred earlier (with a peak around ca. 120 ms) than for the erroneous ones and returned to baseline around 200 ms (cf.
Ferdinand et al., 2008). Means and standard deviations of each ERP component in each period split by trial type are presented in Table 1. The ERP data were analyzed in 2x3x2 repeated measures ANOVAs with the factors RESPONSE (erroneous vs. correct), PERIOD (1, 2, 3), and TRIAL TYPE (pattern vs. random). Only the significant effects are reported here; the summary of all effects is presented in Table 2.
Figure 4. Grand average ERP waveforms synchronized to the response onset at electrode Cz displaying the Ne and the Pe components separately for the three periods, two response types, and two trial types. Please, note that negativity is plotted upwards here and in the following figures. Solid lines denote erroneous response-locked waveforms and dashed lines denote correct response-locked waveforms. Light grey shading indicates the time window where the Ne was measured, while dark grey shading indicates the time window of the Pe. Rows mark the two trials types and columns mark the three periods.
Figure 5. (A) Erroneous minus correct difference waveforms at electrode Cz, separately for pattern and random trials. Solid lines denote Period 1, dashed lines denote Period 2, and dotted lines denote Period 3. Light grey shading indicates the time window of the Ne, while dark grey shading indicates the time window of the Pe. (B) The scalp topography (amplitude distribution) of the erroneous – correct difference in the time windows of the Ne (0-100 ms) and the Pe (100-300 ms), respectively, separately for pattern and random trials.
Table 1. Sample means and standard deviations of the Ne and the Pe components, separately for each response type (erroneous or correct), period, and trial type (pattern or random).
Pattern trials Ne for erroneous
responses
Nefor correct responses
Pe for erroneous responses
Pe for correct responses M (SD) µV M (SD) µV M (SD) µV M (SD) µV
Period 1 -4.3 (3.22) 1.2 (1.74) 2.4 (2.76) 0.8 (2.27)
Period 2 -3.3 (2.86) 1.6 (1.82) 3.1 (2.84) 1.3 (2.81)
Period 3 -2.7 (2.83) 1.7 (1.96) 4.3 (2.74) 1.8 (2.51)
Random trials Ne for erroneous
responses
Nefor correct responses
Pe for erroneous responses
Pefor correct responses M (SD) µV M (SD) µV M (SD) µV M (SD) µV
Period 1 -4.1 (3.25) 0.9 (2.15) 2.4 (2.89) 0.7 (2.36)
Period 2 -3.5 (3.68) 1.4 (2.30) 3.8 (2.57) 0.9 (2.77)
Period 3 -2.7 (3.24) 1.4 (2.24) 4.1 (2.73) 1.0 (2.72)
Table 2. Summary of results from ANOVAs performed on the ERP data
Note. p-values below .050 are boldfaced.
Effect ERP
Component Statistics Response Period Trial Type
Response
* Period
Response
* Trial Type
Period * Trial Type
Response * Period * Trial Type
Ne
F 49.71 19.16 0.51 5.87 0.54 0.09 0.47
p < .001 < .001 .484 .005 .471 .914 .628
ηp2 .684 .454 .022 .203 .023 .004 .020
Pe
F 12.60 22.04 0.68 5.81 2.48 3.67 1.10
p .002 < .001 .417 .006 .129 .033 .341
ηp2 .354 .489 .029 .202 .097 .138 .046
The analysis of the Ne yielded a significant main effect of RESPONSE (F(1, 23) = 49.71, p < .001, ηp2 = .68): Erroneous responses elicited a larger (more negative) Ne than correct responses. The main effect of PERIOD also appeared to be significant (F(2, 46) = 19.16, ε = .73, p < .001, ηp2 = .45), revealing a gradually decreasing Ne regardless of response type and trial type (all ps ≤ .013). These main effects were qualified by the RESPONSE * PERIOD interaction (F(2, 46) = 5.87, p = .005, ηp2 = .20). Pairwise comparisons showed that although the Ne for erroneous responses was larger than the Ne for correct responses in every period (all ps < .001), the erroneous – correct difference of the trial-unspecific Ne (i.e., Ne irrespective of trial type) decreased from Period 1 to Period 3 (p = .004; Period 1 vs. Period 2:
p = .130; Period 2 vs. Period 3: p = .065). The Ne for erroneous responses significantly
decreased throughout the task (all ps ≤ .022). In contrast, the Nefor correct responses
decreased only from Period 1 to Period 2 (p = .042), while it did not change for the remainder of the task (Period 2 vs. Period 3: p = .999; Period 1 vs. Period 3: p = .079). We did not find any significant effects involving the factor TRIAL TYPE (Tables 1-2). In sum, the Ne
decreased for erroneous and correct responses over time, regardless of trial type (Figures 4-5).
The analysis of the Pe yielded a significant main effect of RESPONSE (F(1, 23) = 12.60, p = .002, ηp2 = .35), reflecting a larger Pe for erroneous responses than for correct responses. The main effect of PERIOD also appeared to be significant (F(2, 46) = 22.04, ε = .75, p < .001, ηp2 = .49), revealing a gradually increasing Pe, regardless of response type and trial type (all ps ≤ .010). These main effects were further qualified by the significant
RESPONSE * PERIOD interaction (F(2, 46) = 5.81, p = .006, ηp2 = .20). Pairwise
comparisons showed that although the Pe was larger for erroneous responses than for correct responses in all periods (all ps ≤ .016), the erroneous – correct difference of the trial-
unspecific Pe increased from Period 1 to Period 2 (p = .036; Period 2 vs. Period 3: p = .122;
Period 1 vs. Period 3: p = .009). In addition, the Pe for erroneous responses significantly
increased throughout the task (all ps ≤ .018). In contrast, the Pefor correct responses increased only from Period 1 to Period 2 (p = .047), while it did not show further changes (Period 2 vs. Period 3: p = .429; Period 1 vs. Period 3: p = .013). Opposing the Ne, the PERIOD * TRIAL TYPE interaction reached significance, as well (F(2, 46) = 3.67, p = .033, ηp2 = .14). Pair-wise comparisons showed that the difference of the response-unspecific Pe (i.e., Pe irrespective of response correctness) between pattern and random trials increased by the end of the task (Period 1 vs. Period 2: p = .368; Period 2 vs. Period 3: p = .039; Period 1 vs. Period 3: p = .062). Particularly, the Pe was larger for pattern trials than for random ones in Period 3 (p = .045, all other ps ≥ .506). The Pe for pattern trials gradually increased as the task progressed (all ps ≤ .029), while the Pe for random trials increased only from Period 1 to Period 2 (p < .001; Period 2 vs. Period 3: p = .999; Period 1 to Period 3: p = .005). Altogether, regardless of trial type, the Pe for erroneous responses gradually increased, while this increase was modest for the correct responses. Regardless of response correctness, a larger Pe was observed for pattern trials than for random ones in the end of the task (Figures 4-5).
Possible distortion effects in the Ne: Stimulus-locked ERPs
It has been previously raised that overlapping ERPs may lead to different distortion effects in experiments where RTs vary across conditions, as in the present one (Coles, Scheffers, &
Holroyd, 2001). Therefore, we investigated the stimulus-locked P3 component, as well. To this end, EEG segments were extracted from -200 ms to 600 ms relative to stimulus onset;
then, these were averaged for each period and trial type (see also the analyses of Kóbor et al.
(2018)). For the sake of completeness and to match the main analyses, besides correctly responded stimuli, erroneously responded stimuli were also investigated. The P3 was quantified as the mean amplitude between 250 ms and 350 ms at electrode Pz, where this component appeared with maximum amplitude. Grand average stimulus-locked ERP
waveforms displaying the P3 component are presented in Figure 6. Please, note that the P3 for erroneously responded stimuli were calculated from less than the adequate number of
segments, thus, the resulting waveform was noisy. The mean amplitude of the P3 was
analyzed in a 2x3x2 repeated measures ANOVA with the factors RESPONSE (erroneous vs.
correct), PERIOD (1, 2, 3), and TRIAL TYPE (pattern vs. random).
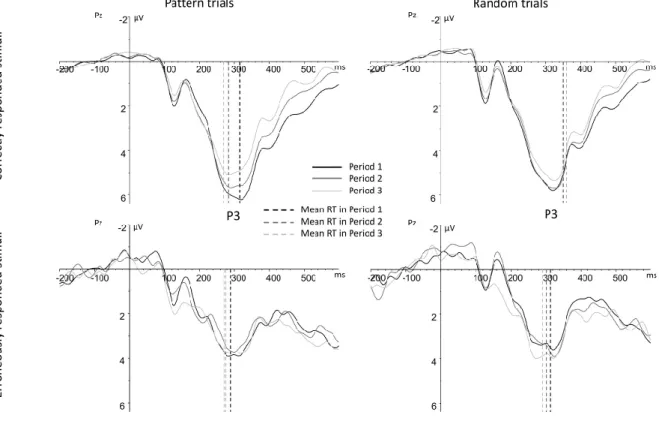
Figure 6. Grand average ERP waveforms synchronized to stimulus onset at electrode Pz displaying the P3 component time-locked to the correctly responded trials (upper panel) and time-locked to the erroneously responded trials (lower panel) separately for the two trial types (pattern vs. random, left and right panels, respectively). Black lines indicate the first period, dark grey lines indicate the second period, and light grey lines indicate the third period.
Dashed vertical lines show the average RT observed for the given trial and response type in the given period. Colors are used according to the ERP waveforms. Please, note that the P3 for erroneously responded trials is noisy due to the low number of segments available.
The P3 for erroneously responded stimuli was reduced compared with the correctly responded ones (significant main effect of RESPONSE: F(1, 23) = 81.41, p < .001, ηp2 = .78).
The main effect PERIOD (F(2, 46) = 1.66, p = .201, ηp2 = .07), and the main effect of TRIAL TYPE (F(1, 23) = 0.42, p = .523, ηp2 = .02) did not reach significance. The significant
RESPONSE * PERIOD interaction (F(2, 46) = 4.99, p = .011, ηp2 = .18) revealed that although the P3 for erroneously responded stimuli was lower than the P3 for correctly responded stimuli in all periods (all ps < .001), the erroneous – correct difference of the trial- unspecific P3 decreased from Period 1 to Period 3 (p = .033, all other ps ≥ .206). The P3 for correctly responded stimuli decreased (Period 1 vs. Period 2: p = .602, Period 2 vs. Period 3:
p = .003, Period 1 vs. Period 3: p < .001), while the P3 for erroneously responded stimuli did
not change over time (all ps = .999). The PERIOD * TRIAL TYPE interaction appeared as significant, as well (F(2, 46) = 6.06, p = .010, ηp2 = .18), revealing that while the response- unspecific P3 did not differ across trial types in any of the periods (all ps ≥ .057), the pattern – random difference decreased from Period 1 to Period 3 (p = .028, all other ps ≥ .107),
Particularly, the P3 for pattern stimuli decreased in the late phase of the task (Period 1 vs.
Period 3: p = .045, Period 1 vs 2: p = .880, Period 2 vs. Period 3: p = .147), while the P3 for random stimuli did not change (all ps = .999, see Figure 6). The RESPONSE * TRIAL TYPE interaction and the RESPONSE * PERIOD * TRIAL TYPE interaction were not significant (F(2, 46) = 0.73, p = .401, ηp2 = .03; F(2, 46) = 0.38, p = .684, ηp2 = .16, respectively). That is, the temporal change of the P3 component differed according to the correct – error contrast and the pattern – random contrast, respectively.
We visually inspected the temporal relationship of the P3 component and the average RTs across response types and trial types. The average RT fell into the peak of the P3 in most cases, except for correctly responded random stimuli (Figure 6). Meanwhile, we did not find any trial type-related effect in the Ne data (Table 2, Figures 4-5). Therefore, although the P3
component and correct RTs vary across trial types as a function of task period, the response- locked activity does not seem to be contaminated with or distorted by the stimulus-locked ERP activity.
Discussion
In the present study, we investigated error processing during the intentional retrieval of probabilistic sequence knowledge. To seize the temporal characteristics of error processing, we divided the task into three equal time periods. By using stimuli with different physical characteristics and providing different instructions, the initial acquisition and online retrieval of the repeating events of a probabilistic sequence has been detached from an embedded baseline process provided by practice on the infrequent random events. The sequence reports proved that knowledge of the repeating sequence was explicitly available early in the task.
Further performance improvement was observed on the repeating events throughout the task, opposing the random ones. It is presumable that the former process has been grounded by the already existing sequence knowledge and reflected retrieval processes as participants aimed to achieve better performance on the task. While accuracy decreased for random trials, RTs became slightly faster, supporting our expectations of a retrieval-free baseline process where incidental RT improvement can happen. The post-error slowing effect decreased over time comparably for the sequence retrieval and the baseline process, reflecting a sequence- independent reduction in behavioral adjustments.
Automatic detection and conscious evaluation of the committed errors were indicated by the presence of Ne and Pe ERP components, respectively. Correct response-related components were considered to control for correct-response related processes. The stimulus- locked P3 was investigated, as well, to exclude the possibility of distortion effects in the Ne
caused by the varying stimulus-locked ERPs and RTs across conditions. Surprisingly, the Ne for erroneous responses as well as the response-unspecific Ne decreased over time,
comparably for the sequence retrieval and the embedded baseline process. The trial-unspecific Pe for erroneous responses gradually increased over time, while the trial-unspecific Pe for correct responses showed a moderate increase only, similarly across the retrieved sequence and the random trials. The response-unspecific Pe appeared to be larger for pattern than for random trials by the end of the task. Altogether, we show evidence that both automatic error detection and conscious error evaluation are sensitive to general performance improvement in the task, while neither the Ne nor the Pe is selectively sensitive to sequence retrieval.
The analyses of the Ne yielded two main results: First, the Ne continuously decreased over time, as opposed to our hypothesis based on the main theoretical accounts of the Ne. We propose that instead of the effect of sequence learning and retrieval, the Ne amplitude
modulation reflects a general adaptation to the task. It is presumable that as participants practiced the task, the mapping of the stimuli and the corresponding responses (S–R
mappings) became automatized. The automatization of S–R mappings was also reflected by the stimulus-locked P3 data (cf. Kóbor et al., 2019; Verleger, 1997; Verleger, Jaśkowski, &
Wascher, 2005; Verleger, Metzner, Ouyang, Śmigasiewicz, & Zhou, 2014): The trial- unspecific P3 amplitude for correctly responded stimuli decreased over time, whereas the trial-unspecific P3 amplitude for the erroneously responded stimuli did not change. Moreover, post-error slowing also decreased throughout the task, suggesting that less adjustment was needed after an error occurred as participants proceeded with the task (Danielmeier &
Ullsperger, 2011; Dutilh, Vandekerckhove, et al., 2012). Altogether, the automatization of S–
R mappings could have supported the automatic detection of errors, resulting in a decreasing Ne. Second, the Ne did not show sensitivity to the predictability of the sequence. Likewise, post-error adjustment took place comparably for the retrieved sequence and the embedded
baseline process. These results support the notion that the Ne as well as the S–R mappings created throughout the task are independent of sequence learning and retrieval processes.
These observations are in line with the error detection/mismatch theory (Bernstein et al., 1995; Falkenstein et al., 1991; Gehring et al., 1993): The comparison of erroneous and correct response representations could have required less resources as S–R mappings became automatized, which was reflected in the Ne decrease. The motivational significance theory (Gehring et al., 1993; Hajcak et al., 2005) can also explain the observed Ne decrease. It has been previously shown that errors violating task goals (e.g., flanker-related errors in the Eriksen flanker task) elicit a greater Ne than errors originating from mere response confusion (e.g., non-flanker errors), suggesting that performance-related significance modulates the magnitude of the Ne (Maier, Di Pellegrino, & Steinhauser, 2012; Maier & Steinhauser, 2016).
Furthermore, adjustments in post-error adaptation also reflect the changes in error significance (Maier, Yeung, & Steinhauser, 2011). Particularly, errors should imply the possibility of learning to adaptively use them, meaning that post-error adaptation might not occur (or might decrease in amount) if the significance of errors becomes low. In the present study, we, indeed, observed a decreasing post-error slowing effect that might have indicated a decrease in error significance as the task progressed. This explanation could be in line with the study of Holroyd and colleagues (2009) showing that the amplitude of the feedback- related negativity is modulated by adaptation processes. Similarly, we assume that the significance of errors could have reduced as responding became automatized. Additionally, the rapid acquisition of sequence knowledge, i.e., the completion of participants’ main task goal, could have also led to a drop of error significance, finally resulting in an Ne decrease.
Nevertheless, as error significance was not directly manipulated or measured in the present experiment, this explanation has to be treated with caution.
To this date, studies investigating the neurophysiological aspect of error processing in the intentional acquisition of repeating regularities focused on the initial learning processes.
Here, we go beyond these studies by describing the Ne as well as the Pe during the continuous use of sequence knowledge to improve task performance. Prior studies revealed no sequence- specific modulations of the Ne (Ferdinand et al., 2008; Rüsseler et al., 2003), except when the development of knowledge was examined across smaller time bins, where the Ne increased with sequence learning compared with the random stimulus stream (Rüsseler et al., 2018).
Yet, these studies used deterministic sequences, as opposed to the probabilistic nature of the present stimulus stream. In our experiment, the Ne amplitude modulation appeared similarly for the repeating sequence and the random elements. This result is contradictory to those found in the study of Rüsseler et al. (2018); however, it is presumable that while erring has a high cost during the development of representations, especially for deterministic regularities, it has less impact once the representations and S–R mappings are strengthened.
The Pe for erroneous responses, on the one hand, increased throughout the task, irrespective of the predictability of the sequence. Although we expected an increase selectively for pattern trials, the obtained results can be still explained by the theoretical approaches of the Pe. The error awareness approach claims that the magnitude of the Pe reflects the level of awareness regarding the committed error (Endrass et al., 2007;
Nieuwenhuis et al., 2001): The higher the level of error awareness, the larger the Pe. The account of P3b states that the Pe is a P3- or P3b-like component and reflects the salience of an
error (Falkenstein et al., 1991; Overbeek et al., 2005; Ridderinkhof et al., 2009), i.e., a higher relevance or saliency of an error yields a larger Pe. Finally, the account of decision evidence accumulation hypothesizes that the Pe reflects the level of confidence in or the amount of
evidence available for the omitted error (Boldt & Yeung, 2015; Steinhauser & Yeung, 2012).
Although these frameworks assume different functional significance of the Pe, all can explain
the observed increase: As participants practiced the task and the S–R mappings strengthened, awareness regarding the representation of errors could have increased, errors could have become more salient for conscious evaluation, and error confidence could have increased, as well.
On the other hand, the response-unspecific Pe was larger for the retrieved sequence compared with the embedded random events by the end of the task. The above described theories can explain this effect, as well: As pattern trials are more salient in the present task, it is presumable that errors on these trials are characterized with higher error awareness and more evidence for error commission. Previously, only one study investigated the Pe as the correlate of error awareness in the acquisition of repeating regularities, to our knowledge:
Ferdinand et al. (2008) did not observe any sequence-specific modulation of the component.
This result is opposing the present study. We assume that while the sequence knowledge had been explicitly acquired already by the first period in the present experiment, Ferdinand et al.
(2008) measured developing representations, leading to different results. We suggest that the Pe for erroneous responses is not sensitive to the predictability of the sequence in the present study. Meanwhile, when the combined processing of correct and erroneous responses is measured, sensitivity to the sequence can be observed in terms of conscious evaluation, at least by the end of the task, suggesting that conscious response evaluation could be supported by the retrieval processes.
In conclusion, the present study adds further relevant results to the field, as, to the best of our knowledge, this is the first study investigating the neurophysiological correlates of error processing during the online retrieval of sequence knowledge in a probabilistic environment. The observed Ne effects indicate that adaptation to the environment based on the development of S–R mappings results in a rapid amplitude drop. Likewise, the observed Pe effects indicate that error awareness is also supported by adaptation processes. As neither
the Ne nor the Pe are modulated differently as a function of sequence predictability, we suggest that automatic error detection and conscious error evaluation are independent of sequence learning and retrieval. Finally, we propose that the investigation of the Ne and the Pe in the case of automatic behaviors should be further extended.
Acknowledgement
This research was supported by the National Brain Research Program (project 2017-1.2.1- NKP-2017-00002, PI: D. N.); the Hungarian Scientific Research Fund (OTKA FK 124412, PI: A. K., OTKA PD 124148, PI: K. J., OTKA K 128016, PI: D. N.); the IDEXLYON Fellowship of the University of Lyon as part of the Programme Investissements d'Avenir (ANR-16-IDEX-0005 to D. N.); the János Bolyai Research Scholarship of the Hungarian Academy of Sciences (to A. K. and K. J.); and the ÚNKP-19-3 New National Excellence Program of the Ministry for Innovation and Technology (to K. H.). The authors thank the help of Emese Várkonyi, Csenge Török, and Noémi Éltető in data acquisition.
Competing Interests
The authors do not have any actual or potential conflicts of interest.
Author Contribution
K.H. analyzed data and wrote the manuscript; Zs.K. designed the experiment, supervised data analysis, and wrote the manuscript, Á.T. designed the experiment, supervised data analysis, and wrote the manuscript; V.Cs. provided intellectual support and wrote the manuscript; D.N.
designed and supervised the experiment, provided financial and intellectual support, and wrote the manuscript; K.J. designed the experiment, supervised data analysis, and wrote the
manuscript; A.K. designed and supervised the experiment, analyzed data, supervised data analysis, and wrote the manuscript.
Data Accessibility
There are no linked research data sets for this submission because data will be made available on request.
References
Armstrong, B. C., Frost, R., & Christiansen, M. H. (2017). The long road of statistical learning research: past, present and future. Philosophical Transactions of the Royal Society B, 372, 20160047.
Beaulieu, C., Bourassa, M.-È., Brisson, B., Jolicoeur, P., & De Beaumont, L. (2014).
Electrophysiological correlates of motor sequence learning. BMC Neuroscience, 15(1), 102. https://doi.org/10.1186/1471-2202-15-102
Bernstein, P. S., Scheffers, M. K., & Coles, M. G. (1995). “Where did I go wrong?” A psychophysiological analysis of error detection. Journal of Experimental Psychology.
Human Perception and Performance, 21(6), 1312–1322. https://doi.org/10.1037/0096-
1523.21.6.1312
Boldt, A., & Yeung, N. (2015). Shared Neural Markers of Decision Confidence and Error Detection. Journal of Neuroscience, 35(8), 3478–3484.
https://doi.org/10.1523/JNEUROSCI.0797-14.2015
Botvinick, M. M., Braver, T. S., Barch, D. M., Carter, C. S., & Cohen, J. D. (2001). Conflict monitoring and cognitive control. Psychological Review, 108(3), 624.
Carter, C. S., Braver, T. S., Barch, D. M., Botvinick, M. M., Noll, D., & Cohen, J. D. (1998).
Anterior cingulate cortex, error detection, and the online monitoring of performance.
Science, 280(5364), 747–749.
Coles, M. G. H., Scheffers, M. K., & Holroyd, C. B. (2001). Why is there an ERN/Ne on correct trials? Response representations, stimulus-related components, and the theory of error-processing. Biological Psychology, 56(3), 173–189. https://doi.org/10.1016/S0301- 0511(01)00076-X
Danielmeier, C., & Ullsperger, M. (2011). Post-Error Adjustments. Frontiers in Psychology, 2, 233. https://doi.org/10.3389/fpsyg.2011.00233
Delorme, A., Sejnowski, T., & Makeig, S. (2007). Enhanced detection of artifacts in EEG data using higher-order statistics and independent component analysis. NeuroImage, 34(4), 1443–1449. https://doi.org/10.1016/j.neuroimage.2006.11.004
Dutilh, G., Van Ravenzwaaij, D., Nieuwenhuis, S., Van der Maas, H. L. J., Forstmann, B. U.,
& Wagenmakers, E. J. (2012). How to measure post-error slowing: A confound and a simple solution. Journal of Mathematical Psychology, 56(3), 208–216.
https://doi.org/10.1016/j.jmp.2012.04.001
Dutilh, G., Vandekerckhove, J., Forstmann, B. U., Keuleers, E., Brysbaert, M., &
Wagenmakers, E. J. (2012). Testing theories of post-error slowing. Attention, Perception, and Psychophysics, 74(2), 454–465. https://doi.org/10.3758/s13414-011-0243-2
Endrass, T., Reuter, B., & Kathmann, N. (2007). ERP correlates of conscious error recognition: aware and unaware errors in an antisaccade task. European Journal of Neuroscience, 26(6), 1714–1720. https://doi.org/10.1111/j.1460-9568.2007.05785.x
Falkenstein, M., Hohnsbein, J., Hoormann, J., & Blanke, L. (1991). Effects of crossmodal divided attention on late ERP components. II. Error processing in choice reaction tasks.
Electroencephalography and Clinical Neurophysiology, 78(6), 447–455.
https://doi.org/10.1016/0013-4694(91)90062-9
Ferdinand, N. K., Mecklinger, A., & Kray, J. (2008). Error and deviance processing in
implicit and explicit sequence learning. Journal of Cognitive Neuroscience, 20(4), 629–
642. https://doi.org/10.1162/jocn.2008.20046
Ferdinand, N. K., Rünger, D., Frensch, P. A., & Mecklinger, A. (2010). Event-related potential correlates of declarative and non-declarative sequence knowledge.
Neuropsychologia, 48(9), 2665–2674.
Gehring, W. J., Goss, B., Coles, M. G. H., Meyer, D. E., & Donchin, E. (1993). A Neural System for Error Detection and Compensation. Psychological Science, 4(6), 385–390.
https://doi.org/10.1111/j.1467-9280.1993.tb00586.x
Gehring, W. J., Goss, B., Coles, M. G. H., Meyer, D. E., & Donchin, E. (2018). The Error- Related Negativity. Perspectives on Psychological Science, 13(2), 200–204.
https://doi.org/10.1177/1745691617715310
Hajcak, G., Moser, J. S., Yeung, N., & Simons, R. F. (2005). On the ERN and the
significance of errors. Psychophysiology, 42(2), 151–160. https://doi.org/10.1111/j.1469- 8986.2005.00270.x
Holroyd, C. B., & Coles, M. G. H. (2002). The neural basis of human error processing:
reinforcement learning, dopamine, and the error-related negativity. Psychology Revue, 109, 679–709. https://doi.org/10.1037//0033-295X.109.4.679
Holroyd, C. B., Krigolson, O. E., Baker, R., Lee, S., & Gibson, J. (2009). When is an error not a prediction error? An electrophysiological investigation. Cognitive, Affective and Behavioral Neuroscience, 9(1), 59–70. https://doi.org/10.3758/CABN.9.1.59
Kóbor, A., Horváth, K., Kardos, Z., Takács, Á., Janacsek, K., Csépe, V., & Nemeth, D.
(2019). Tracking the implicit acquisition of nonadjacent transitional probabilities by ERPs. Memory & Cognition, 47, 1546–1566.
Kóbor, A., Takács, Á., Kardos, Z., Janacsek, K., Horváth, K., Csépe, V., & Nemeth, D.
(2018). ERPs differentiate the sensitivity to statistical probabilities and the learning of
sequential structures during procedural learning. Biological Psychology, 135, 180–193.
https://doi.org/10.1016/J.BIOPSYCHO.2018.04.001
Maier, M. E., Di Pellegrino, G., & Steinhauser, M. (2012). Enhanced error-related negativity on flanker errors: Error expectancy or error significance? Psychophysiology, 49(7), 899–
908. https://doi.org/10.1111/j.1469-8986.2012.01373.x
Maier, M. E., & Steinhauser, M. (2016). Error significance but not error expectancy predicts error-related negativities for different error types. Behavioural Brain Research, 297, 259–267. https://doi.org/10.1016/j.bbr.2015.10.031
Maier, M. E., Yeung, N., & Steinhauser, M. (2011). Error-related brain activity and adjustments of selective attention following errors. NeuroImage, 56(4), 2339–2347.
https://doi.org/10.1016/j.neuroimage.2011.03.083
Meyer, A., Riesel, A., & Proudfit, G. H. (2013). Reliability of the ERN across multiple tasks as a function of increasing errors. Psychophysiology, 50(12), 1220–1225.
https://doi.org/10.1111/psyp.12132
Miyawaki, K., Sato, A., Yasuda, A., Kumano, H., & Kuboki, T. (2005). Explicit knowledge and intention to learn in sequence learning: an event-related potential study.
Neuroreport, 16(7), 705–708.
Nemeth, D., Janacsek, K., & Fiser, J. (2013). Age-dependent and coordinated shift in performance between implicit and explicit skill learning. Frontiers in Computational Neuroscience, 7, 147. https://doi.org/10.3389/fncom.2013.00147
Nieuwenhuis, S., Ridderinkhof, R. K., Blom, J., Band, G. P. H., & Kok, A. (2001). Error- related brain potentials are differentially related to awareness of response errors:
Evidence from an antisaccade task. Psychophysiology, 38(5), 752–760.
https://doi.org/10.1017/S0048577201001111
Oldfield, R. C. (1971). The assessment and analysis of handedness: The Edinburgh inventory.
Neuropsychologia, 9(1), 97–113. https://doi.org/10.1016/0028-3932(71)90067-4
Olvet, D. M., & Hajcak, G. (2009). The stability of error-related brain activity with increasing trials. Psychophysiology, 46(5), 957–961. https://doi.org/10.1111/j.1469-
8986.2009.00848.x
Overbeek, T. J. M., Nieuwenhuis, S., & Ridderinkhof, K. R. (2005). Dissociable Components of Error Processing. Journal of Psychophysiology, 19(4), 319–329.
https://doi.org/10.1027/0269-8803.19.4.319
Pontifex, M. B., Scudder, M. R., Brown, M. L., O’Leary, K. C., Wu, C.-T., Themanson, J. R.,
& Hillman, C. H. (2010). On the number of trials necessary for stabilization of error- related brain activity across the life span. Psychophysiology, 47(4), 767–773.
https://doi.org/10.1111/j.1469-8986.2010.00974.x
Ridderinkhof, K. R., Ramautar, J. R., & Wijnen, J. G. (2009). To P E or not to P E : A P3-like ERP component reflecting the processing of response errors. Psychophysiology, 46(3), 531–538. https://doi.org/10.1111/j.1469-8986.2009.00790.x
Rüsseler, J., Kuhlicke, D., & Münte, T. F. (2003). Human error monitoring during implicit and explicit learning of a sensorimotor sequence. Neuroscience Research, 47(2), 233–
240. https://doi.org/10.1016/S0168-0102(03)00212-8
Rüsseler, J., Münte, T. F., & Wiswede, D. (2018). On the influence of informational content and key-response effect mapping on implicit learning and error monitoring in the serial reaction time (SRT) task. Experimental Brain Research, 236(1), 259–273.
https://doi.org/10.1007/s00221-017-5124-z
Rüsseler, J., & Rösler, F. (2000). Implicit and explicit learning of event sequences: evidence for distinct coding of perceptual and motor representations. Acta Psychologica, 104(1), 45–67. https://doi.org/10.1016/S0001-6918(99)00053-0
Simons, R. F. (2010). The way of our errors: Theme and variations. Psychophysiology, 47(1),