Abstract
Work on tyre pressure regulators has hitherto paid little attention to energy consumption. Energy use depends on how frequently and over how wide a range the pressure is changed. Larger tyres also require more energy for inflation. Consequently, care must be taken in choosing the tyre pressure and the route taken, avoiding inappropriate types of road. Since the physical properties of the soil are partially dependent on the weather, current soil condition on terrain routes should be properly considered when setting the tyre pressure.
Keywords
tyre pressure regulator, tyre load capacity, contact surface, specific ground pressure, radial
1. Introduction
Many agricultural machinery manufacturers now offer tyre pressure regulators for their products. A pressure regulator inflates tyres to pre-set pressures either at the press of a button or automatically, using GPS signals. None of these systems, however, take account of current road conditions, for example, after sustained rain or drought. The best basis for setting tyre pressures is the data provided by the manufacturer. Tyre catalogues carry graphs of tyre load capacity against pressure at various travel speeds, from which the appropriate pressure may be read. At present, the effect of road conditions is considered only in distinguishing between rigid track (travel on a public road) and deforming track (on terrain). On a rigid track, the tyre pressure is set as high as possible so as to reduce rolling resistance and prevent tyre wear. This is comparable to tyre pressure optimisation systems for passenger cars, involving tyre pressure monitors or automatic pressure regulation [1]. On a deforming track, the aim is to reduce the inflation pressure as far as possible, which reduces the specific ground pressure and thus the energy required for travel [2, 3]. Furthermore, appropriate tyre pressure improves tractive efficiency [4]. The benefits of the tyre pressure regulator are thus realised in the form of fuel savings. Little is said, however, about the energy consumption of the pressure regulator. Clearly, the higher the frequency and the wider the range of tyre pressure changes, the less energy savings there will be. Furthermore, the larger the tyre, the more energy is required to inflate it.
Since the relation between ground pressure and sinkage is described by a saturation curve, reducing the tyre pressure to its lowest setting is not absolutely necessary. After a certain point, the increase in contact area with decreasing pressure is so small as to achieve no significant improvement in soil compaction and tractive force. Re-inflation of the tyre, however, requires a substantial amount of energy.
Our aim is therefore to minimise the pressure difference in the tyres when travelling on roads and on terrain, by taking account of current soil conditions.
Theoretical energy requirement for change of tyre pressure.
We determine the theoretical energy requirement of a 710/75 R42 tyre, assuming constant temperature and tyre volume.
Profile width: B = 71 cm Profile height: H = 53.3 cm Tyre diameter: D = 213.3 cm Tyre air volume:
Pressure range applicable to tyre (from catalogue): 0.5–1.8 bar Tyre energy at lowest pressure:
Tyre energy at highest pressure:
Thus, energy required for inflation:
This is the energy used for a cycle of one inflation and one deflation. For an axle with two such tyres, the energy required for a cycle involving a change in pressure of 1 bar is 298 kJ. This corresponds to the energy provided by 7 g of diesel fuel. In practice, the energy expended is higher than this theoretical value because it includes losses in the inflation system.
2. Determination of the load capacity of the tyre
The load capacity of the tyre is determined, where possible, from the manufacturer’s catalogue. Otherwise, it may be calculated 66
HUNGARIAN AGRICULTURAL ENGINEERING N° 34/2018 66-69
Published online: http://hae-journals.org/
HU ISSN 0864-7410 (Print) / HU ISSN 2415-9751(Online) DOI: 10.17676/HAE.2018.34.66
Research Letter
PRESSURE REGULATION IN PNEUMATIC TRACTOR TYRES
Author(s):
Gy. Pillinger – L. Máthé – P. Kiss Affiliation:
Department of Automotive Technology, Szent István University, Páter K. u. 1., Gödöllő, H-2103, Hungary Email address:
pillinger.gyorgy@gek.szie.hu
PERIODICAL OF THE COMITTEE OF AGRICULTURAL AND BIOSYSTEM ENGINEERING OF
THE HUNGARIAN ACADEMY OF SCIENCES and
SZENT ISTVÁN UNIVERSITY Faculty of Mechanical Engineering Received: 2017.10.17.; Accepted: 2018.12.17.
(1)
from a knowledge of the tyre dimensions and operating circumstances, using the following formula [5]:
Speed factor:
Tyre pressure factor:
T - tyre load capacity, [kg]
B - tyre width, [m]
D - tyre diameter, [m]
cv- speed factor, [-]
cp- tyre pressure factor, [-]
p- tyre pressure, [bar].
Table 1. Values of variables
3. Determination of specific ground pressure under tyre After obtaining the load capacity of the tyre, the next step is to determine the specific ground pressure under the tyre, for which we also use the dimensions and operating parameters of the tyre.
The empirical formula used does not apply to deforming soil, but minor sinkage only slightly increases the contact area, and so – if z/D ≤ 0.05 – the following formula may be used to a good approximation [6]:
In addition to the tyre load capacity and the ground pressure under the tyre, we need the value of a quantity that characterises the current condition of the soil from which we may calculate its bearing capacity. The Saakyan formula, which relates specific ground pressure to soil condition, may be used to obtain the soil bearing factor.
where:
k soil bearing factor, [Pa]
z soil deformation, [cm]
de equivalent pressure plate diameter, [cm]
n1 soil dependent constant (for loamy sand soil: 0.8) [-].
The equivalent diameter is calculated from the contact area, which is either measured or calculated, the latter involving the empirical relation:
where:
ΔrRtyre deformation, [cm]
A contact area, [cm2].
The most convenient method of determining tyre deflection or deformation is direct measurement, allowing contact area to be obtained using Equation (7). Tyre deformation may also be calculated, however, by the empirical [7]:
The equivalent diameter is:
The ratio z/Dis the depth to which the wheel has sunk into the soil relative to its diameter. A high z/Dvalue thus means that the wheel has sunk deep into the soil. This implies that, for the same specific ground pressure, wheel sinkage decreases with increasing soil bearing factor. This gives the name of the factor k. Conversely, for the same sinkage, specific ground pressure increases with k, meaning that the soil bears a greater load.
Therefore, the soil bearing factor must be set to the highest possible value by adjusting σand de, or rather by setting tyre pressure and load, because σand deare also functions of tyre pressure. This is possible because the bearing capacity of a soil is not simply an inherent property but a function of the interaction, i.e. the size of the contact area.
These relations allow tyre load capacity to be plotted against tyre pressure:
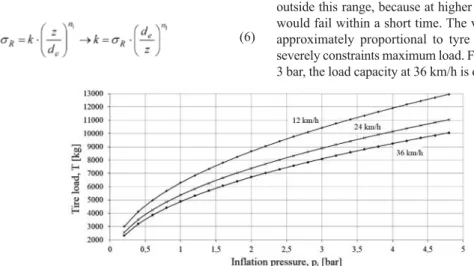
Figure 1 shows the load capacity of a 710/75 R42 tyre against tyre inflation pressure, calculated using Equation (2), at travel speeds of 12, 24 and 36 km/h. The pressure range must lie within the working range of the tyre. There is no sense in investigating outside this range, because at higher or lower pressures, the tyre would fail within a short time. The variation of load capacity is approximately proportional to tyre pressure. Increasing speed severely constraints maximum load. For example, for a pressure of 3 bar, the load capacity at 36 km/h is only 78% of that at 12 km/h.
67 (2)
(3)
(8)
(9) (4)
(5)
(6)
(7)
Figure 1. Load capacity of 710/75 R42 tyre at various speeds
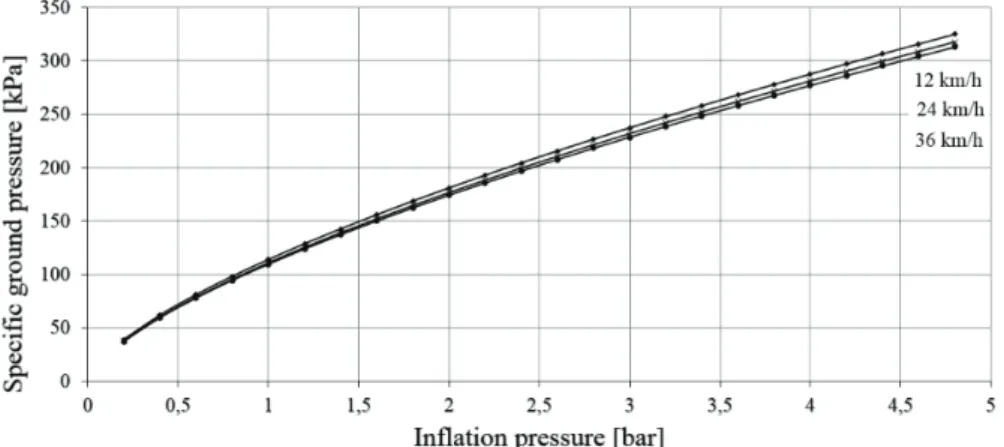
Figure 2 shows the specific ground pressure calculated using Equation (5) at the loads calculated above, again for speeds of 12, 24 and 36 km/h. As for load, the ground pressure curve is linear to a good approximation, but the speed has much less effect. At 3 bar, the difference is approximately 4%. The main effect is that of change of load, because in Equation (5), the speed
has no direct presence. Since field measurements may have errors of more than 5%, this change is difficult to detect.
Figure 3 shows the soil bearing factor against soil deformation, using the specific ground pressure values. The bearing factor clearly varies more steeply in the 0–4.8 cm range than in the 7.8–
12 cm range.
68
Figure 2. Specific ground pressure at maximum load.
Figure 3. Soil bearing factor as a function of soil deformation for a 710/75 R42 tyre.
4. Conclusions
Using known tyre parameters and operational parameters, and for specific speeds, the graph of tyre pressure vs. tyre load may be constructed from Equation (2), and that of tyre pressure vs.
specific ground pressure from Equation (5).
1.From these graphs, we can read off the maximum load from a given tyre pressure or the tyre pressure applicable for a given load, at the relevant speed. The graph thus tells us the required change in pressure (Figure 1).
2.Knowing the maximum ground pressure for the soil, we can obtain the corresponding tyre pressure (Figure 2). This also tells us the required pressure change.
3.The soil bearing capacity may be obtained from the rut depth using Figure 3.
With regular data collection, further comparisons and analyses could be made from the bearing factor. Possible examples are the comparison of bearing factor values for different fields, the investigation of sensitivity of bearing factors to changes in moisture content in specific fields, and the determination of the relationship between tyre pressure and bearing factor. Given the wide scatter of soil physical characteristics and the diversity of operational circumstances, individual measurements for each field are required to determine the parameters precisely.
Knowing these, it is possible to ensure that the tyre pressure regulator is always set to the appropriate level. The savings offered by the pressure regulator, however, can to some extent be wasted by overuse, and so we must also control the frequency and magnitude of changes.
References:
[1] Wadmare, A. V., Pandure, P. S.: 2017. Automatic Tire Pressure Controlling and Self Inflating System: A Review. IOSR Journal of Mechanical and Civil Engineering, pp. 1-5.
http://dx.doi.org/10.9790/1684-17010020105
[2] Hajdú, J.: 2014. Központi guminyomás-szabályozás előnyei az erőgépeken [Advantages of tyre pressure regulation in agricultural tractors]. Mezőgazdasági Technika. pp. Vol. 14. No.
7. 34-35.
[3] Varga, V.: 2017. Gumiabroncs légnyomásának szabályozása mezőgazdasági gépeknél [Regulation of tyre pressures in agricultural machinery]. Agrofórum Online. Link:
http://agroforum.hu/archivum/2017-aprilis/gumiabroncs- legnyomasanak-szabalyozasa-mezogazdasagi-gepeknel [4] Kayisoglu, B., Engin, Y., Dalmis, I. S., Akdemir, B., Bayhan, Y., Kullukcu, A.: 2014. Developing an Automatic Tire
Pressure Control System To Improve the Tractive Efficiency of Tractors. Journal of Agricultural Machinery Science, Vol. 10. 3.
pp. 253-259.
[5] Komándi, Gy.:1974. A belapulás, a felfekvési méret és teherbíró képesség meghatározása betonpályán, fúvott gumiab - ron csok nál [Determination of flattening, contact area and bearing capacity on concrete track with pneumatic tyres]. Járművek, Mezőgazdasági Gépek, Vol. 21. No. 12. pp. 447-451.
[6] Komándi, Gy.: 1999. An evaluation of the concept of rolling resistence. Journal of Terramechanics. Vol. 36. No. 3. pp. 159- 166. http://dx.doi.org/10.1016/S0022-4898(99)00005-1 [7] Laib, L.: 2002. Terepen mozgó járművek [Vehicles travelling on terrain]. Szaktudás Kiadó Ház, Budapest.
69