A Type-2 Fuzzy-based Approach to the Minnesota Code
Norbert Sram, Márta Takács
Óbuda University
Bécsi út 96/b, H-1034 Budapest, Hungary
E-mail: sramm.norbert@phd.uni-obuda.hu, takacs.marta@nik.uni-obuda.hu
Abstract: Cardiovascular diseases are still among the most common causes of death.
Online and automated diagnostic solutions are considered as a possible remedy. In this paper, the authors present one such solution, which is based on the Minnesota Code and type-2 fuzzy for identifying cardiovascular diseases. The presented diagnostic system is case studied on various ECG data sets and compared to diagnostic results provided by physicians.
Keywords: fuzzy; type-2 fuzzy; interval fuzzy; Minnesota Code
1 Introduction
Cardiovascular diseases are some of the most common causes of death. Based on the World Health Organization reports [1], about 30% of deaths are caused by either Ischemic Heart Disease or stroke. The prediction of sudden cardiac deaths is still a major concern and remains mostly unsolved [2, 3]. It is now well- established that classifications based on clinical circumstances can be misleading and often impossible because 40% of sudden deaths may be unwitnessed [4].
There are approaches that try to improve this situation through online automated and expert system based setups [20, 21].
1.1 Minnesota Code
The Minnesota Code [5] is used as a starting point for providing automated monitoring and diagnostic systems for predicting cardiovascular diseases. The Minnesota Code [5] is a classification system for the electrocardiogram that utilizes a defined set of measurement rules to assign specific numerical codes according to the severity of the ECG (Electrocardiography) findings. As for the definition, the Minnesota Code is a structured list of rules that examines certain characteristics of ECG waveforms. The input for the Minnesota Code diagnostic
system is a heartbeat cardiac cycle (ECG signal shown on Figure 1) and the related waveform annotations (P, Q, R, S, T) for all the 12 ECG leads (I, II, III, V1, V2, V3, V4, V5, V6, aVL, aVF, aVR). The diagnostic system studies the various aspects (e.g. length, amplitude) of the waveforms to produce a result. The analysis of the inputs is done with diagnostic rules. One such rule is shown on Figure 2, where the two aspects (Q/R amplitude, Q duration) of the ECG signal are compared to the optimal values (1/3, 0.03) defined by the Minnesota Code.
Figure 1
ECG waveform with the corresponding annotations
Figure 2
Minnesota Code diagnostic rule definition
The outputs of the Minnesota diagnostic system are "true"/"false" statements for various diagnostic rules. The boolean values of various diagnostic rules are used to produce the diagnosis (a cardiovascular disease).
The Minnesota Code combines three major elements: a set of measurement rules, a classification system for reporting ECG findings and a set of exclusion rules.
The relationship between the three major sets is vaguely defined. Although the Minnesota Code has some known weaknesses, the authors have been investigating various approaches in the past to improve those, such as incorporating fuzzy logic [5] and representing the decision rule set as Ontology [6]. In this paper, the authors apply an interval type-2 fuzzy logic based approach for handling uncertainties in the diagnostic system since it has been shown to be a solution in
other domains [16, 17, 19]. A case study is also performed to show that it is a viable approach in terms of automated diagnostic solutions.
1 Interval-based Fuzzy Sets
Compared to regular (type-1) fuzzy sets, interval type-2 fuzzy set can have intervals as a result of their membership value, which defines the constraints of the membership:
𝐴: 𝑋 → 𝐸([0,1])
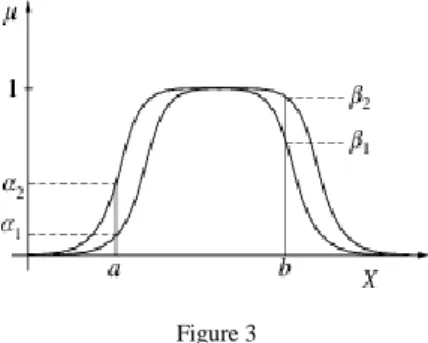
Membership functions defined in this way are called interval based fuzzy sets, which can be represented using two functions, an upper and a lower curve as shown in Figure 3.
Figure 3 An interval based fuzzy set
Using interval based fuzzy sets, an uncertainty factor can be paired to the members of the set [8]. The reliability of a system increases with the usage of interval based sets, while the precisions decreases. The usage of interval sets also has a significant impact on the computational complexity [9].
Interval based fuzzy sets can be further generalized if fuzzy sets are used instead as intervals. Each interval itself can be a fuzzy set and it can assign another fuzzy set to each member of the fuzzy set as the value of membership. Fuzzy sets defined in this way are 2nd order fuzzy sets, also called type-2 sets (see Figure 4).
These 2nd order fuzzy sets can be further generalized to 3rd and higher order fuzzy sets. In the case of 3rd order fuzzy sets, the membership values are 2nd order fuzzy sets.
Figure 4
A general type-2 fuzzy set, where FOU stands for “field of uncertainty” [10]
As already stated, the interval type-2 fuzzy is a specialized case of the general type-2 fuzzy, where the 3rd dimension does not contain fuzzy based values. The interval can be described with an upper and lower bound as shown in Figure 5.
a b c d e f
1
x Figure 5
Interval Type-2 fuzzy function The Type-2 fuzzy set seen in Figure 2 can be represented as:
𝑓(𝑥) = {𝑓𝑙𝑚(𝑥) = 𝑡𝑟𝑎𝑝𝑚𝑓(𝑥, 𝑏, 𝑐, 𝑑, 𝑒) 𝑓𝑢𝑚(𝑥) = 𝑡𝑟𝑎𝑝𝑚𝑓(𝑥, 𝑎, 𝑐, 𝑑, 𝑓)
Where f(x) is the value of uncertainty in the interval of [𝑓𝑙𝑚(𝑥), 𝑓𝑢𝑚(𝑥)] for the variable x. The representation of uncertainty in the following way means that the length of the interval is the indicator of uncertainty. The longer the interval, the more uncertain the value is.
2 Interval Type-2 Fuzzy Definitions of the Minnesota Code
The if-then rules are present in the case of type-2 fuzzy as well, however the antecedent and consequent sets are type-2 sets. Type-2 fuzzy logic can be applied when there is an uncertainty factor present. With this approach, crisp values that constitute the diagnostic logic are represented as type-2 fuzzy sets. Similar to the type-1 fuzzy logic, the type-2 fuzzy also has a fuzzification step, rules, an inference step and an output processor. The output processor contains both the type-reducer and a defuzzification step. Based on the type-2 fuzzy logic, the crisp values defined by the Minnesota diagnostic code are represented with an upper and lower membership function. A unified approach is applied for the fuzzification of all crisp values. In each case, a 10% tolerance zone is applied to the original value [6]. The tolerance zone is defined with two membership functions based on the Minnesota code crisp values. For modeling the Minnesota Code diagnostic rules with type-2 fuzzy, the authors used interval type-2 fuzzy sets, where, for a specific waveform input, the output is an interval defined by the lower and upper membership functions. The lower membership function of a type- 2 definition represents the value that is 5% below the optimal value, while the upper membership function is above the optimal value by 5%. Thus, the 2 membership functions form a range, where the optimal value means no risk. As an input diverges from the optimal value in the defined tolerance zone, the length of the interval representing the uncertainty factor also increases.
Figure 6
The fuzzy type-2 interval definition of one possible Q waveform state
The interval type-2 fuzzy function shown in Figure 6 has the following definition:
𝑓(𝑥) = { 𝑓𝑙𝑚, 𝑠𝑚𝑓(𝑥, 0.035,0.05) 𝑓𝑢𝑚, 𝑠𝑚𝑓(𝑥, 0.04,0.05) where the smf function is the type-1 S-shaped fuzzy function.
The interval type-2 fuzzy function shown in Figure 7 can be defined as:
𝑓(𝑥) = { 𝑓𝑙𝑚, 𝑡𝑟𝑎𝑝𝑚𝑓(𝑥, 0.03, 0.04, 0.05, 0.06) 𝑓𝑢𝑚, 𝑡𝑟𝑎𝑝𝑚𝑓(𝑥, 0.035,0.04,0.05,0.55)
The used trapmf function corresponds to the trapezoid type-1 fuzzy membership function. The above definitions show that the type-1 fuzzy membership functions can be used to define the interval type-2 fuzzy functions, where 𝑓𝑙𝑚 represents the lower membership function, while 𝑓𝑢𝑚 the upper membership function.
Figure 7
The Fuzzy Type-2 interval definition of one possible Q waveform state
2.1 Defuzzification
The defuzzification of a type-2 membership function does not produce a crisp value that can be used by the Minnesota code. In the case of an interval type-2 function, the result of the function is an interval, as show in Figure 8.
x fum flm
Interval
Figure 8
The result of an interval type-2 fuzzy function
In order to be able to execute the diagnostic steps outlined by the Minnesota Code, the intervals need to be reduced to a single truth value. This can be done by applying a type-reducer to the given interval. There are various approaches and type-reducers that one can choose from [18]. The chosen type-reduction method affects the diagnostic output. Another possibility is to introduce a new type- reduction algorithm, which is defined for the specific use.
In the case of a MISO (Multi input single output) inference system, the rules are of the type 𝑖𝑓 𝑥1𝑖𝑠 𝐴1 𝑎𝑛𝑑 𝑥2𝑖𝑠 𝐴2, … 𝑥𝑛𝑖𝑠 𝐴𝑛 𝑡ℎ𝑒𝑛 𝑦 𝑖𝑠 𝐵 where the input is 𝑥1∗, … 𝑥𝑛∗. The firing rate for an interval is[𝑓𝑙𝑚𝑘(𝑥𝑘∗), 𝑓𝑢𝑚𝑘 (𝑥𝑘∗)] (𝑘 = 1, 𝑛). As stated earlier, the computational complexity with the general type-2 reduction approaches is high. Because of this, the authors introduced the following 2 methods for the specific use case of the Minnesota Code. The following two approaches are used for aggregating and reducing the multi parameter diagnostic rules:
1st method: In the first case, the type-reduction step is applied to produce a crisp value then produced crisp values aggregated.
2nd method: The second method aggregates the result intervals of the Type-2 membership functions, after this step, a type-reduction is applied to produce a crisp value.
2.2 Reduced Value Aggregation (1
stmethod)
The method of reduced value aggregation provides a value that can be used by the Minnesota code by applying type-reduction to the intervals and then aggregating the results of the type-reductions.
In the process of evaluating a waveform parameter, the degree of truth will be the average of the interval formed by the upper and lower membership functions. If the diagnostic rule requires the processing of multiple parameters (for example,
the Q waveform length and R amplitude), the diagnostic rules degree of truth is determined by processing each input separately and aggregating the produced averages. In this case, the type-reduction is performed for each parameter and then the aggregation applied to the partial results formed by the type-reduction. One of the characteristics of this method (the 1st method) is that a single parameter can have a significant impact on the evaluation of the diagnostic rule. This is especially the case, when the minimum operator is used for aggregation.
l
1u
1l
2u
2𝐷𝑜𝑓 = 𝑇(𝑢1+ 𝑙2 1; 𝑢2+ 𝑙2 2)
2.3 Type-Reduction of Aggregated Intervals (2
ndmethod)
The given [𝑓𝑙𝑚𝑘(𝑥𝑘∗), 𝑓𝑢𝑚𝑘 (𝑥𝑘∗)] ∈ 𝑅 intervals are aggregated to produce an uncertainty interval. The type-reduction of the produced uncertainty interval provides the firing rate.
For the given [𝑓𝑙𝑚𝑘(𝑥𝑘∗), 𝑓𝑢𝑚𝑘 (𝑥𝑘∗)] ∈ 𝑅 intervals, the following relationships are possible:
l1 u1 l2 u2
𝑙1< 𝑢1< 𝑙2< 𝑢2 𝐷𝑜𝑓 = 𝑢1+ 𝑙2 2
l1 l2 u1 u2
𝑙1< 𝑙2< 𝑢1< 𝑢2 𝐷𝑜𝑓 = 𝑙2+ 𝑢1 2
l1 = l2 u1 = u2
𝑙1= 𝑙2< 𝑢1= 𝑢2 𝐷𝑜𝑓 = 𝑢1+ 𝑙2 1= 𝑢2+ 𝑙2 2
l1 l2 u2u1
𝑙1< 𝑙1< 𝑢2< 𝑢1
𝐷𝑜𝑓 = 𝑙2+ 𝑢2
2
The diagnostic results can be produced without the application of a step-by-step type-reduction. In the case of complex diagnostic rules, type-2 fuzzy sets are used.
In this case the given intervals are aggregated until a single interval is produced.
The aggregation of intervals happens based on the relationship between the two aggregated intervals. In case there is an overlap between the intervals representing
the diagnostic parameter, the overlapping interval will be the result of the aggregation. If there is no overlap, the interval formed by the distance between the two diagnostic parameter intervals will be the result of the aggregation. The distance is formed by the smaller intervals upper bound and the larger intervals lower bound. The type-reduction of the aggregation forms the result of the diagnostic rule.
2.4 Consistency Level
The outputs of the Minnesota diagnostic system are "true"/"false" statements for various diagnostic rules. The boolean values of various diagnostic rules are used to produce the diagnosis (a cardiovascular disease). Because of this, the degree of truth values produced from the type-2 fuzzy sets need to be converted to boolean values. The authors introduced a consistency level for performing the conversion.
For a given membership function A, with a consistency level of α, the output set D consists of all samples from A, for which the predicate A(x) is greater than α holds true. The elements of set D are considered to have a true value when mapped to a boolean domain. The consistency level value α is an input property of the fuzzy based diagnostic system. By raising the value of α, the strictness of the fuzzy based diagnostic system increases, by decreasing, it allows more uncertainty.
2.4.1 General Definition of the Consistency Level
Let 𝐼1 ∈ [0,1] be the output of the reference decision system and 𝐼2 ∈ [0,1] the output of the experimental decision system. The consistency level is the number 𝑎 ∈ [0,1] that is used in the following way to classify the results:
If 𝑎 < |𝐼2 − 𝐼1| than the results given by the two decision systems are inconsistent, meaning they differ in the outcome. In such a case a new decision method or decision system parameter tuning is advised to have an unambiguous outcome.
If 𝑎 > |𝐼2 − 𝐼1| that the two results are consistent and the outcome of the reference decision system is accepted.
The generalized consistency domains can be defined by a [0,1] × [0,1] domain in the following way (Figure 9):
I2
I1 = 1 I1 I2 = 1
Consistent
Inconsistent Inconsistent
I2 = I1 + a
I2 = I1 - a a
a
Figure 9
Generalized consistency domains
2.5 Extension of the Minnesota Code ontology with Type-2 Definitions
Type-2 fuzzy definitions of various waveform parameters can be stored as ontology annotations coupled to the ontology concepts representing various waveform states. Possible solutions for adding fuzzy values to ontologies are outlined in the papers [11, 12] and previous work of the authors. The ontology annotations can contain both the type-1 and type-2 fuzzy value definitions using an XML structure that differentiates between the two. Figure 10 shows the relevant type-2 part of a definition, where type-1 membership function definitions are reused to define the interval type-2 set.
Figure 10
Interval type-2 definition of the Q waveform state
3 Case Study
For evaluating the effectiveness of various methodologies, the authors used three freely available datasets from PhysioNet [13]. These are the T-Wave Alternans Challenge Database (TWA database) [14], the PTB Diagnostic ECG Database (PTB database) [15] and St.-Petersburg Institute of Cardiological Technics 12- lead Arrhythmia Database (Incart database). These datasets contain ECG signal recordings for various anonymized patients along with the diagnosis produced by their physician. The datasets can serve as an input for evaluating the effectiveness of the proposed type-2 based diagnostic system. The evaluation of the samples found in these ECG databases has been conducted with the classical Minnesota Code expert system and the two type-2 based fuzzy solutions. The results of the classical expert system based approach are used as a reference. For all ECG recordings, the Q and QS rule groups of the Minnesota Code have been executed.
During the evaluation, the results of a single sample are compared to the results produced by the mentioned methodologies. The authors evaluated the impact of the cutoff point on the diagnostic results of the fuzzy based solutions in the case of each sample. The values of the cutoff point were chosen from a predefined set of values in order to have defined points of comparison.
3.1 Results of the Incart Database
The evaluation of the Incart database produced 5265 entries for the Q and QS diagnostic rule groups. Of these entries, 28% back are "true" statements according to the classical approach. This means that in 28% of the cases the diagnostic rules fired since the defined criteria has been met. These 1484 (28%) entries are a sign of irregularities in the patient, a symptom of a cardiovascular disease.
Figure 11
Comparison of the “true” results for the Incart database
Figure 11 displays the number of diagnostic rules that fired ("true") for the fuzzy methodologies compared to the classic approach (baseline). The horizontal axis is the value of the consistency level. The vertical axis shows the number of diagnostic rules that fired for a specific consistency level. The figure shows the effect that the value of the consistency level has on the diagnostic output of the fuzzy based methodologies. For the evaluated fuzzy methodologies, the difference is negligible above the consistency level of 0.9. The comparison of "false"
diagnostic rules is presented in Figure 12. As the images show, the difference between the 2 fuzzy based diagnostic methods shows significant decreases if the value of the consistency level is above 0.5. By further increasing the value of the consistency level, the difference continues to decrease, as well.
Figure 12
Comparison of the “false” results for the Incart database
3.2 Results of the TWA Database
The processing of the TWA database results in 4980 diagnostic rule entries. Of all entries, 30% are "true", meaning a third of the diagnostic rules fired. This is the reference value produced by the classical, expert system based approach.
The behavior of the diagnostic methodologies for the TWA database is very similar to the one exhibited in the case of the Incart database. The difference between the results of the fuzzy methodologies decreases significantly at the cutoff value of 0.5. At higher cutoff values this difference becomes negligible as seen in Figure 13 and Figure 14.
Figure 13
Comparison of the “true” results for the TWA database
Figure 14
Comparison of the “false” results for the TWA database
3.3 Results of the PTB Database
The largest of the three used databases, the evaluation of the PTB database produces 37959 diagnostic rule entities. According to the classical system, 11507 (~30%) of these diagnostic rule entities are "true", hence, patients are showing the symptoms of some form of hearth diseases.
Figure 15
Comparison of the “true” results for the PTB database
Figure 16
Comparison of the “false” results for the PTB database
The behavior of the fuzzy diagnostic methodologies corresponds to the one observed in the case of the Incart and TWA databases. Figure 15 and Figure 16 underline this.
It can be deduced that the 2nd method (type-reduction of aggregated intervals) provides a more graceful handling for scenarios where one of the inputs of the diagnostic rules heavily influences the output towards the "false" spectrum. In these cases, the usage of interval distances acts as a type of counteract against bias where 1 input would determine the output. The 2nd method is more tolerant since the processing is done on the distance formed by the 2 intervals. This results in
coupling higher truth factors to the diagnostic rule outputs. With this approach, small deviations are less likely to influence the diagnostic output. Of course, the value of the consistency level still plays a significant role in the tolerance of the system. The 1st method (aggregated, type-reduced intervals) is closer to the original approach of the Minnesota Code, which evaluates the inputs, without those biasing one another in any way.
3.4 Analysis of Diagnostic Outputs
Apart from the ECG data, the diagnostic conclusions of the physicians are also available for the PTB database. This information can be used to compare the results of various diagnostic methodologies for each patient to the one provided by their physician. Using the Minnesota Code diagnostic rule results, a diagnostic outcome can be provided based on a predefined mapping table. A part of such a mapping table can be seen in Table 1. With the diagnostic rules that fired, one can match a corresponding hearth disease. For example, if the results of a patient state that the diagnostic rule 1-1-1 is true, that given patient has a case of “Q wave Myocardial Infraction”. Using this, one can check the effectiveness of the present diagnostic system by comparing the diagnostic results provided by physicians.
Table 1
Prediction of hearth diseases based on the Minnesota Code rules ECG Categories Associated With Myocardial Infarction / Ischemia
Definition and Description Minnesota Code
Q wave MI Q wave MI; major Q
waves with or without ST-T abnormalities
1-1-x
Q wave MI; moderate Q
waves with ST-T
abnormalities
1-1-1 plus 4.1, 4.2
Isolated minor Q and ST- T abnormalities
Minor Q waves without ST - T abnormalities
1-3-x
Minor ST-T abnormalities 4-3, 4-4, 5-3, 5-4
In this section, the authors introduce some of the more insightful diagnostic cases of the PTB database that were identified by using the algorithms described in [11].
The first case to analyze is Patient 01. According to the diagnostic description, the patient had Myocardial infarction. The Minnesota Code states that Myocardial infarction or one of its specific cases can be diagnosed if the diagnostic rules 1.1.x, 1.2.x or 1.3.x are true (Table 1). The result of the 1.1.x rules are the same for classical and fuzzy based methodologies, however the 1.2.x and 1.3.x rule group results differ.
Table 2
Diagnostic differences in the case of Patient 01 Rule Classic approach Aggregated Type-
Reduced Intervals
Aggregated intervals
1.2.1 False 0.7 0.8954
1.3.1 False 0.7 0.9
Table 2 shows the type-2 fuzzy based results for Patient 01. This provides additional information related to the diagnostic outcome. Besides identifying that the patient has a case of Myocardial infarction, it also provides a hint at a more specific case. Using the result of the fuzzy diagnostic solution, it can be inferred that Patient 01 might have a case of ”Q wave Myocardial infarction” or ”Minor Q waves abnormalities”.
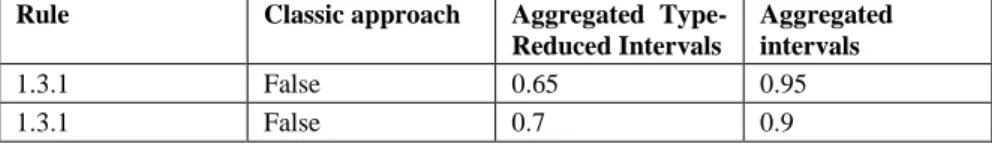
In the case of Patient 03, there are contradictions. The documented diagnostic outcome for the patient is ”Myocardial infarction”. With the Minnesota Code, this diagnostic outcome holds, if one of the 1.3.x rules fire. In the case of the rule 1.3.1, there are differences between the classical approach and the fuzzy based one. As can be seen in Table 3, the classical approach does not produce the same diagnostic output as the physicians’. On the other hand, the fuzzy diagnostic results are in line with the diagnosis reached by the physicians with an additional associated risk factor.
Table 3
Diagnostic differences in the case of Patient 03 Rule Classic approach Aggregated Type- Reduced Intervals
Aggregated intervals
1.3.1 False 0.65 0.95
1.3.1 False 0.7 0.9
In the case of Patient 18, there are numerous contradictions between the type-2 and the classical approach. From the available 227 processed samples, there is a difference in 39 cases. That is 17% difference for the processing of a single diagnostic rule group. Table 4 shows that most of the type-2 fuzzy diagnostic results differ from the classic one and can be considered borderline cases [11].
The last 2 highlighted rows of Table 4 are an example for the weakness of the classical methodology.
Table 4
Highlighted diagnostic rule results of Patient 18 Rule Classic approach Aggregated Type-
Reduced Intervals
Aggregated intervals
1.2.2 False 0.7 0.7
1.1.1 False 0.9 0.975
1.1.1 False 0.78 0.94
1.2.2 False 0.85 0.85
1.1.1 False 0.975 0.99
1.3.3 False 0.55 0.85
1.2.1 False 0.97 0.99
1.1.1 False 0.975 0.97
1.3.3 False 0.55 0.85
1.2.1 False 0.97 0.99
1.1.1 False 0.975 0.97
1.1.2 False 0.985 0.985
1.3.1 False 0.85 0.949
1.2.1 False 1.0 1.0
1.2.2 False 1.0 1.0
In order to examine the cause of the difference in the last 2 cases, one needs to inspect the measured values (inputs) that caused this behavior. In the case of the highlighted rule 1.2.1, the measured value for the Q and R amplitude division is 0.34, which meets the expectation of the diagnostic rule, which states that Q/R amplitude ratio must be greater than or equal to 1/3. The other parameter used by 1.2.1 is the Q waveform length. According to the rule definition, the Q waveform length needs to be greater than or equal to 0.02s and less than 0.03s. The measured value of the waveform length is 0.03s, which does not meet the requirements of the rule definition. The advantages of the fuzzy methodologies are shown in these kinds of borderline cases.
Similar to the other patients, Patient 18 was also diagnosed with ”Myocardial infarction”. As stated earlier, in order to have the diagnostic conclusion of
”Myocardial infarction” in the Minnesota Code, rule 1.3.x must meet the requirements. However, in the case of the classical approach this is not met. With the fuzzy based approach and a reasonable consistency level (0.8-0.9), the same results are achieved as those provided by the physicians.
Conclusions
The fuzzy type-2 approach to the Minnesota Code algorithm provides the needed flexibility for the system and can act as guidance for the physicians in providing the diagnostic outcome for patients. Because of the hierarchical setup of the Minnesota code, various diagnostic decision trees might be affected by value of the consistency level. One of the advantages of the presented method is that with the modification of the consistency level, the potential diagnostic outcomes can be investigated, as well. The risk associated with a diagnostic result is inversely proportionate to the value of the consistency level.
The presented type-2 fuzzy based diagnostic method is an approach for improving the weakness of the original Minnesota code. Further improvements include the incorporation of decision trees based on the results of the various algorithms.
Predicting and using the right methodology for a given patient and diagnostic can be taken a step forward by including statistical steps.
References
[1] World Health Organization, "Annex Table 2: Deaths by Cause, Sex and Mortality Stratum in WHO Regions, Estimates for 2002", The world health report, 2004
[2] Engelstein ED, Zipes DP., “Sudden Cardiac Death”, The Heart, Arteries and Veins. New York, NY: McGraw-Hill; 1998:1081-1112.4
[3] Myerburg RJ, Castellanos A., “Cardiac Arrest and Sudden Death.”, Heart Disease: A Textbook of Cardiovascular Medicine. Philadelphia, Pa: WB Saunders; 1997:742-779
[4] de Vreede Swagemakers JJM, Gorgels APM, Dubois-Arbouw WI, van Ree JW, Daemen MJAP, Houben LGE, Wellens HJJ. “Out-of-Hospital Cardiac Arrest in the 1990’s: a Population-based Study in the Maastricht Area on Incidence, Characteristics and Survival”, J Am Coll Cardiol. 1997;
30:1500-1505
[5] Prineas, Ronald J., Crow, Richard S., Zhang, Zhu-ming, “The Minnesota Code Manual of Electrocardiographic Findings”, ISBN: 978-1-84882-777- 6
[6] Sram, N., Takacs, M., “Minnesota Code: A Fuzzy Logic-based Approach”, Proc. of the 11th International Symposium on Computational Intelligence and Informatics (CINTI), pp. 233-236, 2010, Budapest, Hungary, 2010 [7] Sram, N., Takacs, M., “An Ontology Model-based Minnesota Code”, Acta
Polytechnica Hungarica Vol. 12, No. 4, 2015
[8] Dongrui Wu, Jerry M. Mendel, „Uncertainty Measures for Interval Type-2 Fuzzy Sets”, Elsevier Information Sciences, Volume 177, Issue 23, December 2007
[9] Kóczy T. László, Tikk Domonkos, “Fuzzy rendszerek”, Typotex, ISBN 963 9132 55 1, 2001
[10] https://en.wikipedia.org/wiki/Type-2_fuzzy_sets_and_systems
[11] Sram, N., Takacs, M.,”Analysis of Fuzzy Logic Assisted Evaluation of the Minnesota Code”, Computational Cybernetics (ICCC), 2013 IEEE 9th International Conference, pp. 121-124
[12] Fernando Bobillo, Umberto Straccia, “Fuzzy Ontology Representation using OWL 2”, International Journal of Approximate Reasoning, 2011, pp.
1073-1094
[13] Goldberger AL, Amaral LAN, Glass L, Hausdorff JM, Ivanov PCh, Mark RG, Mietus JE, Moody GB, Peng C-K, Stanley HE. PhysioBank, PhysioToolkit, and PhysioNet: Components of a New Research Resource
for Complex Physiologic Signals. Circulation 101(23):e215-e220
[Circulation Electronic Pages;
http://circ.ahajournals.org/cgi/content/full/101/23/e215]; 2000 (June 13) [14] Moody GB, „The PhysioNet / Computers in Cardiology Challenge 2008: T-
Wave Alternans”, Computers in Cardiology 35:505-508; 2008
[15] Bousseljot R, Kreiseler D, Schnabel, A. Nutzungm “EKG-Signaldatenbank CARDIODAT der PTB über das Internet”, Biomedizinische Technik, Band 40, Ergänzungsband 1 (1995) S 317
[16] Nagy K., Takacs M.,”Type-2 Fuzzy Sets and SSAD as a Possible Application”, Acta Polytechnica Hungarica Vol. 5, No. 1, 2008
[17] Nagy, K., Divéki, S., Odry, P., Sokola, M., Vujičić, V.,”A Stochastic Approach to Fuzzy Control”, Acta Polytechnica Hungarica Vol. 9, No. 6, 2012
[18] J. M. Mendel, R. I. John, and F. Liu.,”Interval Type-2 Fuzzy Logic Systems Made Simple”, Trans. Fuz Sys. 14, 6 (December 2006), 808-821
[19] Hao Ying, ”General Interval Type-2 Mamdani Fuzzy Systems are Universal Approximators”, Fuzzy Information Processing Society, 2008.
NAFIPS 2008
[20] E. Tóth-Laufer, “Soft Computing-based Techniques in Real-Time Health Monitoring Systems”, in Proc. of the International Engineering Symposium at Bánki, Efficiency, Safety and Security (IESB 2013), Budapest, Hungary, November 19, 2013
[21] J. Min Kang, T. Yoo, H. Chan Kim, “A Wrist-Worn Integrated Health Monitoring Instrument with Tele-Reporting Device for Telemedicine and Telecare”, IEEE Transactions on Instrumentation and Measurement, Vol.
55, No. 5, October 2006, pp. 1655-1661, DOI: 10.1109/TIM.2006.881035