Citation:Khmeleva, G.A.;
Kurnikova, M.V.; Nedelka, E.; Tóth, B.I. Determinants of Sustainable Cross-Border Cooperation: A Structural Model for the Hungarian Context Using the PLS-SEM Methodology.Sustainability2022,14, 893. https://doi.org/10.3390/
su14020893 Academic Editors:
Joanna Kurowska-Pysz, Rui Alexandre Castanho and Luís Carlos Loures
Received: 5 December 2021 Accepted: 10 January 2022 Published: 13 January 2022 Publisher’s Note:MDPI stays neutral with regard to jurisdictional claims in published maps and institutional affil- iations.
Copyright: © 2022 by the authors.
Licensee MDPI, Basel, Switzerland.
This article is an open access article distributed under the terms and conditions of the Creative Commons Attribution (CC BY) license (https://
creativecommons.org/licenses/by/
4.0/).
sustainability
Article
Determinants of Sustainable Cross-Border Cooperation:
A Structural Model for the Hungarian Context Using the PLS-SEM Methodology
Galina Anatolievna Khmeleva1,* , Marina Viktorovna Kurnikova2, Erzsébet Nedelka3and Balázs István Tóth3
1 Department of World Economy, Samara State University of Economics, 443090 Samara, Russia
2 Department of Regional Economy and Management, Samara State University of Economics, 443090 Samara, Russia; mvkurnikova@gmail.com
3 Alexandre Lamfalussy Faculty of Economics, University of Sopron, HU-9400 Sopron, Hungary;
nedelka.erzsebet@uni-sopron.hu (E.N.); toth.balazs.istvan@uni-sopron.hu (B.I.T.)
* Correspondence: galina.a.khmeleva@yandex.ru
Abstract:The importance of this research stems from the need to ensure the sustainability of cross- border cooperation through a better understanding of its determinants and causal relationships.
While having common features and patterns, cross-border cooperation is always expressed through the relations of specific countries and peoples. Therefore, based upon the PLS-SEM methodology, the authors consider the fundamental factors influencing the external cooperation of Hungary’s transboundary regions. The advantage of the PLS-SEM method is that it enables researchers to simultaneously identify and approximate hidden connections between input data and to construct a regression model describing the relationship between input data. Despite widespread application in economic studies, the authors have not found the use of PLS-SEM for studying cross-border cooperation issues in the current scientific literature. The authors have built a model to assess the hidden factors of cross-border cooperation and to identify the indirect influence of certain factors. The novelty of the research is to identify the determinants of sustainable cross-border cooperation and the relationship between them in a multi-level system of cross-border interaction between businesses, people, and the State. In the Hungarian context, transport infrastructure and business travel are shown to have a direct positive impact on cross-border cooperation. For the first time, tourism and socio-economic conditions have been shown to have powerful but indirect impacts. This work could be the beginning of gathering new evidence on the determinants and causation of cross-border cooperation in the context of other countries. An important finding of the study is the growing importance of indicators of the new, post-industrial economy. As for recommendations, the authors focus on state, regional, and municipal support measures, awareness of the possibilities of cross- border cooperation, the need to develop e-commerce, and alternative energy as a modern basis for converting Hungary’s cross-border position into a competitive advantage.
Keywords:cross-border cooperation; structural model; PLS-SEM; international integration; sustainable;
Hungary; tourism; transport infrastructure; business trips
1. Introduction
Cross-border cooperation is one of the most important challenges for the sustainable development of a country. In EU countries, cross-border cooperation is seen as a way of solving common problems and making the best use of the potential of neighboring territories [1]. In general, within the framework of major economic unions, sustainable cross-border cooperation is a good way to strengthen foreign economic ties in the cultural, economic, technological, tourism, and environmental spheres [2–5]. The exchange of re- sources reduces differences in the standard of living of the population and the income levels of countries. Sustainable cross-border cooperation strengthens the economic capacity of
Sustainability2022,14, 893. https://doi.org/10.3390/su14020893 https://www.mdpi.com/journal/sustainability
countries involved in cross-border cooperation and provides a common basis for economic growth and well-being [6–9].
The multidimensional nature of cross-border cooperation makes it difficult to identify the determinants of cross-border cooperation. It is no accident that works on this topic attempt to explore certain aspects in greater depth. For example, improvements in the transport system are being considered, as they increase transport accessibility between countries [10–12]. The impact of socio-economic differences on the attractiveness of cross- border cooperation is being studied [13]. Tourism is the nexus of cross-border cooperation, as it provides personal insights into the traditions and cultures of people [14,15]. It is difficult to overemphasize the role of State-supported cross-border cooperation programs, which create the political and financial conditions for the systematic implementation of specific business and non-profit projects. Prioritization of government cross-border cooperation programs (innovation, digitization, renewable energy, and environmental issues) is intended to provide the basis for a transition to a new model of economic growth.
However, more evidence was needed to assess the reality.
A significant gap in the literature is the causal relationship of cross-border coopera- tion. In our view, there are several reasons for this. First, the multidimensional nature of cross-border cooperation makes it necessary to analyze factors of different nature (i.e., geo- graphical, cultural, social, economic, and political). This often requires specialized statistics and interview data that are not fully available. Second, the local context is important for cross-border cooperation, which shapes the specific design (historical relationships, cultural traditions, and customs) of the relationships of the participating countries. It is no coinci- dence that cross-border cooperation is always explored through specific countries, places, and peoples. Therefore, to clarify the causal relationship of transboundary cooperation, it is necessary to consider it in the context of individual countries using a suitable methodology.
As more data become available, a more complete picture will emerge of the determinants of cross-border cooperation.
In this study, the authors attempted to combine the views of previous studies and identify the determinants of cross-border cooperation in the Hungarian context.
The authors aimed to identify the determinants of sustainable cross-border cooperation and the relationships between them, using the example of the Hungarian case.
The study, thus, posed the following research questions:
1. Is cross-border cooperation a multidimensional construct with direct and indirect influence variables?
2. Does the development of transport infrastructure have a positive impact on cross- border cooperation?
3. Does tourism affect cross-border cooperation? If so, is this impact direct or indirect?
4. Do socio-economic conditions influence cross-border cooperation? If so, directly or indirectly?
Hungary was not chosen as a case study by accident, since eight of its nine regions had links with neighboring countries and were border regions. Hungary is a member of Interreg’s European cross-border cooperation programs. In 2020, the fifth generation of such programs was completed. There were bilateral programs for cross-border cooperation with Austria [16], Romania [17], Slovakia [18], Slovenia [19], and Croatia [20]. These countries occupy an important place in the open Hungarian economy. In 2019, these countries accounted for 17.4 percent of exports and 15.5 percent of imports [21].
Previous studies have used the methods of critical literature analysis and statistical indicators [22,23], network analysis [24], and cluster analysis [25], aiming to measure key factors of cross-border cooperation. However, these have left out second- and third-order factors which, in turn, are also important for the formation of first-order factors. The authors attempted to fill this research gap by proposing the use of the method for structural equation modeling—Partial Least Squares Structural Equation Modeling (PLS-SEM).
To that end, we selected a structure of cross-border cooperation factors with indica- tors of the first, second, and third level influence. This approach is best and consistent
Sustainability2022,14, 893 3 of 21
with the methodology of the PLS-SEM structural equations. This allowed for the iden- tification of quantitative factors to identify direct impacts on cross-border cooperation and the determinants of interlinkages in cross-border cooperation. For such an analy- sis, we used PLS-SEM based upon the available Eurostat data for the period 2012–2019 for the neighboring countries of Hungary (Austria, Slovak Republic, Slovenia, Romania, and Croatia).
The literature review has strengthened the authors’ commitment to the application of PLS-SEM in identifying the underlying factors that bring together the border regions of countries, as its application to such a scientific task has not been found in previous research.
In addition, the use of the PLS-SEM methodology broadens the methodological base of international business and trade by using and explaining alternative sources of economic relations among economic agents [26].
This paper is organized as follows. Section2describes the theoretical framework for applying the PLS-SEM methodology in research into establishing causal relationships be- tween the factors of cross-border cooperation. Section3presents the step-by-step procedure of conducting PLS-SEM. Finally, Section4draws our conclusions based upon the analysis being conducted.
2. Theoretical Framework and Hypotheses on the Development of Cross- Border Cooperation
2.1. Improving External Competitiveness
The international direction of competitiveness theory can be considered the dominant paradigm in cross-border cooperation, which has been successfully applied in European practice over the past decades [27].
The origins of the external competitiveness issue for cross-border regions can be found in the work of M. Porter [28–30], in which the author highlights the nature of domestic competition in the market and the national specificities of the strategy as determinants.
M. Porter concludes that competitive advantages are not inherited but are created by nations [31].
The second important area for our study is international trade theory, which provided another basis for studying the determinants of cross-border cooperation. Through external economic relations, countries seek to enhance external competitiveness. The boundary, in addition to economic, cultural, social, and environmental assets, is an important element of territorial capital and contributes to the formation of “selective pattern of regional growth models“ [32]. Cross-border cooperation can be both a factor of sustainability and a factor of destabilization.
In addition, specific aspects or factors of transboundary cooperation, as well as their combinations, can be found in the literature. These works have been very helpful in the development of our theoretical model, and we will refer to them in the following section.
However, there is a gap in the literature on latent factors and their structural relationships, even though they are the ones that make cross-border cooperation sustainable and, thus, enhance external competitiveness. By using fragmented information on selected factors and elements of cross-border cooperation, we are trying to fill a gap in the scientific literature on sustainability of external competitiveness.
2.2. Development of a Theoretical Model
In this work, we are of the same view of the proponents of competitiveness and believe that cross-border cooperation can be a good way for countries to compete internationally and more sustainably.
The ability to build partnerships with business partners is a mechanism for achieving a competitive advantage. One source of competitive advantage is the internationalization of companies from neighboring countries [22].
To enhance domestic and external competitiveness, countries are interested in increas- ing high-technology exports. It is important to look at the concept of proximity, which has
become widespread in the research on innovation. The underlying premise of this concept is that the central (though not the main) [33] place in the exchange of tacit knowledge is the geographical proximity or physical distance between the locations of the innovation actors [3]. In this sense, neighboring countries in Europe have a significant advantage.
Open borders and spillover effects between industries and firms enable neighboring countries to make up for scarce resources, products, and services [34–36].
This may mean that innovation in neighboring countries has a major impact on cross- border cooperation, as it is a strong reason for working together. Moreover, joint innovative projects are supported by European funds and programs, including Interreg. However, it is not only joint innovation that contributes to the cooperation of neighboring countries. The potential for cooperation of neighboring countries in the field of innovation is determined by the costs of R&D, expertise, development, and technological innovation at the core of contemporary European problems, such as R&D in the field of renewable energy, an innovative infrastructure [37].
Recent studies have suggested that collaborative development of agri-food innovations is at the core of sustainable cross-border cooperation, with an increasing role for academic institutions and innovative brokers [37].
In turn, innovation is an important impulse that is now defined as a critical resource for enterprises and regions, contributing to the creation of competitive advantages at the local and international levels [38].
Therefore, we suggest that high-tech exports are one of the characteristics that explain cross-border cooperation, as innovation-active regions are distinct attractions, cooperation with which will increase the level of innovation of the regions lagging behind by sharing skills, technologies, and resources.
Thus, “high-tech export” was used as an endogenous indicator.
In the course of the study, we have noted that the conclusions on determinants of cross-border cooperation are ambiguous. In addition, previous studies have shown that cross-border cooperation can be affected to varying degrees by various kinds of obstacles:
administrative, legislative, historical, political, cultural, geographical, as well as financial ones [25,39–41].
We can, therefore, argue that cross-border cooperation is a multidimensional construct.
Hypothesis 1 (H1). Cross-border cooperation is a multidimensional construct with variables of direct and indirect influence. Cross-border cooperation is positively affected by the number of business trips.
The importance of transport has already been the subject of many studies. The results show that transport infrastructure, together with political factors, plays a crucial role in connecting transboundary regions [42]. Communication levels between transport systems also indicate the level of integration [11,12]. The influence of transport infrastructure has been studied in the work, and it is noted that transport accessibility is a strong side of the Hungarian-Romanian border [42].
All of the above suggests the following hypothesis.
Hypothesis 2 (H2).Infrastructure development has a positive impact on cross-border cooperation.
According to Houtum (1998) [7], the boundary can sometimes function as a real barrier in the cognitive sense. Having been transformed into a theoretical model [2], it has shown that it is possible to remove boundary barriers in cognitive perception, allowing us to get to know each other better. Not surprisingly, tourism, shopping, and entertainment are the most suitable for this role, while formal knowledge and media exchange, can distort the image of a neighboring region. It is no coincidence that tourism projects are the most popular type of cross-border cooperation financed by territorial cooperation programs. The contribution of such joint tourism projects is illustrated by the work of [14] in the example of Baltic region countries.
Sustainability2022,14, 893 5 of 21
It has been shown that the level of security in a country (region) can influence the tourist exchange of cross-border regions [15,43] and contribute to the economy of neighbor- ing countries.
From a theoretical point of view, researchers have noted the mutual relationship between tourism and transport [44,45], with a special focus on the importance of transport for tourism [46].
Hypothesis 3 (H3).Tourism, namely the intensity of tourist exchanges between border countries, affects the development of transport infrastructure in the country.
Cross-border cooperation is generally considered in three main aspects [2]: (i) a way of economic prosperity through the use of resources that are not available or sufficient in a border region; (ii) the balanced development of transboundary regions, since surplus resources, under favorable conditions, flow across borders; (iii) the increased sustainability of social and economic development of transboundary regions, as cooperation contributes to efficient resource allocation.
From this point, we can assume that socio-economic development has a positive impact on cross-border cooperation, as countries are improving their economies through a flow of scarce resources. There is a problem that social and economic situation is understood very broadly [13], and studies of cross-border cooperation may include factors ranging from physical assets to human capital. Successful entrepreneurship is the basis for sustainable socio-economic development of countries and regions [47].
Social and economic conditions provide the basis for successful business activities of countries.
Of course, the positive impact of human capital on cross-border cooperation cannot be overemphasized [48]; though this may not happen directly, but through increased innovation and labor exchanges. For example, there is evidence that exchanges with suppliers and skills are determinants of the cross-border interaction of small and medium- sized enterprises [49]. The scientific field has documented results, including for Croatia and Hungary, that human capital, transport infrastructure, and tourism can lead to synergies from cross-border cooperation [50].
The global trend in digitization has had an impact on cross-border cooperation and has contributed to the mutual development of neighboring countries and regions [51]. The above may mean that digitization is an important factor that, in the present context, affects, first and foremost, social and economic situations.
In accordance with the theoretical arguments considered and the related works, we propose the hypotheses as follows.
Hypothesis 4 (H4). The socio-economic conditions in the country influence the development of tourism.
Hypothesis 5 (H5). Tourism mediates the relationship between infrastructure and cross- border cooperation.
Hypothesis 6 (H6). The socio-economic conditions have an indirect impact on cross-border cooperation, as it contributes to tourism and infrastructure development.
The theoretical model we propose links three hidden variables: transport infrastruc- ture, tourism, and socio-economic situation (see Table1).
Table 1.Theoretical constructs and hypotheses.
Construct Description Testable Hypothesis
Cross-border cooperation Cross-border cooperation is a multidimensional construct. The
number of business trips characterizes cross-border cooperation. H1
Transport infrastructure
Transport infrastructure provides connectivity between territories, as it enables the exchange of goods and people between neighboring countries. It includes road networks, electric rail
networks, and navigable inland waterways networks.
H2
Tourism
To a large extent, this determines the state of the infrastructure.
Countries are developing infrastructure not only for entrepreneurship but also for tourism.
H3
Socio-economic conditions
If architecture is of direct interest to tourists, then socio-economic conditions (Internet penetration, research and development costs,
e-commerce, and proportion of renewable sources in final consumption) make these artifacts most attractive for tourists and
ensure a comfortable stay for them.
H4
Mediation analysis
Mediation is manifested in the existence of an intermediate variable between two interconnected constructs.The study verified the
existence of proxy variables influencing the design of cross-border cooperation.
H5 H6
Source: developed by the authors.
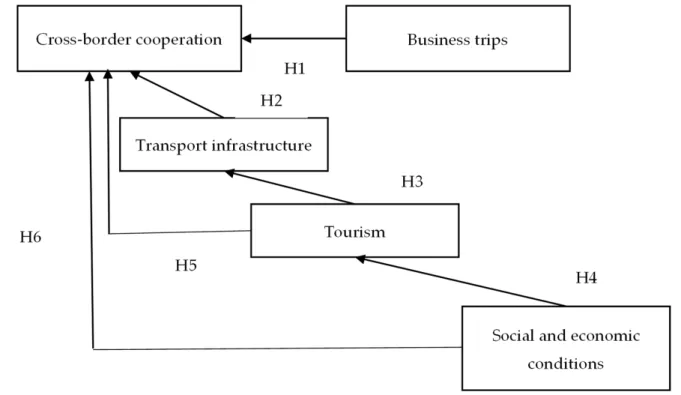
A schematic model of cross-border cooperation is presented in Figure1.
Sustainability 2022, 14, x FOR PEER REVIEW 7 of 22
Figure 1. A theoretical model of cross-border cooperation. Source: developed by the authors.
3. Methodology
Structural equation modeling (SEM) allows researchers to model and evaluate com- plex relationships between a set of dependent and independent variables simultaneously.
The socio-economic phenomena studied are generally measured indirectly by several in- dicators. SEM allows the error of measurement of the observed variables to be taken into account, resulting in a more accurate model.
Between the two dominant methods of structural equation modeling (SEM), the co- variance base (CB-SEM) and partial least squares (PLS-SEM), the authors chose the second method because, unlike the first method, it has a higher explanation and predictive func- tion. Cause-prognostic properties [52] has enabled PLS-SEM to gain a high scoring capac- ity among researchers in a wide variety of economic fields [53].
PLS-SEM analysis uses two fundamental statistical methods: linear regression and
factor analysis. The advantage of PLS-SEM analysis is the possibility to evaluate the influ- ence of the so-called latent (not explicitly observed) factors on the phenomenon under study [54]. This advantage is particularly noticeable concerning research in the terminol- ogy of Checkland’s «soft» systems, i.e., systems with significant influence of social, polit- ical, and human elements [55]. For this reason, the results of factor analysis for socio-eco- nomic systems, compared to rigid (technical and technological) systems, tend to have lower evaluation criteria. The purpose of PLS-SEM algorithms is to minimize residual de- viations of endogenous variables to be explained [56].
Henseler, Ringle, and Sarstedt (2012) [57] propose a two-step PLS-SEM procedure. In the first step, the normalized factor values for the estimation of components X and Y are subjected to a repetitive iterative process. The final estimates of the coefficients (external weights, loads, and path coefficients) are then calculated using the normal least squares method for each partial regression model [58]. In PLS-SEM, two types of models are pos- sible: reflexive and shaping [59].
As our model is a reflexive type, the cause-effect relationship moves from a hidden variable to the set of indicators.
The advantage of structural equation modeling (SEM) in SmartPLS is the relative simplicity of analyzing linear relationships between explicit variables and hidden varia- bles. PLS-SEM allows the construction of different-level models and, at the same time,
Figure 1.A theoretical model of cross-border cooperation. Source: developed by the authors.
3. Methodology
Structural equation modeling (SEM) allows researchers to model and evaluate complex relationships between a set of dependent and independent variables simultaneously. The socio-economic phenomena studied are generally measured indirectly by several indicators.
SEMallows the error of measurement of the observed variables to be taken into account, resulting in a more accurate model.
Sustainability2022,14, 893 7 of 21
Between the two dominant methods of structural equation modeling (SEM), the covariance base (CB-SEM) and partial least squares (PLS-SEM), the authors chose the second method because, unlike the first method, it has a higher explanation and predictive function. Cause-prognostic properties [52] has enabledPLS-SEMto gain a high scoring capacity among researchers in a wide variety of economic fields [53].
PLS-SEManalysis uses two fundamental statistical methods: linear regression and factor analysis. The advantage ofPLS-SEManalysis is the possibility to evaluate the influence of the so-called latent (not explicitly observed) factors on the phenomenon under study [54]. This advantage is particularly noticeable concerning research in the terminology of Checkland’s «soft» systems, i.e., systems with significant influence of social, political, and human elements [55]. For this reason, the results of factor analysis for socio-economic systems, compared to rigid (technical and technological) systems, tend to have lower evaluation criteria. The purpose ofPLS-SEMalgorithms is to minimize residual deviations of endogenous variables to be explained [56].
Henseler, Ringle, and Sarstedt (2012) [57] propose a two-step PLS-SEM procedure.
In the first step, the normalized factor values for the estimation of components X and Y are subjected to a repetitive iterative process. The final estimates of the coefficients (external weights, loads, and path coefficients) are then calculated using the normal least squares method for each partial regression model [58]. InPLS-SEM, two types of models are possible: reflexive and shaping [59].
As our model is a reflexive type, the cause-effect relationship moves from a hidden variable to the set of indicators.
The advantage of structural equation modeling (SEM) in SmartPLS is the relative simplicity of analyzing linear relationships between explicit variables and hidden variables.
PLS-SEMallows the construction of different-level models and, at the same time, evaluates the relationships between the design of the study and the corresponding indicators related to the respective levels. Through this approach,PLS-SEMcan evaluate complex models of cause-effect relationships with hidden variables [60]. A useful property of the partial least squares methodPLS-SEMis the possibility of simultaneously testing a set of indicators and testing hypotheses about connections in a multi-level system with implicit connections between elements.
Many researchers agree on the reliability and validity of PLS-SEM results. Sarstedt, M and co-authors [61], Hair, J, Hollingsworth, CL, Randolph, AB, Chong, AYL [62], Ramli, NA, Latan, H, Nartea, GV [63] note that the partial least squares (PLS-SEM) simulation of structural equations has become a standard tool for analyzing complex relationships between observable and hidden variables in many areas of research as it allows reliable and efficient identification of non-observed factors.
These arguments allowed the authors to choose this method, which many researchers use in various fields of research/social sciences [64]. The PLS-SEM method allows adequate processing of data on short samples, as it does not require a normal data distribution [65].
To perform the calculations, we used special software SmartPLS 3, which allows per- forming factor analysis, path analysis, to construct regression models, covariance structure models, bootstrapping, and importance-performance map analysis (IPMA) [66].
4. Results 4.1. Survey Data
In this work, we analyze the determinants of cross-border cooperation and the indirect influence of hidden variables, and try to answer the question of how they influence and of the best way for neighboring countries and their regions to enhance international competi- tiveness through cross-border cooperation. We analyze this process using the example of Hungary and its neighboring EU countries (Austria, Slovak Republic, Slovenia, Romania, Croatia). This choice is related to Hungary’s central position in the EU. This country is central to Europe and is of particular interest, as it has eight NUTS-2 regions, according to the 2016 NUTS System, and seven of them are border regions. Due to the geographical
location, Hungary has many and various opportunities for cross-border cooperation, as we present in our study.
The study does not take into account cross-border interaction with Bosnia and Herze- govina and Moldova, as there is no relevant statistical base for these non-European Union countries.
The main source of information for the study is Eurostat’s statistical base. Since this database is in the process of continuous improvement, and every year new relevant data become available, we have highlighted a period of analysis with a set of necessary data for 2012–2019. The advantage of PLS-SEM is that there is no requirement for a «long» data range for analysis [67].
In our case, the research model was based on five constructs: business trips, cross- border cooperation, transport infrastructure, tourism, and socio-economic conditions.
The independent variables in the first stage were exports, imports, and exports of high- technology products from Hungary to neighboring countries.
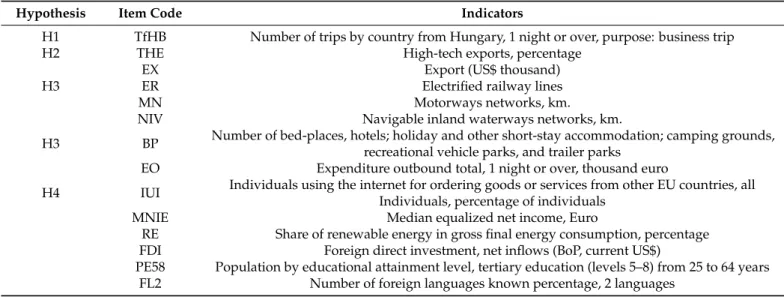
The measurement model was originally composed of fourteen indicators presented in the Table. Since four of them (EX, FDI, PE58, FL2) had external loads below 0.7, they were excluded from the model. Note that the NIV indicator also showed a value below 0.7 but above 0.5. Given the important substantive characteristics of the indicator, it was decided to leave this criterion because of its importance for countries with an advanced navigation network. In addition, the model showed higher quality ratings with this indicator (Table2).
Table 2.Grouping of indicators included in the model design.
Hypothesis Item Code Indicators
H1 TfHB Number of trips by country from Hungary, 1 night or over, purpose: business trip
H2 THE High-tech exports, percentage
EX Export (US$ thousand)
H3 ER Electrified railway lines
MN Motorways networks, km.
NIV Navigable inland waterways networks, km.
H3 BP Number of bed-places, hotels; holiday and other short-stay accommodation; camping grounds, recreational vehicle parks, and trailer parks
EO Expenditure outbound total, 1 night or over, thousand euro
H4 IUI Individuals using the internet for ordering goods or services from other EU countries, all Individuals, percentage of individuals
MNIE Median equalized net income, Euro
RE Share of renewable energy in gross final energy consumption, percentage FDI Foreign direct investment, net inflows (BoP, current US$)
PE58 Population by educational attainment level, tertiary education (levels 5–8) from 25 to 64 years FL2 Number of foreign languages known percentage, 2 languages
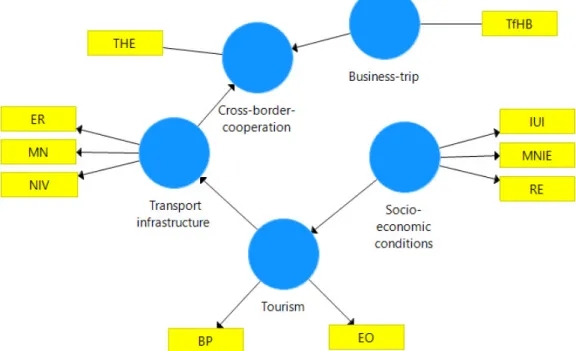
Furthermore, we built the model in Smart PLS and conducted its evaluation of quality and reliability. The model is based on the Wold path model (1982) [68], whose algorithm is a regression sequence with weight vectors [57] (Figure2).
4.2. Evaluation of the Measurement Model
The evaluation of the traditional PLS-SEM model requires, first, the definition of the measurement model and, second, the evaluation of the structural model in which the hypotheses are tested.
The study builds a reflexive model where indicators are a representative set of elements that all reflect the hidden variable that they measure.
To begin with, it is necessary to check the validity of the reflexive structures by assessing the external load of the indicators and the validity of the average dispersion.
As is known, the external loads of the indicators should meet the requirement of statistical significance and the standardized external load should be greater than 0.7.
Sustainability2022,14, 893 9 of 21
The latent variable should provide more than 50% of the variance of each indicator [69].
Therefore, the external load shall be greater than 0.708 (0.7082= 0.501). This criterion has been met in the measurement model (Table3).
Sustainability 2022, 14, x FOR PEER REVIEW 9 of 22
Table 2. Grouping of indicators included in the model design.
Hypothesis Item Code Indicators
Н1 TfHB Number of trips by country from Hungary, 1 night or over, purpose: business trip
Н2 THE High-tech exports, percentage EX Export (US$ thousand)
Н3 ER Electrified railway lines
MN Motorways networks, km.
NIV Navigable inland waterways networks, km.
Н3 BP
Number of bed-places, hotels; holiday and other short- stay accommodation; camping grounds, recreational
vehicle parks, and trailer parks
EO Expenditure outbound total, 1 night or over, thousand euro
Н4 IUI
Individuals using the internet for ordering goods or services from other EU countries, all Individuals, per-
centage of individuals
MNIE Median equalized net income, Euro
RE Share of renewable energy in gross final energy con- sumption, percentage
FDI Foreign direct investment, net inflows (BoP, current US$)
PE58 Population by educational attainment level, tertiary ed- ucation (levels 5–8) from 25 to 64 years
FL2 Number of foreign languages known percentage, 2 lan- guages
Furthermore, we built the model in Smart PLS and conducted its evaluation of qual- ity and reliability. The model is based on the Wold path model (1982) [68], whose algo- rithm is a regression sequence with weight vectors [57] (Figure 2).
Figure 2. Model for cross-border cooperation.
Figure 2.Model for cross-border cooperation.
Table 3.Reliability conditions for CA, CR, and AVE.
Construct Item Code Outer
Loadings R2 Cronbach’s
Alpha (CA)
Composite Reliability Test (CR)
Average Variance Extracted (AVE)
Business-trip 1.000 1.000 1.000
TfHb 1.000
Cross-border
cooperation 0.674 1.000 1.000 1.000
EX 1.000
Transport
infrastructure 0.465 0.700 0.798 0.576
ER 0.763
MN 0.903
NIV 0.574
Tourism 0.713 0.799 0.890 0.802
BP 0.874
EO 0.917
Socio-economic
conditions 0.756 0.884 0.719
IUI 0.827
MNIE 0.949
RE 0.756
Source: calculated by the authors.
For latent variables, the value R2is evaluated. It is estimated that 0.25 corresponds to a low level, 0.5 to a medium level, and 0.75 to a high level. The values of R2of the latent variables of the measurement model are given in the table.
Cronbach’s alpha makes it possible to assess the reliability of the reflective estimator.
Cronbach’s alpha (CA) value above 0.7 is considered preferable, reflecting the internal coherence of the design, values below 0.6 are considered undesirable [70]. Since it is believed that due to the sensitivity to the number of structures, Cronbach’s alpha may underestimate the internal consistency of the model [71], a composite reliability test (CR) was performed and average variance extracted (AVE) was assessed (AVE), which allowed the measurement of convergent validations and correlation. Note that CR is an illustration of the compliance degree of structural indicators with latent variables.
The average variance extracted (AVE) was used to assess the convergent validity.
The discriminant validity reveals differences between the designs according to em- pirical standards. If the discriminant validity is confirmed, this means that the design is unique and characterizes the phenomena not covered by other components of the model.
Two conditions are considered to be necessary to prove the convergent validity:
reliability above 0.7 and an average variance of at least 0.5 [70]. Factor loads greater than 0.5 indicate sufficient reliability of the investigated constructions [72].
A combined reliability of 0.7 or more is considered to be an adequate level [57], and 0.8 or more is considered a good benchmark for confirming the composition of latent factors [73].
The table shows that for the endogenous variable the cross-border cooperation R2is 0.674. In other words, the model describes more than 67% of the variance of the indicator, which is a significant value.
The reliability conditions according to the criteria CA, CR, AVE in the model are fulfilled.
All three reflexive constructions have quite high CR (Transport infrastructure = 0.798, Tourism = 0.890, Socio-economic conditions = 0.884), indicating a high degree of reliability and consistency.
Since the convergent validity exceeds 0.5, the model can be considered unique and its components sufficiently describe cross-border cooperation.
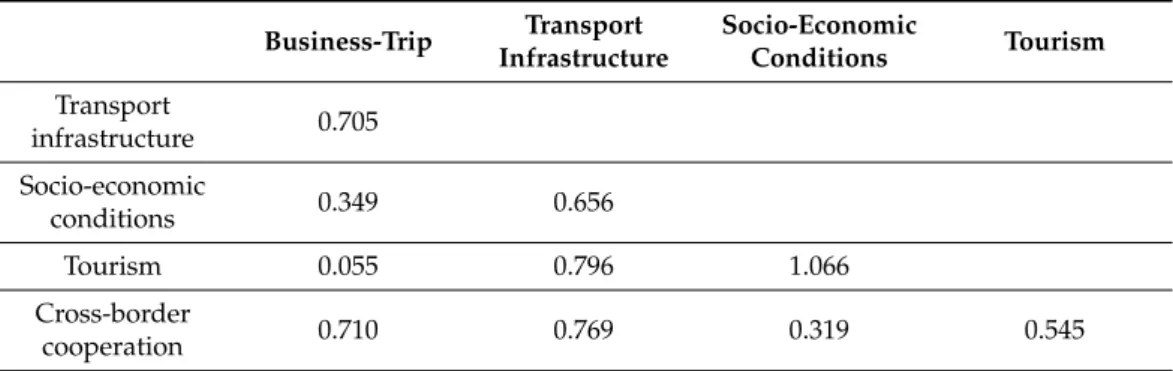
We have also further evaluated the divergent validity by the heterotrait-monotrait (HTMT) method, which has recently gained a preference over the Fornell–Larcker test, with a threshold value of 0.9 [59] being proposed. This criterion is used as a basis for statistical testing of discriminatory validity. We used a step-by-step method to detect distributions of HTMT (Table4).
Table 4.Heterotrait-Monotrait Ratio matrix (HTMT).
Business-Trip Transport Infrastructure
Socio-Economic
Conditions Tourism Transport
infrastructure 0.705 Socio-economic
conditions 0.349 0.656
Tourism 0.055 0.796 1.066
Cross-border
cooperation 0.710 0.769 0.319 0.545
Source: calculated by the authors.
HTMT values do not exceed the threshold value for all constructs. The exception is Tourism-Socio-Economic Conditions, but this exceedance is not critical, although it may be noted that there is insufficient discriminatory validity.
Further, using the step-by-step method, we tested the multicollinearity of the internal model constructions using the variance inflation factor (VIF), adopting its threshold value of 4 [69].
Sustainability2022,14, 893 11 of 21
Table5show VIF coefficients for the model constructs.
Table 5.VIF Values for model constructs.
Transport Infrastructure
Socio-Economic
Conditions Tourism Cross-Border Cooperation
Business-trip 1.374
Transport
infrastructure 1.374
Socio-economic
conditions 1.000
Tourism 1.000
Source: calculated by the authors.
In this way, we have fulfilled the necessary condition for checking the reliability and validity of the outer measurement model and can start to evaluate the quality of the inner structural model.
4.3. Evaluation of Model Structure
The model structure is evaluated to confirm or reject the hypotheses. Henseler, J.;
Hubona, G.; Ray, P.A. indicate that the most appropriate way is to make evaluations, both for the estimated model and for the saturated model [74].
To test the model structure, the study carried out a bootstrapping procedure in SmartPLS.
Bootstrapping allows multiple sub-samples to be generated by a substitution method in which each time an observation is randomly extracted from a sample, the first is returned to the sample before extracting the next one. As a result, the totality of observations remains unchanged. The number of sub-samples should not be less than the sum of reliable observations in the total data set. Bootstrapping provides statistics of all model parameters-path coefficients, Cronbach’s alpha, HTMT, and R2.
In our study to structure the model, we made 5000 downloads for the Complete Bootstrapping procedure in SmartPLS, which is considered sufficient for research purposes.
The Standardized Root Mean Square Residuals (SRMR) should not be higher than 0.1 or 0.08 in the more conservative version [75].
For our model, SRMR was 0.1, which can be accepted as a valid value.
After testing the measurement models, an analysis of the relationship of hidden variables (constructs) to each other and the criteria for the significance of thetfactors and determinism, or, with the same effect, R2should be made.
To assess the conformity of the structural model, the first and main criterion is consid- ered to be the t-value. T-values above 1.96 indicate that the interconnection of the structures is correct. Therefore, the study hypotheses are confirmed with a 95% confidence level. The p-value evaluates the probability of error in rejecting the zero hypothesis (Type I error).
In our case, the probability of such error tends to 0, which also indicates the adequacy of the model.
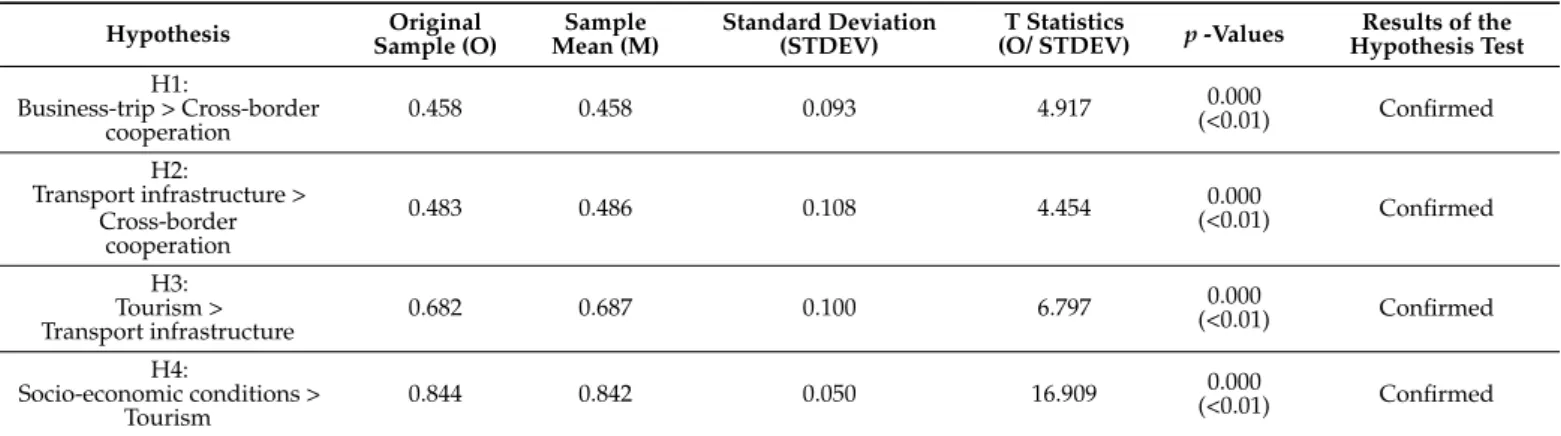
The values of path coefficients of the respective constructions with their respective sig- nificance levels, which characterize the validation of some hypotheses we have considered, are presented in Table6.
Table 6.Trajectory coefficients.
Hypothesis Original
Sample (O) Sample
Mean (M) Standard Deviation
(STDEV) T Statistics
(O/ STDEV) p-Values Results of the Hypothesis Test H1:
Business-trip > Cross-border
cooperation 0.458 0.458 0.093 4.917 0.000
(<0.01) Confirmed H2:
Transport infrastructure >
Cross-border cooperation
0.483 0.486 0.108 4.454 0.000
(<0.01) Confirmed H3:
Tourism >
Transport infrastructure 0.682 0.687 0.100 6.797 0.000
(<0.01) Confirmed H4:
Socio-economic conditions >
Tourism 0.844 0.842 0.050 16.909 0.000
(<0.01) Confirmed Source: calculated by the authors.
4.4. Figures, Tables, and Schemes
In the framework of our research, an analysis of not only direct but also the indirect influence of constructs on each other has been carried out. Direct effects are reflected by one-way relationships between the components of the design. Indirect effects typically include at least one intermediate (proxy) element of model design. Such elements make it possible to identify latent variables more precisely and to find the combined effect of the influence of the considered direct and indirect exogenous variables.
The table presents the results of the indirect effects of the base model. Transport infrastructure and cross-border cooperation are both directly related (=0.674). In turn, socio-economic conditions and transport infrastructure are related to indirect effects (0.844×0.682 = 0.576), socio-economic conditions and cross-border cooperation are re- lated to indirect effects (0.844× 0.682× 0.483 = 0.278), and tourism and cross-border cooperation are indirect effects (0.682×0.483 = 0.329).
As before, the significance of indirect effects is at a 5 percent level (Table7).
Table 7.Total Indirect Effect.
Hypothesis Original
Sample (O)
Sample Mean (M)
Standard Deviation (STDEV)
T Statistics
(O/STDEV) p-Values H5: Tourism—>Cross-border
cooperation 0.329 0.341 0.110 3.008 0.000
H6:
Socio-economic conditions—>Cross-
border cooperation
0.278 0.291 0.103 2.707 0.000
Source: calculated by the authors.
An assessment of the direct, indirect, and cumulative effects is presented in Table8.
Table 8.Total Indirect Effect.
Transport Infrastructure
Socio-Economic
Conditions Tourism Cross-Border
Cooperation
Transport infrastructure 0.458
Socio-economic conditions 0.576 0.844 0.278
Tourism 0.682 0.329
Source: calculated by the authors.
Sustainability2022,14, 893 13 of 21
4.5. Mediation Analysis
If one or more other variables are found between the variables, such proxy variables inevitably have a moderating effect on those variables. The endogenous construct in the PLS model is transformed, as the change in the exogenous construct is influenced by the alteration of the proxy element. The proxy variable acts as if it mitigates the relationship of variables that it separates in the causal chain. Therefore, the proxy variable is often accepted as the regulatory variable.
In the course of our study, the significance of the influence of indirect variables “socio- economic effect” and “tourism” on cross-border cooperation was evaluated. The model confirms these connections. In the case of a small effect of proxy variables, it is concluded that the relationships analyzed play little role in promoting cross-border cooperation.
The calculations presented in the tables above suggest that tourism and the country’s socio-economic conditions are the intermediaries for cross-border cooperation. The results confirm hypotheses H5 and H6. The model results reflect the causal relationship of cross- border cooperation.
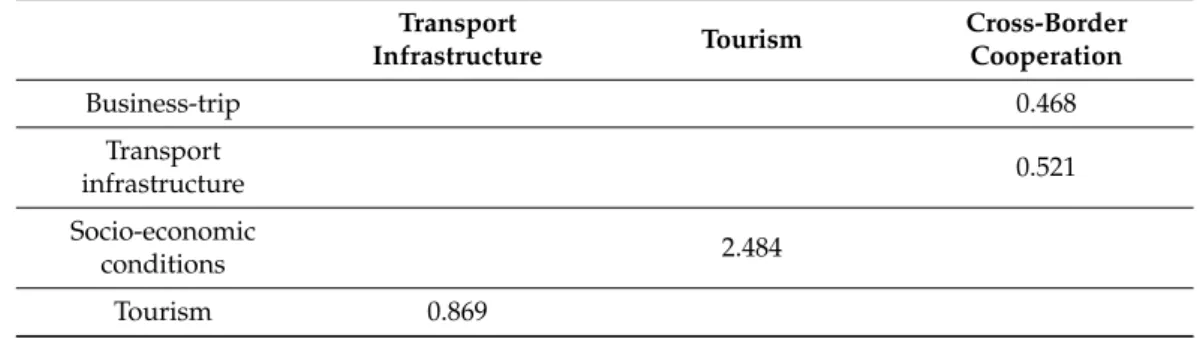
4.6. Impact Assessment
The study uses f2to measure the impact. This parameter allows analyzing the rel- evance of some constructs (endogenous) to the formation of others (exogenous). The f2values of 0.02, 0.15, and 0.35 are considered to correspond to the weak, medium, and significant effects of the latent variable. If the value of the indicator is lower than 0.02, the effect is missing [76]. The study calculated a high value of f2, above 0.02 Table9).
Table 9.f-Square Values.
Transport
Infrastructure Tourism Cross-Border
Cooperation
Business-trip 0.468
Transport
infrastructure 0.521
Socio-economic
conditions 2.484
Tourism 0.869
Source: calculated by the authors.
Thus, the model shows significant effects of latent variables between transport in- frastructure and cross-border cooperation (0.521), socio-economic conditions and tourism (2.484), and tourism and transport infrastructure (0.869).
4.7. IPM Analysis
IPM analysis allows for the extension of the results of PLS-SEM, as it analyzes the performance of each construct. The IPM analysis was performed in PLS Smart, selecting a mode that includes all predecessors of the selected target construct.
In the IPM analysis, the combined effect of the structural model and its target construct (in our case cross-border cooperation) is compared with the average values of the latent variables, the predecessors of the given design.
The Important-Performance Map includes all constructs in the PLS path model, which are indirect and direct predecessors of the chosen target design in the PLS path model. In our model, we considered the predecessors of socio-economic conditions and tourism. The combined effect shows the contribution of previous constructs to cross-border cooperation, while the mean values of latent variables reflect the performance of these factors. The objective of the study was to identify the «predecessors» that were highly stimulating for cross-border cooperation but with relatively low performance.
From a practical point of view, the basic properties of constructs are of great interest.
On the IPM-derived graph (Figure3), the x-axis shows the aggregate (standardized) effect of tourism and socio-economic conditions on the target construct (cross-border cooper- ation). On the y-axis are the average scale (standardized) values of tourism and socio- economic conditions.
Sustainability 2022, 14, x FOR PEER REVIEW 15 of 22
Figure 3. Importance-Performance Map.
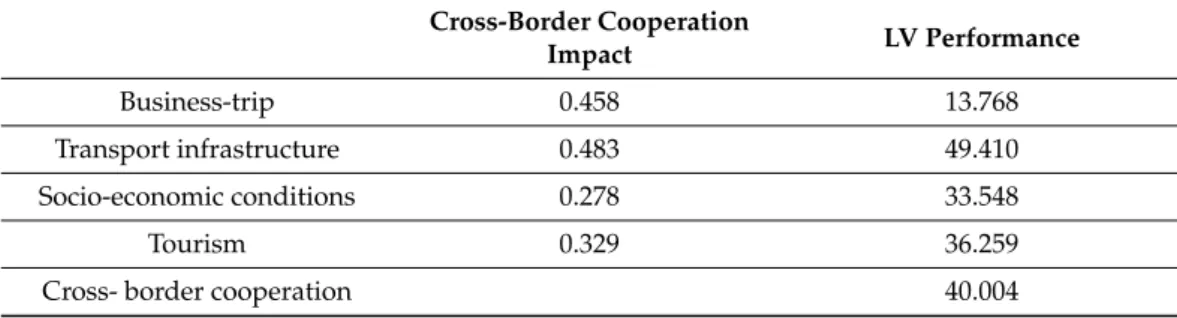
Table 10 shows the values of the indices and the combined effect.
Table 10. IPM Summary Results.
Cross-Border Cooperation Impact LV Performance
Business-trip 0.458 13.768
Transport infrastructure 0.483 49.410
Socio-economic conditions 0.278 33.548
Tourism 0.329 36.259
Cross- border cooperation 40.004
Source: calculated by the authors.
The most important factor influencing cross-border cooperation is transport infra- structure, as it has relatively high values compared to other latent variables. Tourism is the second most important factor. Socio-economic conditions follow. The contribution of this factor, though smaller, is also significant. The figure shows that transport infrastruc- ture has the greatest influence on the decision on starting cross-border cooperation. There- fore, the authorities should pay special attention to transport infrastructure when devel- oping policies and strategies.
5. Discussion and Conclusions
In this study, various hypotheses were put forward to show the determinants of sus- tainable cross-border cooperation, to expose the phenomenon as a multidimensional cat- egory positively affected by business trips, transport infrastructure, tourism, and socio- economic development. To strengthen the results obtained, we carried out a performance analysis of the theoretical constructions.
The hypothesis that cross-border cooperation is a multidimensional construct (H1) with variables of direct and indirect influence was strongly supported. The presented model for the analysis of cross-border cooperation contains five constructions and thirteen indicators. The calculations showed that the model provided reliable indicators, structural reliability, and discriminatory validity. For endogenous cross-border cooperation, the var- iable R2 was 0.674, with the model showing 67.4%. This is considered an acceptable level for socio-economic systems at the national level.
The current results are well in line with the conclusions by the authors expressing views on the impact of factors of different natures, and not always economic ones, on cross-border cooperation. Moreover, there is a need to revise the models of cross-border cooperation [25,39–41]. The findings of the study support the need to build partnerships [25] and boost the internationalization of local companies [22]. It is no accident that busi- ness trips and transport infrastructure were well integrated into the system of the direct factors of cross-border cooperation.
Figure 3.Importance-Performance Map.
Table10shows the values of the indices and the combined effect.
Table 10.IPM Summary Results.
Cross-Border Cooperation
Impact LV Performance
Business-trip 0.458 13.768
Transport infrastructure 0.483 49.410
Socio-economic conditions 0.278 33.548
Tourism 0.329 36.259
Cross- border cooperation 40.004
Source: calculated by the authors.
The most important factor influencing cross-border cooperation is transport infras- tructure, as it has relatively high values compared to other latent variables. Tourism is the second most important factor. Socio-economic conditions follow. The contribution of this factor, though smaller, is also significant. The figure shows that transport infrastructure has the greatest influence on the decision on starting cross-border cooperation. Therefore, the authorities should pay special attention to transport infrastructure when developing policies and strategies.
5. Discussion and Conclusions
In this study, various hypotheses were put forward to show the determinants of sustainable cross-border cooperation, to expose the phenomenon as a multidimensional category positively affected by business trips, transport infrastructure, tourism, and socio- economic development. To strengthen the results obtained, we carried out a performance analysis of the theoretical constructions.
The hypothesis that cross-border cooperation is a multidimensional construct (H1) with variables of direct and indirect influence was strongly supported. The presented model for the analysis of cross-border cooperation contains five constructions and thirteen indicators. The calculations showed that the model provided reliable indicators, structural reliability, and discriminatory validity. For endogenous cross-border cooperation, the variable R2was 0.674, with the model showing 67.4%. This is considered an acceptable level for socio-economic systems at the national level.
The current results are well in line with the conclusions by the authors expressing views on the impact of factors of different natures, and not always economic ones, on
Sustainability2022,14, 893 15 of 21
cross-border cooperation. Moreover, there is a need to revise the models of cross-border co- operation [25,39–41]. The findings of the study support the need to build partnerships [25]
and boost the internationalization of local companies [22]. It is no accident that business trips and transport infrastructure were well integrated into the system of the direct factors of cross-border cooperation.
The hypothesis (H2) of the leading role of transport infrastructure (electrified railway lines, motorway networks, and navigable inland waterway networks) in the development of transboundary cooperation has been strongly confirmed. This conclusion is consistent with the statements of researchers on the decisive influence of transport as a link between countries [11,41,50] and confirms the priorities of the European Government aimed at the development of a multi-level linked transport system [11]. In the transboundary cooperation of Hungary with neighboring countries, the transport system is a strong party, which confirms the conclusions of the work [42].
Economic and social development has proved to be a determining factor in the de- velopment of cross-border cooperation, but indirectly through tourism. In other words, the level of socio-economic development has a direct impact on tourism, followed by cross-border cooperation. This is because the growth of socio-economic development makes tourism more attractive since countries with a high level of development tend to be comfortable for tourists and some places are more interesting. Thus, the hypotheses H3 and H4 are confirmed. The findings of the study are generally consistent with those of the researchers on the significance of tourism [7,13,44,50] and the socio-economic conditions for cross-border cooperation [13,47], but it is clear that these are indirect impacts.
5.1. Contribution to Research
This work has contributed to new knowledge about the determinants of sustainable cross-border cooperation and the relationship between them in a multi-level system of cross- border interaction between business, people, and the State. The authors have not found any earlier studies aimed at finding evidence of the determinants of sustainable cross-border cooperation based on PLS-SEM analysis. The study benefited from the construction of a cross-border cooperation design and the measurement of the performance of each construct.
The study found that the first factor in establishing sustainable cross-border cooperation is good transport accessibility, which is the key to removing barriers and restrictions, and increasing connectivity among the territories of neighboring states.
The findings have broadened knowledge of the international dimension of competitive- ness theory and international trade theory. It has been empirically proven that cross-border cooperation contributes to the emergence of a new model of economic growth and the growth of the competitiveness of economies. The discovery of this study is the growing importance of indicators of the «new» post-industrial economy. For example, the quality of the model has improved significantly with the inclusion of high-technology exports, the share of renewable energy sources, and the use of the Internet by individuals. The results were confirmed by the Hungarian context. For the developing Hungarian economy, this is a sign of a qualitative transformation of the economy and an increase in the innovative potential for subsequent economic growth.
The study broadens the understanding of the role of tourism, business missions, and socio-economic conditions. There is empirical evidence that socio-economic conditions do not directly affect cross-border cooperation. In other words, if there is will and participation, it is always possible to find a basis for dialogue and cooperation. However, socio-economic conditions remain an important factor for tourism, as they provide a sound basis for enhancing the attractiveness and comfort of tourists.
An important contribution is the affirmation of the benefits of cross-border coopera- tion from business missions, whose determinant role in cross-border cooperation cannot be underestimated.
5.2. Managerial, Theoretical and Research Implications
The study has managerial implications, especially for the Hungarian economy. The study showed the importance of transboundary cooperation based on empirical data from Hungary and neighboring countries (Austria, Croatia, Slovak Republic, Slovenia, Romania).
«Smart» management of cross-border cooperation based on the data obtained in the study allows for the choice of “selective pattern of regional growth models“ [32] and the use of the border to convert the border position into a competitive advantage. There is already a positive correlation between high-technology exports and cross-border cooperation. Causal relationships and impact assessments of the determinants of cross-border cooperation have practical management implications. The study provides valuable information for the Hungarian Government intending to establish management priorities and measures to promote cross-border cooperation and to enhance socio-economic development.
Special attention should be paid to the development of transport infrastructure. It is no accident in our model that transport infrastructure is at the top of the chain of causal links of cross-border cooperation. The Hungarian capital Budapest is served by three transport corridors of the core network: the East/East-Mediterranean Corridor, the Rhine- Danube, and the Mediterranean. The developed transport network is a strength of Hungary, where several projects have been implemented within the framework of the European TEN-T policy. According to the restructured network design, the corridors include the base (the most important nodes in the 2030 contour) and common (with a lifetime until 2050) nodes [77]. Already in 2019, due to its central position in Europe, Hungary accounted for 72% of the core network. This is one of the highest percentages, given the relatively long European length of transport corridors—1474 km, of which 76.6% (1130 km) are motorways [78]. Rail links continue to develop, and not only through European projects.
In particular, the Belgrade-Budapest High-Speed Railway project has been implemented within the framework of the Chinese Belt and Road Initiative (BRI) [79]. The development of transport infrastructure requires the development and introduction of new technologies such as artificial intelligence tools, automated data collection, processing technologies, high-speed traffic technologies, etc.
It is noteworthy that factors related to e-commerce and the development of alternative energy, along with the population income (Median Equivalent Net Income, Purchasing Power Standard), have proved to be important for socio-economic conditions. As our calculations have shown, these are promising trends in the current context that will have a positive impact on Hungary’s high-technology exports to neighboring countries.
The Hungarian authorities should encourage the continuation of active participation in the European Neighborhood Policy and the 2021–2027 Cohesion Policy, and support internal grants and scholarships of Hungarian scientific foundations and corporations with practical results. It is desirable that proposed and supported projects take into account the development of e-commerce and alternative energy. This will enable the development of a national science school and relevant practice in these areas.
The authorities of the whole country, its regions, and municipalities should ensure that they fully support the exchange of business missions, the expansion of business trips to Hungary and from Hungary to neighboring countries. It is important that representatives of tourism, business, and scientific and cultural organizations have an adequate under- standing of all the possibilities of cross-border cooperation, understand the advantages, and be involved in joint projects.
The model presented in our study is a good tool for evaluating these programs and could support further development and regional cooperation. In addition, it is recom- mended that the research model be used at the planning stage to provide a better forecast of the results of the target values.
The research implications are that there is considerable scope for collecting new evidence of the determinants of cross-border cooperation using thePLS-SEMmethod, as this study gathers empirical evidence of a country’s case. It is interesting to collect
Sustainability2022,14, 893 17 of 21
data and make comparative analyses for other countries, including the ones beyond the European Union.
5.3. Limitations and Recommendations for Future Studies
Countries are currently facing various internal and external challenges in developing cross-border cooperation. One such challenge was the 2020 pandemic, whose consequences have not yet been overcome. The study found that the determinants of cross-border cooperation relate to the physical movement of people: business missions and tourism.
Such a global challenge diminishes the sustainability of cross-border cooperation. The development of the transport system is also possible only if business and the public demand for transport services. The history of mankind shows that pandemics are temporary.
Coveted restrictions will be temporary, too. In this context, authorities should differentiate and maintain interest in cross-border cooperation with different neighboring countries, and make extensive use of digital technologies for joint projects.
A limitation of the study is the lack of available data for a longer period than the one presented in the study. AlthoughPLS-SEMis not sensitive to sample size, the lack of available data over a longer period than in the study (2012–2019) did not result in a higher level of model explanation than was available (67.4%). However, the qualitative characteristics of the model allow for consistent results for developing recommendations for cross-border cooperation based on the Hungarian case.
For future research, the inclusion of environmental agenda items should be recom- mended as a general framework for addressing the current and future problems of neigh- boring countries [80–82].
In addition, new opportunities for future research are emerging. First, similar empiri- cal studies could be carried out for EU countries using the research approach and similar statistical data. Attempts to compare data between developed and developing countries and between countries in different geographical areas seem to be of particular interest.
In addition, research based on interview data will help to expand the data obtained, as PLS-SEM is well established as a means of qualitative data processing, including inter- views. This would expand the range of data, including not only quantitative but also quantitative measures.
5.4. Conclusion
The study produced a model for the analysis of cross-border cooperation, which includes widely discussed constructs such as transport infrastructure, tourism, and socio- economic conditions [11,12,44–47].
Our conclusions are consistent with other research showing the high importance of cross-border mobility as it creates conditions for the removal of mental barriers [9]. In the study on cross-border cooperation, we have found that the authors tend to explore the role of certain transport, tourism and social and economic factors. Our study provides clarity on the determinants of cross-border cooperation and, more importantly, the causal relationships between them.
Our study has shown that cross-border cooperation needs to be seen as a multidimen- sional structure with not all factors directly influencing it. The establishment of a cause- and-effect relationship makes it possible to structure management impacts more clearly.
We see the further development of this study in two directions: first, the addition to the financing model of cross-border cooperation projects; second, the expansion of indicators, the statistical horizon, geography, and the way data are collected to provide new empirical evidence on cross-border cooperation.
Author Contributions: Conceptualization, G.A.K., M.V.K., B.I.T. and E.N.; methodology, G.A.K.;
formal analysis, G.A.K.; investigation, G.A.K.; writing—original draft preparation, G.A.K., M.V.K., B.I.T. and E.N.; writing—review and editing, G.A.K., M.V.K., E.N. and B.I.T. All authors have read and agreed to the published version of the manuscript.
Funding:The reported study was funded by RFBR and FRLC, project number 21-510-23002.
Institutional Review Board Statement:Not applicable.
Informed Consent Statement:Not applicable.
Data Availability Statement:The data supporting the reported results are publicly available at Euro- stat, see:https://ec.europa.eu/eurostat/web/main/data/database(accessed on 14 September 2021).
Acknowledgments: We are grateful to the reviewers of the paper for their careful reading and recommendations, which have improved the quality, theoretical and practical value of the paper.
Conflicts of Interest:The authors declare no conflict of interest.
References
1. Interreg Europe—30 Stories. Interreg Europe. 2020. Available online:https://www.interregeurope.eu/30stories/(accessed on 12 October 2021).
2. Hardi, T. Cities, regions and transborder mobility along and across the border.Discuss. Pap.2010,82, 5–27.
3. Noferini, A.; Berzi, M.; Camonita, F.; Durà, A. Cross-Border Cooperation in the EU: Euroregions amid Multilevel Governance and Re-Territorialization.Eur. Plan. Stud.2020,28, 35–56. [CrossRef]
4. Sereda, A.V.; Mikhaylichenko, Y.G.; Baklanov, P.Y.; Kachur, A.N.; Lappo, A.D.; Danilova, L.V. Contribution of an Integrated Maritime Policy to the Dialogue of Civilisations: The Asia-Pacific Case.J. Mar. Sci. Eng.2021,9, 610. [CrossRef]
5. Martinez, O.J. The Dynamics of Border Interaction: New Approaches to Border Analysis. InGlobal Boundaries: World Boundaries Series 1; Schofield, C.H., Ed.; Routledge: London, UK, 1994; pp. 1–15.
6. Kolesnikov, N.G. Border and peripherality as factors of economic development of the region North and the market: The formation of the economic order.Sev. Rynok Form.Èkonomiˇceskogo Porâdka2012,3, 117–120.
7. Van Houtum, H.J.The Development of Cross-Border Economic Relations, a Theoretical and Empirical Study of the Influence of the State Border on the Development of Cross-Border Economic Relations between Firms in Border Regions of The Netherlands and Belgium; CentER:
Tilburg, The Netherlands, 1998.
8. Khmeleva, G.A. Platform Approach—The Future of Cross-Border Cooperation in the Digital Era. InDigital Technologies in the New Socio-Economic Reality, Lecture Notes in Networks and Systems; Ashmarina, S.I., Mantulenko, V.V., Eds.; Springer: Cham, Switzerland, 2022; Volume 304, pp. 189–196.
9. Kurnikova, M.V.; Tóth, B.I.; Dodorina, I.V. Development of a Harmonized Digital System for Cross-Border Cooperation in the EU.
InDigital Technologies in the New Socio-Economic Reality, Lecture Notes in Networks and Systems; Ashmarina, S.I., Mantulenko, V.V., Eds.; Springer: Cham, Switzerland, 2022; Volume 304, pp. 157–166. [CrossRef]
10. ¸Tigu, G.; Andreeva, M.; Nica, A.M. Education and training needs in the field of visitors receiving structures and tourism services in the Lower Danube region.Amfiteatru Econ. J.2010,12, 735–760.
11. Medeiros, E. Cross-border transports and cross-border mobility in EU border regions.Case Stud. Transp. Policy2019,7, 1–12.
[CrossRef]
12. Fujimura, M. Cross-Border Transport Infrastructure, Regional Integration and Development. ADBI Discuss. Pap. 2004,16.
Available online:https://hdl.handle.net/10419/53503(accessed on 14 September 2021).
13. Mitrică, B.; Mocanu, I.; Dumitra¸scu, M.; Grigorescu, I. Socio-economic disparities in the development of the Romania’s border areas.Soc. Indic. Res.2017,134, 899–916. [CrossRef]
14. Kropinova, E. Cross-national and Cross-Border Cooperation for Sustainable Tourism Development in the Baltic Sea Region.
Sustainability2021,13, 2111. [CrossRef]
15. Hutárová, D.; Kozelová, I.; Špulerová, J. Tourism Development Options in Marginal and Less-Favored Regions: A Case Study of Slovakia´s Gemer Region.Land2021,10, 229. [CrossRef]
16. Programme: Interreg V-A Austria-Hungary. Available online:https://cohesiondata.ec.europa.eu/programmes/2014TC16RFCB0 10(accessed on 14 September 2021).
17. Interreg Romania-Hungary. Available online:https://interreg.eu/programme/interreg-romania-hungary/(accessed on 14 September 2021).
18. Annual Implementation Report 2019 of the Interreg V-A Slovakia-Hungary Cooperation Programme. Available online:https:
//www.skhu.eu/cmsadmin/asset/preview?id=5f5b807c323ef15a384199e5&0.7492055417879164(accessed on 14 September 2021).
19. Annual Implementation Report 2020.Cooperation Programme Interreg V-A Slovenia–Hungary in the Programming Period 2014–2020. May 2021. Available online:http://www.si-hu.eu/en2/download/AIR-2020-Interreg-SI-HU_2.pdf(accessed on 14 September 2021).
20. Interreg V-A Hungary-Croatia Co-Operation Programme. Available online:https://interreg.eu/programme/interreg-hungary- croatia/(accessed on 14 September 2021).
21. Hungary Trade Statistics: Exports, Imports, Products, Tariffs, GDP and Related Development Indicator. Available online:
https://wits.worldbank.org/CountryProfile/en/HUN(accessed on 14 September 2021).