Macro-level road network evaluation by fuzzy signature rule bases*
GERGELY CS.MIKULAI PhD Candidate
Doctoral School of Regional Sciences and Business Administration
Széchenyi István University, Hungary
Email: mikulai.gergely@ga.sze.hu
LÁSZLÓ T.KÓCZY Professor
Department of Information Technology Széchenyi István University, Hungary
Email: koczy@sze.hu
Department of Telecommunication and Media Informatics
Budapest University of Technology and Economics,
Hungary
Email: koczy@tmit.bme.hu
In our fast-growing world, we need to create increasingly efficient systems to ensure further growth and sustainability. This also applies to transportation, where a key limitation is the bottle- necks of road network capacity. To eliminate, or at least, to moderate these bottlenecks, they must first be localised. In this case study, a model is proposed to objectively identify the weak points of the road infrastructure in the Western Hungarian region, a typical part of the Hungarian road net- work, based on automated data input. This way, there is no need to visually analyse the road net- work on site, but it is possible to evaluate the available information and suggest efficient measures from the distance. The model is suitable for general application, meaning it can serve other regions or countries as well, and enables macro-level decision-makers to take steps to eliminate those weak points.
A fuzzy signature rule base is applied by the authors, which systematically maps and models the various attributes of the road network. The model currently contains more than 20 independent variables as inputs, but they can be easily expanded or replaced if further inputs need to be included.
KEYWORDS: fuzzy signature rule base, macro-level decision, road network
* The authors would like to express their gratitude to the Doctoral School of Regional Sciences and Business Administration for the funding opportunity to write this study. The research was supported by the National Research, Development and Innovation Office (Hungary) grant no. NKFIH K124055.
M
odern society builds complex infrastructures to ensure the flow of goods and people. As people started to use masswise vehicles, these infrastructures became increasingly compounded. The road network has been always sized for the average usage, but due to physical and financial limitations, traffic jams and bottlenecks are nevertheless inevitable. To explore these bottlenecks, different approaches were introduced from simple manual observation to complex traffic management systems.In the beginning, only local systems were created (Wu et al. [2018]).
As a result of the spread of modern technology, high-tech solutions such as Global System for Mobile Communications (GSM) and Global Positioning System (GPS) are also used to monitor traffic. These technologies have helped to automate data collection, making it easier to create a system in which more accurate data is available from each vehicle, compared to the earlier systems where more or less a gate flow-through was measured (Mikulai–Baracskai [2019]).
Through the improving global economy, the volume of transport and logistics is increasing significantly, which results in always growing attention to road net- works. Due to the extra load, more vehicles appear on the roads, and this leads to an enormous number of resolvable issues. What do economy, logistics, and road net- works have in common? All of these are created and operated by people.
If the connections between societal functions and road networks are revealed, the road transport network resilience could be modelled more easily (Nogal–Honfi [2019]).
To identify a solution to decrease the burden of wasted resources, most scien- tific approaches target this research area from the point of view of a single discipline.
However, since the connections between the society and the road networks are amaz- ingly complex, it is difficult to find a solution using a single-disciplinary approach.
To gain a holistic overview of this issue, a multilevel model is developed that intends to give a complex solution from the personal to social level and from the technical to sociological perspective. For this reason, the problem is divided into three main levels of social capital (Bjørnskov–Svendsen [2003]):
– macro level (economic and political level);
– meso level (group level; e.g., users of a given vehicle type or a logistics company);
– micro level (personal level; e.g., decisions behind the route and vehicle selection preferences).
At the macro level, we focus on the understanding of the problem from a gov- ernmental viewpoint. As the scope of possible questions is still quite broad at this level, we concentrate on the two most important questions:
– What should be done with the given road section?
– Which road section is the riskiest?
By answering the first question, an objective answer as to whether the given road section should be reconstructed or expanded, needs new traffic rules, or could be left intact can be obtained. This is important for the decision-making parties, as they could forecast the required workforce and lockdowns in advance, which could decrease the overall cost and time.
The second question targets safety. In Hungary, car accidents are still one of the major causes of death (even though COVID-19 has slightly changed these statis- tics). This means that it requires some attention to potentially decrease the number of the accidents. It is always welcome to make the roads safer. However, the increas- ing volume of traffic may have a negative impact on the number of accidents (Theofilatos [2017]).
The present study seeks to develop a theoretical framework, with data-based validation. The model can be used to accommodate the relevant input data for large volumes of data, processed automatically, without human intervention. It will also be able to incorporate new data sources, making it sustainable in the long term (Gome–Gan–Bayen [2018]).
The current approach builds on different inputs, such as road usage statistics, weather statistics, accident statistics, and road quality measurements. We propose a fuzzy signature rule base framework, which helps to describe and understand the connection between the various factors. The novelty of the proposed model is that it can be used to obtain a simple result for a highly complex and chaotic system. Just as it was written by James Gleick in his book about chaos ([2011] p. 2.): ‘Lorenz put the weather aside and looked for even simpler ways to produce this complex behav- iour. He found one in a system of just three equations:
dx ( ), σ y x
dt /1/
dydt x
ρ z
y, /2/dz . xy βz
dt /3/
They were nonlinear, meaning that they expressed relationships that were not strictly proportional. Linear relationships can be captured with a straight line on a graph. Linear relationships are easy to think about: the more the merrier. Linear equations are solvable, which makes them suitable for textbooks. Linear systems have an important modular virtue: you can take them apart and put them together again – the pieces add up. Nonlinear systems generally cannot be solved and cannot be added together. In fluid systems and mechanical systems, the nonlinear terms tend to be the features that people want to leave out when they try to get a good, simple understanding.’
To demonstrate the concept, semi-live telemetric data are used, collected by one of the Hungarian e-toll declaration providers. Introduced in 2013, a GPS- and GSM-based e-toll system is currently used in Hungary, where vehicles over 3.5 tons have to purchase tickets based on their actual road usage (National Toll Payment Services Plc. [2021]). The trucks can pay the road toll by single physically purchased tickets, or by GPS/GSM devices that are used nowadays around by 90% of trucks.
This study is based on data on e-toll ticket purchases, obtained from these devices.
The GPS-based data are transmitted to servers via GSM data connections. Location data for tracked heavy vehicles is transmitted every 2 seconds. The model therefore has access to individual route details, where the connection between data points and exact trucks is anonymised, thereby pseudonymising the dataset (Kan et al. [2019], Mikulai–Baracskai [2019]).
1. Methodology and data collection
As already mentioned, to fully cover every possible aspect of the complex area of the road network, a fuzzy signature-type rule base is proposed to organise the various attributes (inputs), just like Tamás–Kóczy [2007]. These attributes were col- lected based on experts’ knowledge. To determine whether they really play a signifi- cant role in the road evaluation result, they are constantly re-evaluated in a similar way as in Vámos–Kóczy–Bíró’s [2001] decision support system for assessing apart- ment buildings based on fuzzy signatures.
A separate fuzzy signature rule base is created for every relevant question for the micro, meso and macro level. For example: What should be done with a certain road section to improve its overall ‘goodness’? At this level, two major questions were proposed, which will be elaborated later.
After evaluating the rule base model of the question, a proper set of fuzzy sig- nature aggregations were determined. To make the question objectively measurable,
the investigated problem area was divided into building blocks. For example, the goodness of a car was evaluated through its specific interior, exterior, and pro- pulsion parameters. It was then divided into further sub-segments; under the interior category, the number of seats and the type of radio could be elaborated, and so on.
In the current proposed model, mostly the maximum, minimum, and weighted mean fuzzy aggregations are used, as these three operators help to obtain intuitively acceptable results. When the maximum is applied, it means that the ‘strongest’ attribute is highlighted, which dominates in the given road segment. In the case of the minimum, in reverse, the ‘weakest’ attribute determines the result, the one that weakens that road segment the most. In the case of a weighted mean aggregation, different weights are given to the attributes to take multiple factors into consideration, not only the extreme values, like in the previous two cases. (Molnárka–Kóczy [2011])
The advantage of this model is that any kind of road section could be evaluated objectively if all the relevant details are available for the given section. In this study, the model is narrowed to a small sub-network, that is, it currently deals only with the Western Hungarian road network between Budapest and the western border to Austria. However, any other road network could easily be included, disregarding the area or the country. Our aim is to create a flexible and general model.
The major input data are
– number of purchased e-toll tickets, – weather,
– quality of the road network, – historical accident statistics.
As the model focuses on Western Hungary, the available data are collected for this area. In the future, it will be easily replaceable or expandable with different in- puts, especially if, for example, live traffic data are available from the road operator or directly from the authorities.
As mentioned, some of the details are acquired from an e-toll operator compa- ny, which provides tickets for trucks over 3.5 tons. Different from most European Union countries, Hungary has a special e-toll purchase system for trucks. The system is based on actual GPS location, which provides broader information about the actual route and speed parameters of the vehicles than in Western European countries.
This study obtained two-second geolocation data on detailed routes of more than 16,000 vehicles. From these details, the actual speed and location was determined.
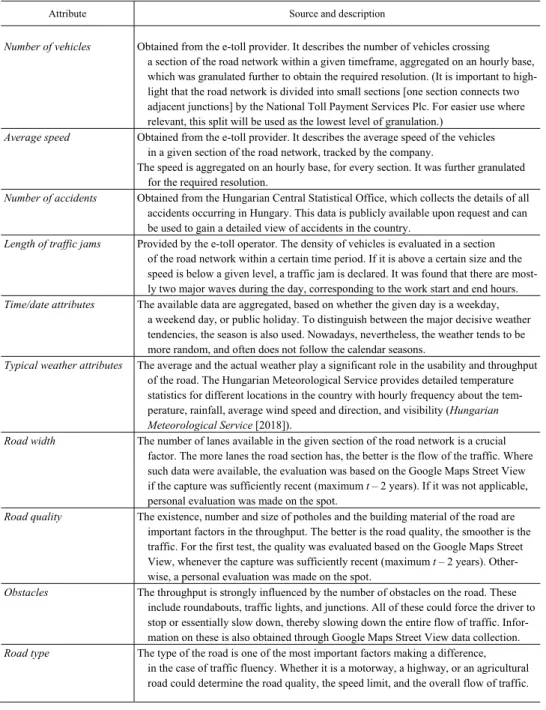
In Table 1, the used attributes are presented and also the way how the input da- ta were collected for them.
Table 1 Attributes and their input data sources
Attribute Source and description
Number of vehicles Obtained from the e-toll provider. It describes the number of vehicles crossing a section of the road network within a given timeframe, aggregated on an hourly base, which was granulated further to obtain the required resolution. (It is important to high- light that the road network is divided into small sections [one section connects two adjacent junctions] by the National Toll Payment Services Plc. For easier use where relevant, this split will be used as the lowest level of granulation.)
Average speed Obtained from the e-toll provider. It describes the average speed of the vehicles in a given section of the road network, tracked by the company.
The speed is aggregated on an hourly base, for every section. It was further granulated for the required resolution.
Number of accidents Obtained from the Hungarian Central Statistical Office, which collects the details of all accidents occurring in Hungary. This data is publicly available upon request and can be used to gain a detailed view of accidents in the country.
Length of traffic jams Provided by the e-toll operator. The density of vehicles is evaluated in a section of the road network within a certain time period. If it is above a certain size and the speed is below a given level, a traffic jam is declared. It was found that there are most- ly two major waves during the day, corresponding to the work start and end hours.
Time/date attributes The available data are aggregated, based on whether the given day is a weekday, a weekend day, or public holiday. To distinguish between the major decisive weather tendencies, the season is also used. Nowadays, nevertheless, the weather tends to be more random, and often does not follow the calendar seasons.
Typical weather attributes The average and the actual weather play a significant role in the usability and throughput of the road. The Hungarian Meteorological Service provides detailed temperature statistics for different locations in the country with hourly frequency about the tem- perature, rainfall, average wind speed and direction, and visibility (Hungarian Meteorological Service [2018]).
Road width The number of lanes available in the given section of the road network is a crucial factor. The more lanes the road section has, the better is the flow of the traffic. Where such data were available, the evaluation was based on the Google Maps Street View if the capture was sufficiently recent (maximum t – 2 years). If it was not applicable, personal evaluation was made on the spot.
Road quality The existence, number and size of potholes and the building material of the road are important factors in the throughput. The better is the road quality, the smoother is the traffic. For the first test, the quality was evaluated based on the Google Maps Street View, whenever the capture was sufficiently recent (maximum t – 2 years). Other- wise, a personal evaluation was made on the spot.
Obstacles The throughput is strongly influenced by the number of obstacles on the road. These include roundabouts, traffic lights, and junctions. All of these could force the driver to stop or essentially slow down, thereby slowing down the entire flow of traffic. Infor- mation on these is also obtained through Google Maps Street View data collection.
Road type The type of the road is one of the most important factors making a difference, in the case of traffic fluency. Whether it is a motorway, a highway, or an agricultural road could determine the road quality, the speed limit, and the overall flow of traffic.
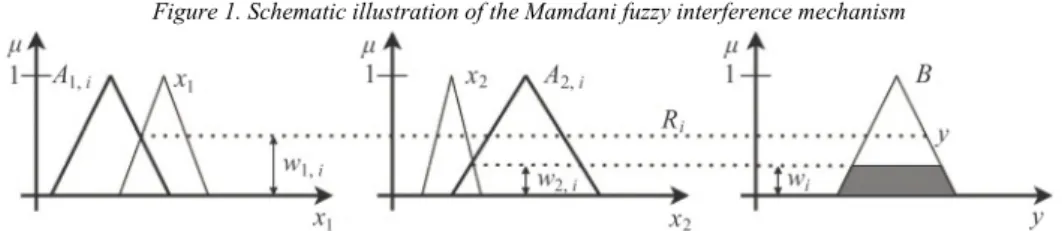
The classic and widespread fuzzy interference mechanism is used, first intro- duced by Mamdani–Assilian [1975], to evaluate the input data behind the attributes.
Figure 1. Schematic illustration of the Mamdani fuzzy interference mechanism
Note. wj, i characterises how far the input xj corresponds to the rule antecedent fuzzy set Aj, i in one di- mension. The weighting factor wi indicates how far the input x fulfils the antecedents of the rule Ri. In this example, B is the result of the minimum of the wj, i summary(Kóczy [2018]).
Source: The figure is taken from the lecture notes of Kóczy’s presentation at Széchenyi István Universi- ty, Győr [2018].
General rules were created, which generally could be described as the following:
If x1A1,i , x2 A2,i , ..., and xn An i,, then y B i /4/
where xn is the antecedent variable, which represents the input to the fuzzy system, and y is the consequent variable representing the output of the fuzzy system. An, i and Bi are fuzzy sets defined by functions μAn, i (x): X → [0,1] and μBi (y): Y → [0,1], respectively (Kóczy [2018]).
2. Key findings
To obtain a coherent overview of the possible optimization of the road network, two separate fuzzy signature rule bases were created to cover every aspect of the question area. Our first evaluation question is:
‘What should be done with the given road section?’
The following answers are expected:
– the given section needs extension;
– the given section needs reconstruction;
– the given section needs traffic jam or accident prevention;
– the given section is okay as it is.
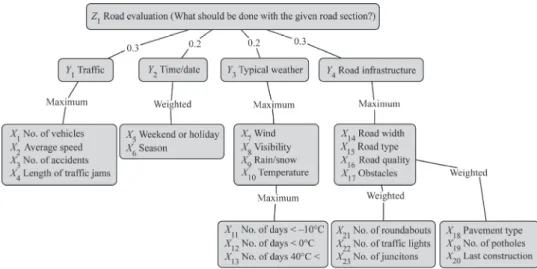
The model focuses on the goodness of the road and the following fuzzy signa- ture model is therefore proposed.
Figure 2. Fuzzy signature model for the rule base for road section evaluation based on traffic and road quality
Within this model, 20 independent variables were introduced, from which three (temperature, road quality, and obstacles) are intermediate-level aggregated variables (e.g., they have independent inputs that are aggregated by the operation indicated in Figure 2). It is important to highlight that each lowest level branch is assigned to its own root node (the intermediate node from where that branch ‘grows out’), which means, for example, that if somebody is interested only in the weather attribute of a given road section, they can evaluate only that aspect.
A membership function was proposed, and a potential value set for each varia- ble, which aims to evaluate the given attribute. For example, the X1 attribute (the number of vehicles) could assume the following values:
A1 ,
low medium high,
. /5/Figure 3. Membership function of the attribute X1 (number of vehicles)
The potential values of X1 and the other three attributes of Y1 ‘Traffic’ are reported in Table 2.
Table 2 Value set of X1–X4 and Y1
Attribute 1 2 3
X1 – Number of vehicles low medium high
X2 – Average speed slow normal fast
X3 – Number of accidents low medium high
X4 – Length of traffic jams short normal long
Y1 – Traffic poor acceptable good
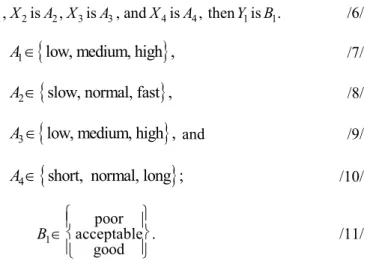
Based on the actual values, a generalised if-then rule set is proposed to struc- ture the results.
If X1 is , A X1 2 is A X2, 3 is , and A3 X4 is A4, then iY1 sB1. /6/
A1
low, medium, high ,
/7/A2 slow, normal, fast ,
/8/A3
low, medium, high ,
and /9/A4 short, normal, long ;
/10/1 poor acceptable . B good
/11/
Using this proposed structure, the results for Y2, Y3, and Y4 are obtained, the po- tential values of which are as follows:
– for Y2 (time/date)
B2 {short, medium, long}, /12/
– for Y3 (typical weather)
B3 bad, fair, good , and
/13/– for Y4 (road infrastructure)
B4 extremely poor, poor, acceptable, good .
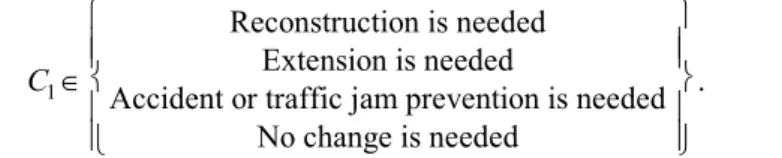
/14/Based on the above, the overall decision in the case of the original question (Z1 – What should be done with the given road section?) could be as follows:
1
Reconstruction is needed Extension is needed
Accident or traffic jam prevention is needed . No change is needed
C
/15/
To make holistic decisions, smaller sections are aggregated into one section, as illustrated in Figure 4. This aggregation also helps understand the building blocks of the model. In the figure, each major road is represented by a separate colour. We have two major types of road, motorway (M1 and M7) and highway (1, 7, and 8) in this area.
Figure 4. Node map of Western Hungary
In the second case, the same method is used but the evaluation question is:
‘Which road section is the riskiest?’
To answer this question, the number of accidents on the selected Western Hungarian section was taken into consideration. This is a significant indicator of how safe a particular road is.
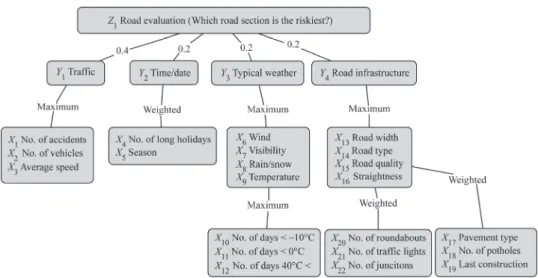
Figure 5. Fuzzy signature for the rule base for road section evaluation based on risk factors
In this case, 19 independent and three aggregated variables (X1–X22) were used.
The input parameters are slightly different as the data are aggregated on a monthly or yearly basis, since accidents do not happen daily or weekly on every road. Some of the variables could obtain similar values to those related to the first question.
The main difference is the outcome, which could be the following:
2
New signs or road painting is needed Speed reduction or speed camera is needed .
Road reconstruction is needed No change is needed C
/16/
For easier understanding and application, an online evaluator was created, which is available at http://www.tenten.hu. The evaluator allows users to freely eval- uate fuzzy signature rule bases and instantly visualise the results.
3. Discussion
The main goal was to create a reliable and informative model, which could ob- jectively identify the weak points of a road section and predict the necessary measures to address the non-compliant attributes, based on the available dataset.
The proposed model is ready for implementation and suitable for extension to
accommodate additional data inputs (such as data on other regions of Hungary, other countries’ road networks, traffic and weather data, etc.) and extended information on the traffic, including private cars and other vehicles, if further relevant sources can be accessed.
In the research, however, some limitations emerged, which could be addressed for more detailed results in the future. The first limitation was the weather data summary. Currently, weather stations are quite far away from each other, which means that only sparse data are received and they are simply interpolated (averaged) between stations. Thus, the present model is not yet capable of identifying local problem points from the weather perspective. For example, if there is a valley, where the average temperature is normally 2-3°C below the average obtained from the clos- est surrounding weather station data, a local freezing event could be missed, which is a factor that could significantly affect traffic behaviour in terms of the road section passing through that valley. This is a risk area, which should be taken into considera- tion in the further developed model.
Another limitation of the present case study model is that we currently have access mainly to data on vehicles over 3.5 tons, which is only one subset of the entire vehicle pool using the given section of the road. Indeed, vehicles over 3.5 tons con- stitute a very important subset since heavy trucks may slow down the entire traffic flow. Future research can extend the sampling, for example, with special traffic counting cameras.
In summary, we are confident that the new approach could help improve the overall conditions and safety of the roads, both in Hungary and in other countries.
4. Conclusion
The main goal was to create a model that was reliable in terms of the current dataset, could predict the required tasks, and could be implemented in practice.
The model proposed in this study meets these goals. It is also ready to accommodate further data inputs, such as other countries’ traffic and weather data if further rele- vant data sources are available.
Using this model may help the government to make proper decisions on the changes needed in the two most crucial questions, that is, whether the infrastructure requires extension to make it more usable, or if any kind of accident prevention should be installed. This could potentially increase the throughput of the road infrastructure, which may lead to economic and environmental advantages in the long term.
References
BJØRNSKOV,C.–SVENDSEN,G. [2003]: Measuring Social Capital – Is There a Single Underlying Explanation? Working Paper No. 03-5. Department of Economics Aarhus School of Busi- ness. https://pure.au.dk/ws/files/32304081/03-5_gts.pdf
GLEICK,J. [2011]: Chaos: Making a New Science. Open Road Media. New York.
GOMES,G.–GAN, Q.–BAYEN,A. [2018]: A methodology for evaluating the performance of model-based traffic prediction systems. Transportation Research Part C: Emerging Technologies. Vol. 96. November. pp. 160–169. https://doi.org/10.1016/j.trc.2018.09.004 HUNGARIAN METEOROLOGICAL SERVICE [2018]: Weather data. https://www.met.hu/en/idojaras/
KAN,Z.–TANG,L.–KWAN,M.P.–REN,C.–LIU,D.–LI,Q. [2019]: Traffic congestion analysis at the turn level using Taxis’ GPS trajectory data. Computer, Environment and Urban Systems.
Vol. 74. March. pp. 229–243. https://doi.org/10.1016/j.compenvurbsys.2018.11.007 KÓCZY,L. T. [2018]: An Introduction to Fuzzy Sets and Systems. Lecture presentation at Széchenyi
István University. Győr.
MAMDANI,E.H. –ASSILIAN,S. [1975]: An experiment in linguistic synthesis with a fuzzy logic controller. International Journal of Man-Machine Studies. Vol. 7. No. 1. pp. 1–13.
https://doi.org/10.1016/S0020-7373(75)80002-2
MIKULAI, G. CS. – BARACSKAI, Z. [2019]: Modeling complex traffic system behaviour.
In: da Silva, A. L. – Tomic, D. – Grilec, A. (eds.): Economic and Social Development:
39th International Scientific Conference on Economic and Social Development –
‘Sustainability from an Economic and Social Perspective’. Book of Proceedings. Varazdin Development and Entrepreneurship Agency. Lisbon. pp. 274–279.
MOLNÁRKA,G.I.–KÓCZY,L.T. [2011]: Decision support system for evaluating existing apartment buildings based on fuzzy signatures. International Journal of Computers, Communications and Control. Vol. 6. No. 3. pp. 442–457. https://doi.org/10.15837/ijccc.2011.3.2129
NATIONAL TOLL PAYMENT SERVICES PLC. [2021]: National Toll Payment Services Declaration Description. http://toll-charge.hu/articles/article/e-toll-information-and-purchase
NOGAL,M.–HONFI, D.[2019]: Assessment of road traffic resilience assuming stochastic user behaviour. Reliability Engineering and System Safety. Vol. 185. May. pp. 72–83.
https://doi.org/10.1016/j.ress.2018.12.013
TAMÁS,K. –KÓCZY, L.[2007]: Mamdani-type inference in fuzzy signature based rule bases.
In: Szakál, A. (ed.): Proceedings of the 8th International Symposium of Hungarian Researchers on Computational Intelligence and Informatics CINTI 2007. Budapesti Műszaki Főiskola–Magyar Fuzzy Társaság. Budapest. pp. 513–525.
THEOFILATOS,A. [2017]: Incorporating real-time traffic and weather data to explore road accident likelihood and severity in urban arterials. Journal of Safety Research. Vol. 61. June.
pp. 9–21. https://doi.org/10.1016/j.jsr.2017.02.003
VÁMOS,T.–KÓCZY,L.T.–BÍRÓ,G. [2001]: Fuzzy signatures in data mining, In: Smith, M. H. – Gruver, W. A. – Hall, L. O. (eds.): Proceedings of the Joint 9th IFSA (International Fuzzy Systems Association) World Congress and 20th NAFIPS (North American Fuzzy Information Processing Society) International Conference. Vols. 1–5. Institute of Electrical and Electronics Engineers. Piscataway. pp. 2842–2846. https://doi.org/10.1109/NAFIPS.2001.943677 WU,J.–ZENG,J.–CHEN,Z.–TSE,C.K.–CHEN,B. [2018]: Effects of traffic generation patterns on
the robustness of complex networks. Physica A: Statistical Mechanics and Its Applications.
Vol. 492. February. pp. 871–877. https://doi.org/10.1016/j.physa.2017.11.016