*Corresponding author: Barna Vásárhelyi, Department of Laboratory Medicine, Semmelweis University Nagyvárad tér 4., 1089 Budapest, Hungary, Tel: 0036-20-6663246; Fax: 0036-1- 2100278 Ext. 56492; E-mail:
vasarhelyi.barna@med.semmelweis-univ.hu
Received July 24, 2014; Accepted August 28, 2014; Published September 01, 2014
Citation: Győrffy A, Kormos M, Bartha L, Szabó A, Győrffy B, et al. (2014) Validation of Biomarkers in Gene Expression Datasets of Inflammatory Bowel Disease: IL13RA2, PTGS2 and WNT5A as Predictors of Responsiveness to Infliximab Therapy. J Proteomics Bioinform 7: 272-277. doi:10.4172/jpb.1000329 Copyright: © 2014 Győrffy A, et al. This is an open-access article distributed under the terms of the Creative Commons Attribution License, which permits unrestricted use, distribution, and reproduction in any medium, provided the original author and source are credited
Abstract
Background: Some patients with inflammatory bowel disease (IBD) do not respond to infliximab (IFX) therapy.
Gene expression studies revealed genes that may help to predict non-responding IBD patients. Our purpose was to validate the discriminating power of published genes.
Methods: Microarray datasets of IBD patients responding or non-responding to IFX were downloaded from GEO database (‘transcriptomic arm’). Published genes discriminating responding and non-responding patients were identified in PubMed (‘biomarker arm’). Using ROC-analysis, the discriminating performance of genes in ‘biomarker arm’ were re-tested in each datasets of ‘transcriptomic arm’. We also performed an independent analysis of colon biopsy datasets to identify novel discriminating genes.
Results: The transcriptomic arm of four GEO datasets (3 and 1 from colon biopsies and blood cells, respectively) included 99 patients (of those, 59 and 40 were IFX responder and non-responder, respectively). Of the 65 candidate genes reported in biopsy specimens 25 genes discriminated significantly (p<0.05) infliximab responders and non- responders in the three biopsy datasets consistently. Of the 39 candidate genes reported in peripheral blood 9 genes provided significant discrimination after re-testing. Independent analysis of three biopsy datasets identified the top five genes. Three genes (IL13RA2, PTGS2 and WNT5A) were highly effective discriminator in each analysis.
Conclusion: This analysis identified IL13RA2, PTGS2 and WNT5A, three genes in colonic tissues of IBD patients as suitable to discrimination between patients responding and non-responding to IFX therapy. These genes encode proteins implicated in intestinal pathology; the high expression in non-responding patients may indicate important targets in IBD therapy.
Validation of Biomarkers in Gene Expression Datasets of Inflammatory Bowel Disease: IL13RA2, PTGS2 and WNT5A as Predictors of
Responsiveness to Infliximab Therapy
András Győrffy1, Máté Kormos1, Luca Bartha1, András Szabó2, Balázs Győrffy2,3, Jan Budczies4 and Barna Vásárhelyi1,5*
1MTA-SE Pediatrics and Nephrology Research Group, Budapest, Hungary
22nd Department of Pediatrics, Semmelweis University, Budapest, Hungary
3MTA TTK Lendület Cancer Biomarker Research Group, Budapest, Hungary
4Institute of Pathology, Charité-Universitätsmedizin Berlin, 10117 Berlin, Germany
5Department of Laboratory Medicine, Semmelweis University Budapest, Hungary
Keywords:
Infliximab; Gene expression; Inflammatory bowel diseaseIntroduction
Infliximab therapy controls effectively the signs and symptoms of inflammatory bowel disease (IBD) in the majority of patients who fail to respond conventional therapy. About 40% of IBD patients, however, are not responding and are exposed to risks of IFX therapy without clinical benefits [1]. Identification of non-responding patients before the therapy is, therefore, a big challenge for clinicians. Clinical factors determining pharmacokinetics [2] such as baseline laboratory data, medicinal history, smoking, dosing schedules are implicated in therapeutic failure. However, patients with comparable clinical characteristics still differ largely in term of their responsiveness to IFX therapy. Therefore, biomarkers are needed to classify IBD patients whether they are candidate or not to IFX treatment.
Biomarkers may vary in term of their nature, physiologic function and the sample of origin. While antibodies against IFX are associated with loss of response [3], they are not suitable to predict response in IFX-naive patients. Recently, in addition to routine laboratory indicators and immune markers [4] much research activity focused on the measurement of gene expression values in colon biopsy samples and peripheral blood to predict the individual response to IFX in IFX- naive IBD patients. However, study designs including methods used to determine gene expression and patient populations to be enrolled were quite heterogeneous. In addition, the majority of these studies investigated some specific elements or pathways of disease pathogenesis and did not analyze the gene expression patterns as a whole. Therefore,
the information originated from these studies is unavoidably skewed to these factors and may ignore important detail beyond the scope of that research. These limitations make the comparison and validation of the individual study results quite difficult.
The availability of recent gene expression microarray data obtained in IBD groups later responding and non-responding to IFX therapy provides an opportunity to re-analyze how the published genes would perform in another IBD population.
In this study we cross-validated published data with GEO datasets.
We also analyzed whether biomarkers identified in blood or biopsy samples reflect gene expression patterns in biopsies and peripheral blood mononuclear cells, respectively. As a result of this work we
identified genes that were consistently suitable to discriminate between IBD patients responding and non-responding to IFX therapy in all analyzed datasets of colon biopsy specimens.
Materials and Methods
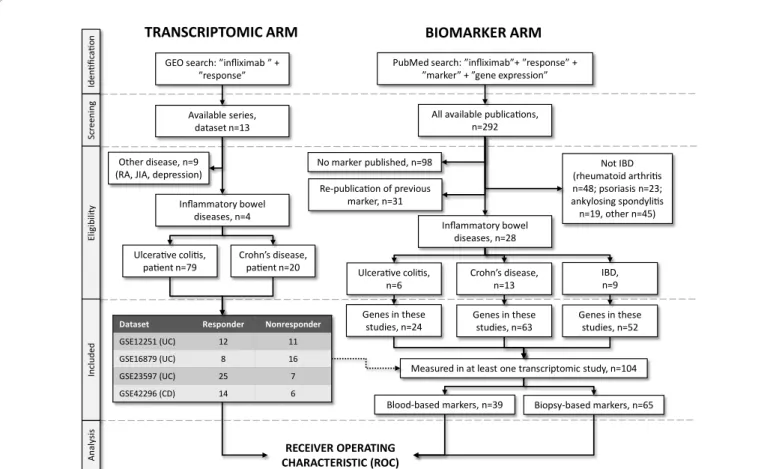
Literature searchWe have set up the present meta-analysis according to "Preferred Reporting Items for Systematic Reviews and Meta-Analyses" guidelines published in 2009 (PRISMA)[5]. We used a pipeline requiring for both the markers to be validated and the data to be used for validation to be identified by a search of available publications and datasets. The design for cross-validation process (including identification of transcriptome datasets and published biomarkers) is presented in Figure 1.
Construction of GEO-based microarray database: the transcriptome arm
We have searched GEO (http://www.ncbi.nlm.nih.gov/gds) using the keywords "infliximab" and "response" to identify transcriptomic datasets publishing response data against infliximab treatment. Only datasets including at least five patients for each included cohort (responder and non-responder) were considered. Patients receiving placebo were also excluded from the analysis. The series matrix file for each eligible dataset was downloaded and subsequently each dataset was processed separately.
Genetic biomarkers of IFX responsiveness: the ‘biomarker arm’
A search was performed in Pubmed using combinations of the keywords ”infliximab”, ”response”, ”marker” and ”gene expression”.
Only publications in English language were considered. Repeated publications were identified and excluded so that each gene was included just once in the final database. In addition, only studies publishing gene expression biomarkers for inflammatory bowel disease, Crohn’s disease and ulcerative colitis were included. We also recorded whether the biomarker relates to a gene determined in blood or a biopsy sample.
The unique gene symbols and names were identified for each gene by querying the online repository of the HUGO Gene Nomenclature Committee (http://www.genenames.org).
Statistical analyses
Receiver Operating Characteristics (ROC) analysis was performed in the R statistical environment (http://www.r-project.org) using Biobase Bioconductor libraries (http://www.bioconductor.org/). In a ROC analysis the true positive rate (=sensitivity of the marker) is compared to the false positive rate (=100-specificity of the marker) for each available cut-off point of a parameter. Thus, each value of the ROC curve represents a sensitivity/specificity pair corresponding to a particular decision threshold. Then, area under the ROC curve (AUC) is computed to measure of how well this parameter can distinguish between the two diagnostic groups (responder/nonresponder). The AUC value of a perfect biomarker is 1.0.
RECEIVER OPERATING CHARACTERISTIC (ROC) Ulcerative colitis,
patient n=79 Crohn’s disease, patient n=20
Dataset Responder Nonresponder
GSE12251 (UC) 12 11
GSE16879 (UC) 8 16
GSE23597 (UC) 25 7
GSE42296 (CD) 14 6
IdentificationScreeningEligibilityIncludedAnalysis
GEO search: ”infliximab ” +
”response”
Available series, dataset n=13
Inflammatory bowel diseases, n=4
PubMed search: ”infliximab”+ ”response” +
”marker” + ”gene expression”
Re-publication of previous marker, n=31
No marker published, n=98 Not IBD
(rheumatoid arthritis n=48; psoriasis n=23;
ankylosing spondylitis n=19, other n=45) Inflammatory bowel
diseases, n=28
Genes in these studies, n=24
All available publications, n=292
Ulcerative colitis,
n=6 Crohn’s disease,
n=13 IBD,
n=9 Genes in these
studies, n=63 Genes in these studies, n=52
BIOMARKER ARM TRANSCRIPTOMIC ARM
Other disease, n=9 (RA, JIA, depression)
Measured in at least one transcriptomic study, n=104
Blood-based markers, n=39 Biopsy-based markers, n=65
Figure 1: A flow diagram depicting the exploration of infliximab therapy response biomarker candidates in the published scientific literature and the search for transcriptomic datasets in GEO (www.ncbi.nlm.nih.gov/geo/) according to the PRISMA guidelines. (UC: Ulcerative Colitis, IBD: Inflammatory Bowel Disease, CD: Crohn’s Disease, JIA: Juvenile Idiopathic Arthritis, HUGO: Human Genome Organization Gene Nomenclature Committee)
We also set up an R function to enable instant reproduction of all of the results published in our present study. An R script for ROC analysis was also added to the supplemental material (Supplemental R script 1.R) with an additional input file needed for designation of the samples into responder and non-responder cohorts-these data were originally published in the series matrix files in GEO, but could not be downloaded in an automated way (Supplemental Table 1). The ROC_stats function in the supplemented script calculates the p-values that test the null hypothesis that the area AUC really equals 0.5. First, the script calculates the standard error of our null hypothesis from which the function derives the z-score. Finally, the p-value is calculated by the transformation of the z-score using the normal distribution. In addition, the function performs downloading and parsing for each of the original series matrix files using the GEOquery package (http://
watson.nci.nih.gov/~sdavis/), therefore, there is no need to include these in the supplemental material. This new ROC analysis script not only enables the user to validate the results of present study, but also provides an easy to use tool for independent validation of new biomarker candidates.
With this approach, we re-tested the discrimination performance of each of the 104 published genes in the 4 GEO datasets. Statistical significance was set at p<0.05 and the genes had to reach statistical significance using the average p value across all datasets.
An independent analysis of GEO datasets was also performed using the same statistical approach.
Results
Identification of transcriptomic databases
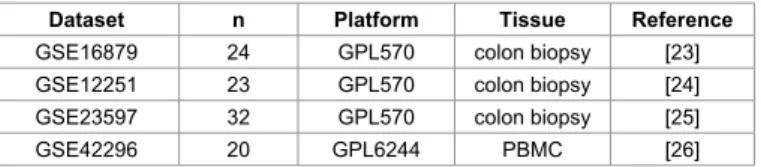
The database search in GEO resulted in all together 13 datasets, of which four datasets were related to IBD. Three and one GEO dataset were originated from colon biopsies and blood mononuclear cells (PBMC), respectively. These were related to 59 and 40 IFX responder and non-responder patients, respectively. Table 1 presents the characteristics of these 4 datasets; clinical characteristics for each patient are listed in Supplemental Table 2. The entire database contains 20,168 genes–one should note, however, that some inconsistencies regarding gene lists measured in individual datasets exist. Genes originated from biomarker studies were verified by each of the four independent datasets.
Biomarkers
We identified 292 publications investigating candidate biomarkers of non-responsiveness to IFX therapy. Thirty-one papers repeatedly tested biomarkers of previous studies, while 98 studies investigated biomarkers other than gene expression. Of the remaining 163 publications, 28 studies enrolled IBD patients. In these studies a total of 139 genes were tested as possible biomarkers of IFX responsiveness. Of these, 104 were present in at least one of the 4 GEO datasets (Figure 1).
Published biomarkers of response to infliximab therapy To avoid batch effects, the datasets were not combined into one
set. Instead, we performed the entire analysis in each of the datasets.
Then, 65 and 39 genetic biomarkers identified in biopsy samples and blood were related to GEO datasets of biopsy samples and PBMC. The complete results of analysis for each of the 104 candidate genes within each of the four datasets and the link to the original publication in PubMed are listed in Supplemental Table 3.
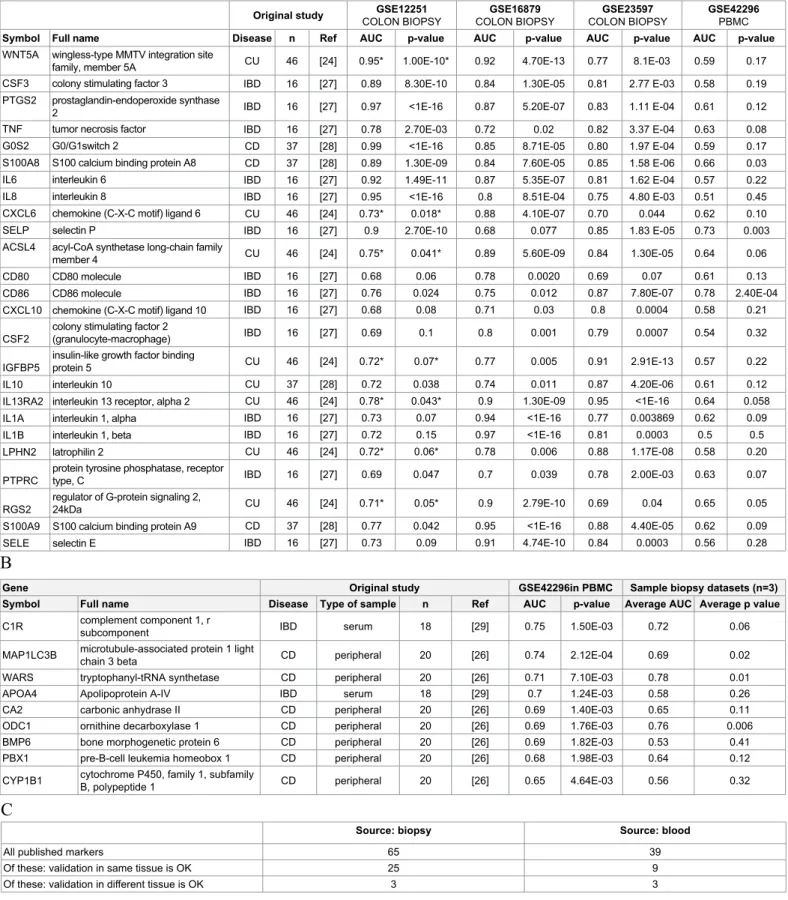
Of the 65 candidate genes reported as possible biomarker in biopsy specimens just 25 genes discriminated significantly (p<0.05) infliximab responders and non-responders in the three biopsy datasets consistently. The discriminative power of these biomarkers is listed in Table 2A in term of ROC AUC (area under the curve) values. Of note, just three biomarkers (S100A8, SELP and CD86) were significant also in PBMC dataset.
Of the 39 candidate genes reported as possible biomarker in peripheral blood just 9 genes in PBMC datasets provided significant discrimination (p<0.05) between infliximab responders and non- responders. The discriminative power of these biomarkers is listed in Table 2B in term of ROC AUC values; just three biomarker (WARS, MAP1LC3B and ODC1) were significant also in biopsies.
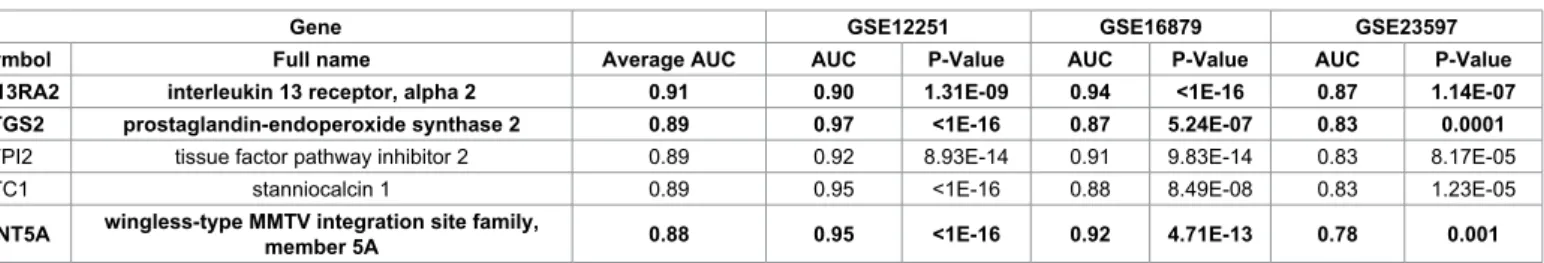
Analysis of datasets irrespectively of published results The complete results of analysis including AUC values and p values for all available 20,168 genes in each of the four datasets is presented as Supplemental Table 4. In order to identify the most robust markers, we considered only those markers which were significant across all three independent analyses of colon biopsy samples and with the average of ROC values. The top five of these markers are listed in Table 3; of those, three (IL13RA2, PTGS2 and WNT5A) were also identified in earlier studies.
Discussion
The discrimination of IBD patients as possible responders and non- responders before the initiation of IFX therapy is a still unmet clinical need. Previous attempts to predict therapeutic response identified several genes in colon biopsy samples and peripheral blood.
Before one would start to investigate clinical usefulness of biomarker cited as predictive for therapeutic response in a larger population, the published data are worth to be re-validated in independent cohorts. In our study the cross-validation of the discriminating biomarkers was performed with ROC analysis. ROC AUC curve and associated p values were generated using an R-script (available as supplemental material).
With this approach we demonstrated that merely 17 and 23 per cent of published biomarkers provided consistently significant discrimination between responding and non-responding patients in transcriptomic datasets of the same kind of sample (colon and PBMC, respectively).
Of note, these biomarkers were not overlapping: biomarkers identified in colon biopsy samples were not identical to those in peripheral blood.
Therefore, datasets of PBMC and biopsy samples are not comparable and their information content cannot be pooled.
Additionally, to confirm the possible relevance of some published genes, we also performed a de novo analysis on biopsy datasets. Of the top five genes we identified as very efficient discriminators in microarray datasets, two genes were novel, while three genes (IL13RA2, PTGS2 and WNT5A) published earlier were validated in our study. All of these genes exhibited significantly increased expression in colon biopsy samples of IBD patients not responding to IFX therapy. (We should note, however, that the prediction would be further improved if instead of single genes combinations of gene expression levels would be
Dataset n Platform Tissue Reference
GSE16879 24 GPL570 colon biopsy [23]
GSE12251 23 GPL570 colon biopsy [24]
GSE23597 32 GPL570 colon biopsy [25]
GSE42296 20 GPL6244 PBMC [26]
Table 1: Summary of the GEO datasets included in the construction of the transcriptomic database for the meta-analysis of predictive power for infliximab therapy response.
Original study GSE12251
COLON BIOPSY GSE16879
COLON BIOPSY GSE23597
COLON BIOPSY GSE42296
PBMC
Symbol Full name Disease n Ref AUC p-value AUC p-value AUC p-value AUC p-value
WNT5A wingless-type MMTV integration site
family, member 5A CU 46 [24] 0.95* 1.00E-10* 0.92 4.70E-13 0.77 8.1E-03 0.59 0.17
CSF3 colony stimulating factor 3 IBD 16 [27] 0.89 8.30E-10 0.84 1.30E-05 0.81 2.77 E-03 0.58 0.19
PTGS2 prostaglandin-endoperoxide synthase
2 IBD 16 [27] 0.97 <1E-16 0.87 5.20E-07 0.83 1.11 E-04 0.61 0.12
TNF tumor necrosis factor IBD 16 [27] 0.78 2.70E-03 0.72 0.02 0.82 3.37 E-04 0.63 0.08
G0S2 G0/G1switch 2 CD 37 [28] 0.99 <1E-16 0.85 8.71E-05 0.80 1.97 E-04 0.59 0.17
S100A8 S100 calcium binding protein A8 CD 37 [28] 0.89 1.30E-09 0.84 7.60E-05 0.85 1.58 E-06 0.66 0.03
IL6 interleukin 6 IBD 16 [27] 0.92 1.49E-11 0.87 5.35E-07 0.81 1.62 E-04 0.57 0.22
IL8 interleukin 8 IBD 16 [27] 0.95 <1E-16 0.8 8.51E-04 0.75 4.80 E-03 0.51 0.45
CXCL6 chemokine (C-X-C motif) ligand 6 CU 46 [24] 0.73* 0.018* 0.88 4.10E-07 0.70 0.044 0.62 0.10
SELP selectin P IBD 16 [27] 0.9 2.70E-10 0.68 0.077 0.85 1.83 E-05 0.73 0.003
ACSL4 acyl-CoA synthetase long-chain family
member 4 CU 46 [24] 0.75* 0.041* 0.89 5.60E-09 0.84 1.30E-05 0.64 0.06
CD80 CD80 molecule IBD 16 [27] 0.68 0.06 0.78 0.0020 0.69 0.07 0.61 0.13
CD86 CD86 molecule IBD 16 [27] 0.76 0.024 0.75 0.012 0.87 7.80E-07 0.78 2.40E-04
CXCL10 chemokine (C-X-C motif) ligand 10 IBD 16 [27] 0.68 0.08 0.71 0.03 0.8 0.0004 0.58 0.21
CSF2 colony stimulating factor 2
(granulocyte-macrophage) IBD 16 [27] 0.69 0.1 0.8 0.001 0.79 0.0007 0.54 0.32
IGFBP5 insulin-like growth factor binding
protein 5 CU 46 [24] 0.72* 0.07* 0.77 0.005 0.91 2.91E-13 0.57 0.22
IL10 interleukin 10 CU 37 [28] 0.72 0.038 0.74 0.011 0.87 4.20E-06 0.61 0.12
IL13RA2 interleukin 13 receptor, alpha 2 CU 46 [24] 0.78* 0.043* 0.9 1.30E-09 0.95 <1E-16 0.64 0.058
IL1A interleukin 1, alpha IBD 16 [27] 0.73 0.07 0.94 <1E-16 0.77 0.003869 0.62 0.09
IL1B interleukin 1, beta IBD 16 [27] 0.72 0.15 0.97 <1E-16 0.81 0.0003 0.5 0.5
LPHN2 latrophilin 2 CU 46 [24] 0.72* 0.06* 0.78 0.006 0.88 1.17E-08 0.58 0.20
PTPRC protein tyrosine phosphatase, receptor
type, C IBD 16 [27] 0.69 0.047 0.7 0.039 0.78 2.00E-03 0.63 0.07
RGS2 regulator of G-protein signaling 2,
24kDa CU 46 [24] 0.71* 0.05* 0.9 2.79E-10 0.69 0.04 0.65 0.05
S100A9 S100 calcium binding protein A9 CD 37 [28] 0.77 0.042 0.95 <1E-16 0.88 4.40E-05 0.62 0.09
SELE selectin E IBD 16 [27] 0.73 0.09 0.91 4.74E-10 0.84 0.0003 0.56 0.28
Gene Original study GSE42296in PBMC Sample biopsy datasets (n=3)
Symbol Full name Disease Type of sample n Ref AUC p-value Average AUC Average p value
C1R complement component 1, r
subcomponent IBD serum 18 [29] 0.75 1.50E-03 0.72 0.06
MAP1LC3B microtubule-associated protein 1 light
chain 3 beta CD peripheral 20 [26] 0.74 2.12E-04 0.69 0.02
WARS tryptophanyl-tRNA synthetase CD peripheral 20 [26] 0.71 7.10E-03 0.78 0.01
APOA4 Apolipoprotein A-IV IBD serum 18 [29] 0.7 1.24E-03 0.58 0.26
CA2 carbonic anhydrase II CD peripheral 20 [26] 0.69 1.40E-03 0.65 0.11
ODC1 ornithine decarboxylase 1 CD peripheral 20 [26] 0.69 1.76E-03 0.76 0.006
BMP6 bone morphogenetic protein 6 CD peripheral 20 [26] 0.69 1.82E-03 0.53 0.41
PBX1 pre-B-cell leukemia homeobox 1 CD peripheral 20 [26] 0.68 1.98E-03 0.64 0.12
CYP1B1 cytochrome P450, family 1, subfamily
B, polypeptide 1 CD peripheral 20 [26] 0.65 4.64E-03 0.56 0.32
A
B
C
Source: biopsy Source: blood
All published markers 65 39
Of these: validation in same tissue is OK 25 9
Of these: validation in different tissue is OK 3 3
Table 2: Detailed results for previously published biomarker candidates including characteristics of the original studies describing the marker as well as performance of the gene to discriminate responder and non-responder patients after infliximab therapy in each available dataset. Biomarkers identified in colon biopsy specimens (A) include genes with a p value <0.05 as the average of the three biopsy-based dataset is listed. Biomarkers identified in blood samples (B) and number of genes with a consistent discriminator performance in each dataset of the same type of sample (C). Ref #17 has more patients as in Table 1 because in the original study additional samples were included in the discovery set. *Genes identified in GSE12251 were also described in the paper where GSE12251 was published–these are included because their average p-value is significant in the two other datasets.
studies, Wnt5a (a noncanonical Wnt ligand) potentiated colonic crypt regeneration after tissue injury [17]. On the other hand, high Wnt5a levels were associated with poor prognosis in colorectal cancer patients and promoted human colon cancer cell migration in animals [18]. The contribution of Wnt5a to polyp formation in colon was also suggested [19]. Wnt5a is also involved in the induction of epithelial- to-mesenchymal transition [20], a common phenomenon in chronic inflammatory conditions.
Data suggest that the relative absence of an endogenous Wnt- inhibitor in colonic myofibroblasts (and, consequently, the increase of Wnt levels in crypts) is associated with an increased risk of cancer in ulcerative colitis [21]. Although there are no data available whether IBD patients non-responding to IFX therapy are at an increased risk for colon cancer, an animal study indicated that IBD animals treated with IFX are protected from colon cancer [22-29]. Therefore, one may also speculate that patients having high Wnt5a gene expression may be subjected to IFX non-responsiveness and, also, are at a higher risk of cancer. These data together are suggestive that the causative role of Wnt5a in resistance to IFX therapy may be worth to be investigated further.
The major limitation of our in silico analysis is the verification of our results in independent datasets. However, the lack of an available biobank with IFX responding and non-responding patients’ biopsy specimens prevented the prompt investigation of this issue; several years are required to complete this task. Therefore, this analysis should be regarded rather as a hypothesis-generating one.
In conclusion, our analysis revealed that IL13RA2, PTGS2 and WNT5A, genes expressed in colonic tissues of IBD patients are suitable to discriminate patients responding and non-responding to IFX therapy. As all three genes encode proteins that are implicated in intestinal homeostasis and pathology; the difference in their expression in responding and non-responding patients may indicate important diagnostic targets in IBD therapy.
Acknowledgement
Sources of support: OTKA grants K 108655 and 101661.
References
1. Ben-Horin S, Kopylov U, Chowers Y (2014) Optimizing anti-TNF treatments in inflammatory bowel disease. Autoimmun Rev 13: 24-30.
2. Ordás I, Mould DR, Feagan BG, Sandborn WJ (2012) Anti-TNF monoclonal antibodies in inflammatory bowel disease: pharmacokinetics-based dosing paradigms. Clin Pharmacol Ther 91: 635-646.
3. Nanda KS, Cheifetz AS, Moss AC (2013) Impact of antibodies to infliximab on clinical outcomes and serum infliximab levels in patients with inflammatory bowel disease (IBD): a meta-analysis. Am J Gastroenterol 108: 40-47.
4. Zampeli E, Gizis M, Siakavellas SI, Bamias G (2014) Predictors of response to anti-tumor necrosis factor therapy in ulcerative colitis. World J Gastrointest Pathophysiol 5: 293-303.
used; however, the relatively small sample size would not allow to make established conclusions.)
In addition to use as biomarkers to discriminate between IBD patients responding and non-responding to IFX treatment these genes may provide novel perspectives in IBD pharmacotherapy. While the major limitation of our in silico study is the absence of protein levels, one may assume that transcriptome is representative for the proteome.
Therefore, one may speculate that proteins encoded by these genes as PTGS2, IL13RA and Wnt5a may predict and, theoretically, contribute to the responsiveness to IFX in IBD.
PTGS2 is the gene that encodes the enzyme prostaglandin- endoperoxide synthase also called as cyclooxygenase-2 (COX-2) the enzyme is responsible for the production of prostaglandin H2, an inflammatory mediator from arachinodic acid. Previous observations indicate higher than normal PTGS2 expression in colonic epithelial cells in IBS [6] and that PTGS2 expression is associated with disease activity [7]. In addition to these data our analysis indicates that patients do not responding to IFX therapy may exhibit even higher PTGS expression than those with appropriate response. This finding is in line with the demonstrated contribution of inflammatory prostaglandins to the pathogenesis of IBD.
On the other hand, COX-2 derived prostaglandins also have a role in mucosal defense in the small intestine and colon [8]. Hence, inhibition of COX-2 is a double-edged sword as it is reflected by controversial results of controlled trials and experimental colitis models with COX-2 inhibitors [9]. Administration of COX-2 inhibitors was associated with the cited as a possible contributor to the integrity of intestinal mucosa, in the healing of gastrointestinal ulcers and in the modulation of IBD [10], but exacerbation of IBD was also reported in several studies with COX-2 inhibition [11].
Interleukin (IL)-13 is an important regulator of epithelial apoptosis in immune mediated disorders [12]. It plays a role in inflammation, mucus production, tissue remodeling, and fibrosis [13]. Disturbed IL-13-expression may play a role in immune dysregulation [14].
IL-13 signaling is mediated by the type-2 IL-4 receptor. The IL-13 receptor alpha 2 (IL13RA2) inhibits the activity of IL-13; IL-13Ralpha2 contributes to the down-regulation of a chronic and pathogenic Th2- mediated immune response [15]. These literary data support the results of our analysis indicating the association of an abnormal IL13RA2 expression with infliximab unresponsiveness.
Literary data on Wnt5a gene product are also promising. Members of Wnt family are glycoproteins actively secreted by cells and along with other pathways (e.g. FGF, Notch, BMP, and Hedgehog signalization) they contribute to intestinal stem cell biology, the maintenance of homeostasis, and, in case of malfunctioning, to pathological conditions including inflammation and cancer [16]. Regarding Wnt5a, several possible functions in gastrointestinal tract were reported. In animal
Gene GSE12251 GSE16879 GSE23597
Symbol Full name Average AUC AUC P-Value AUC P-Value AUC P-Value
IL13RA2 interleukin 13 receptor, alpha 2 0.91 0.90 1.31E-09 0.94 <1E-16 0.87 1.14E-07
PTGS2 prostaglandin-endoperoxide synthase 2 0.89 0.97 <1E-16 0.87 5.24E-07 0.83 0.0001
TFPI2 tissue factor pathway inhibitor 2 0.89 0.92 8.93E-14 0.91 9.83E-14 0.83 8.17E-05
STC1 stanniocalcin 1 0.89 0.95 <1E-16 0.88 8.49E-08 0.83 1.23E-05
WNT5A wingless-type MMTV integration site family,
member 5A 0.88 0.95 <1E-16 0.92 4.71E-13 0.78 0.001
Table 3: Top five genes ranked by AUC with consistently significant predictive values in all the 3 GEO datasets of colon biopsy samples. Bold: genes overlapping to Table 2.
5. Moher D, Liberati A, Tetzlaff J, Altman DG (2009) Preferred reporting items for systematic reviews and meta-analyses: the PRISMA Statement. Open Med 3:
e123-e130.
6. Singer II, Kawka DW, Schloemann S, Tessner T, Riehl T, et al. (1998) Cyclooxygenase 2 is induced in colonic epithelial cells in inflammatory bowel disease. Gastroenterology 115: 297-306.
7. Hendel J, Nielsen OH (1997) Expression of cyclooxygenase-2 mRNA in active inflammatory bowel disease. Am J Gastroenterol 92: 1170-1173.
8. Wallace JL (2001) Prostaglandin biology in inflammatory bowel disease.
Gastroenterol Clin North Am 30: 971-980.
9. Paiotti AP, Marchi P, Miszputen SJ, Oshima CT, Franco M, et al. (2012) The role of nonsteroidal antiinflammatory drugs and cyclooxygenase-2 inhibitors on experimental colitis. In Vivo 26: 381-393.
10. Cipolla G, Crema F, Sacco S, Moro E, de Ponti F, et al. (2002) Nonsteroidal anti-inflammatory drugs and inflammatory bowel disease: current perspectives.
Pharmacol Res 46: 1-6.
11. Kefalakes H, Stylianides TJ, Amanakis G, Kolios G (2009) Exacerbation of inflammatory bowel diseases associated with the use of nonsteroidal anti- inflammatory drugs: myth or reality? Eur J Clin Pharmacol 65: 963-970.
12. Schulzke JD, Bojarski C, Zeissig S, Heller F, Gitter AH, et al. (2006) Disrupted barrier function through epithelial cell apoptosis. Ann N Y Acad Sci 1072: 288- 299.
13. Mentink-Kane MM, Wynn TA (2004) Opposing roles for IL-13 and IL-13 receptor alpha 2 in health and disease. Immunol Rev 202: 191-202.
14. Mannon P, Reinisch W (2012) Interleukin 13 and its role in gut defence and inflammation. Gut 61: 1765-1773.
15. Chiaramonte MG, Mentink-Kane M, Jacobson BA, Cheever AW, Whitters MJ, et al. (2003) Regulation and function of the interleukin 13 receptor alpha 2 during a T helper cell type 2-dominant immune response. J Exp Med 197: 687-701.
16. Katoh M (2007) Networking of WNT, FGF, Notch, BMP, and Hedgehog signaling pathways during carcinogenesis. Stem Cell Rev 3: 30-38.
17. Miyoshi H, Ajima R, Luo CT, Yamaguchi TP, Stappenbeck TS (2012) Wnt5a potentiates TGF-β signaling to promote colonic crypt regeneration after tissue injury. Science 338: 108-113.
18. Bakker ER, Das AM, Helvensteijn W, Franken PF, Swagemakers S, et al.
(2013) Wnt5a promotes human colon cancer cell migration and invasion but
does not augment intestinal tumorigenesis in Apc1638N mice. Carcinogenesis 34: 2629-2638.
19. Lai C, Robinson J, Clark S, Stamp G, Poulsom R, et al. (2011) Elevation of WNT5A expression in polyp formation in Lkb1+/- mice and Peutz-Jeghers syndrome. J Pathol 223: 584-592.
20. Sipos F, Galamb O (2012) Epithelial-to-mesenchymal and mesenchymal-to- epithelial transitions in the colon. World J Gastroenterol 18: 601-608.
21. Hughes KR, Sablitzky F, Mahida YR. Expression profiling of Wnt family of genes in normal and inflammatory bowel disease primary human intestinal myofibroblasts and normal human colonic crypt epithelial cells. Inflamm Bowel Dis. 2011;17:213-20.
22. Kim YJ, Hong KS, Chung JW, Kim JH, Hahm KB (2010) Prevention of colitis- associated carcinogenesis with infliximab. Cancer Prev Res (Phila) 3: 1314- 1333.
23. Arijs I, De Hertogh G, Lemaire K, Quintens R, Van Lommel L, et al. (2009) Mucosal gene expression of antimicrobial peptides in inflammatory bowel disease before and after first infliximab treatment. PLoS One 4: e7984.
24. Arijs I, Li K, Toedter G, Quintens R, Van Lommel L, et al. (2009) Mucosal gene signatures to predict response to infliximab in patients with ulcerative colitis.
Gut 58: 1612-1619.
25. Toedter G, Li K, Marano C, Ma K, Sague S, et al. (2011) Gene expression profiling and response signatures associated with differential responses to infliximab treatment in ulcerative colitis. Am J Gastroenterol 106: 1272-1280.
26. Mesko B, Poliska S, Váncsa A, Szekanecz Z, Palatka K, et al. (2013) Peripheral blood derived gene panels predict response to infliximab in rheumatoid arthritis and Crohn's disease. Genome Med 5: 59.
27. Caprioli F, Bose F, Rossi RL, Petti L, Vigano C, et al. (2013) Reduction of CD68+ macrophages and decreased IL-17 expression in intestinal mucosa of patients with inflammatory bowel disease strongly correlate with endoscopic response and mucosal healing following infliximab therapy. Inflamm Bowel Dis 19: 729-739.
28. Arijs I, Quintens R, Van Lommel L, Van Steen K, De Hertogh G, et al. (2010) Predictive value of epithelial gene expression profiles for response to infliximab in Crohn's disease. Inflamm Bowel Dis 16: 2090-2098.
29. Gazouli M, Anagnostopoulos AK, Papadopoulou A, Vaiopoulou A, Papamichael K, et al. (2013) Serum protein profile of Crohn's disease treated with infliximab.
J Crohns Colitis 7: e461-e470.
Citation: Győrffy A, Kormos M, Bartha L, Szabó A, Győrffy B, et al. (2014) Validation of Biomarkers in Gene Expression Datasets of Inflammatory Bowel Disease: IL13RA2, PTGS2 and WNT5A as Predictors of Responsiveness to Infliximab Therapy. J Proteomics Bioinform 7: 272-277. doi:10.4172/
jpb.1000329
Submit your next manuscript and get advantages of OMICS Group submissions
Unique features:
• User friendly/feasible website-translation of your paper to 50 world’s leading languages
• Audio Version of published paper
• Digital articles to share and explore Special features:
• 350 Open Access Journals
• 30,000 editorial team
• 21 days rapid review process
• Quality and quick editorial, review and publication processing
• Indexing at PubMed (partial), Scopus, EBSCO, Index Copernicus and Google Scholar etc
• Sharing Option: Social Networking Enabled
• Authors, Reviewers and Editors rewarded with online Scientific Credits
• Better discount for your subsequent articles
Submit your manuscript at: http://www.editorialmanager.com/jmbt