Cancer cells induce immune escape via glycocalyx changes controlled by the telomeric protein TRF 2
Julien Cherfils-Vicini
1, Charlene Iltis
1, Ludovic Cervera
1, Sabrina Pisano
1, Olivier Croce
1, Nori Sadouni
1, Balázs Gy} orffy
2,3, Romy Collet
1, Valérie M Renault
1,†, Martin Rey-Millet
1,
Carlo Leonetti
4, Pasquale Zizza
4, Fabrice Allain
5, Francois Ghiringhelli
6,7, Nicolas Soubeiran
1, Marina Shkreli
1, Eric Vivier
8,9, Annamaria Biroccio
4,*& Eric Gilson
1,10,**Abstract
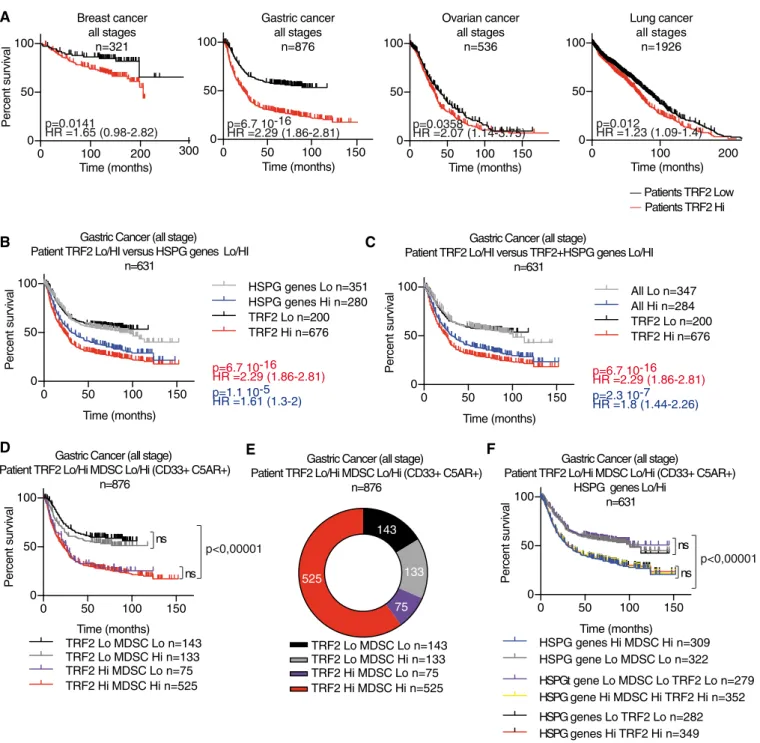
Myeloid-derived suppressor cells (MDSCs) are immature myeloid cells with strong immunosuppressive activity that promote tumor growth. In this study, we describe a mechanism by which cancer cells control MDSCs in human cancers by upregulating TRF2, a pro- tein required for telomere stability. Specifically, we showed that the TRF2 upregulation in cancer cells has extratelomeric roles in activating the expression of a network of genes involved in the biosynthesis of heparan sulfate proteoglycan, leading to profound changes in glycocalyx length and stiffness, as revealed by atomic force microscopy. This TRF2-dependent regulation facilitated the recruitment of MDSCs, their activation via the TLR2/MyD88/IL-6/ STAT3pathway leading to the inhibition of natural killer recruit- ment and cytotoxicity, and ultimately tumor progression and metastasis. The clinical relevance of these findings is supported by our analysis of cancer cohorts, which showed a correlation between high TRF2 expression and MDSC infiltration, which was inversely correlated with overall patient survival.
KeywordsHSPG; immunosurveillance; MDSC; NK cells; TRF2 Subject Categories Cancer; Cell Adhesion, Polarity & Cytoskeleton;
Immunology
DOI10.15252/embj.2018100012| Received8June2018| Revised10March 2019| Accepted15March2019| Published online18April2019
The EMBO Journal (2019)38: e100012
Introduction
Telomeres are key features of linear chromosomes that preserve genome stability and function. Variations in the telomere state are critical for cell senescence, stem cell biology, and cancer develop- ment (Blackburn et al, 2015). Human telomeres are composed of repeated TTAGGG DNA sequences and require the enzyme telom- erase for full replication (Gilson & Ge´li, 2007). To prevent unwanted activation of the DNA Damage Response (DDR), telomeric DNA is associated with shelterin, a protein complex composed of six different subunits (TRF1, TRF2, RAP1, TIN2, TPP1, and POT1 (Giraud-Paniset al, 2013). During oncogenesis, telomere shortening is associated with apparent antagonistic outcomes; it both favors cancer initiation through mechanisms involving genome instability (Artandiet al, 2000) and prevents cancer progression by activating the DNA Damage Response (DDR) checkpoint to behave as a cell- intrinsic proliferation barrier (Gonza´lez-Sua´rezet al, 2000). Conse- quently, telomerase reactivation is crucial for cancer progression and nearly 90% of human cancers exhibit upregulation of telomerase (Kimet al, 1994). Therefore, telomeres are considered potential anti- cancer targets; to date, most studies of telomeres have focused on cell-intrinsic proliferation barriers initiated by telomerase inhibition (Jafriet al, 2016) and more recently TRF1 inhibition (Bejaranoet al, 2017). A disadvantage of these therapeutic approaches is the pro- aging effects of telomere deprotection in normal tissues.
The expression of the key shelterin subunit TRF2 is regulated by several cancer-associated signaling molecules including p53 (Fujita et al, 2010), Wnt/b-catenin (Diala et al, 2013), and WT1 (Wagner
1 Université Côte d’Azur, Centre National de la Recherche Scientifique (CNRS) UMR7284, Institut National de la Santé et de la Recherche Médicale (INSERM) U1081, Institute for Research on Cancer and Aging, Nice (IRCAN), Nice, France
2 MTA TTK Lendület Cancer Biomarker Research Group, Institute of Enzymology, Hungarian Academy of Sciences, Budapest, Hungary 3 2nd Department of Pediatrics, Semmelweis University, Budapest, Hungary
4 IRCCS-Regina Elena National Cancer Institute, Rome, Italy
5 CNRS, UMR8576- UGSF - Unité de Glycobiologie Structurale et Fonctionnelle, University of Lille, Villeneuve d’Ascq, Lille, France 6 INSERM, U866, UFR des Sciences de Sante, Universite de Bourgogne-Franche Comte, Dijon, France
7 Centre Georges François Leclerc, Dijon, France
8 Aix Marseille Univ, APHM, CNRS, INSERM, CIML, Hôpital de la Timone, Marseille-Immunopole, Marseille, France 9 Innate Pharma Research Laboratories, Innate Pharma, Marseille, France
10 Department of Medical Genetics, Archet2Hospital, CHU of Nice, FHU Oncoage, Nice, France
*Corresponding author. Tel: +39 06 5266 2569; Fax: +39 06 5266 2013; E-mail: annamaria.biroccio@ifo.gov.it
**Corresponding author. Tel: +33 4 93 37 77 93; Fax: +33 493377676; E-mail: eric.gilson@unice.fr
†Deceased21March2017. We dedicate this contribution to Valérie M. Renault who sadly passed away during this work. We sorely miss her scientific insight as well as her profound humanity, kindness, and dutifulness.
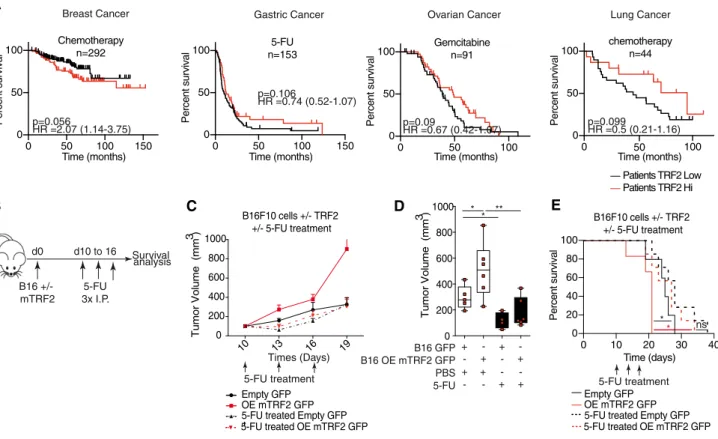
et al, 2014) and has been reported to be upregulated in a large panel of human cancers, in association with poor prognosis (Nakanishiet al, 2003; Diehlet al, 2011; Biroccioet al, 2013; Benhamouet al, 2016). In various mouse models, TRF2 inhibition has been shown to impair tumorigenesis independently of its functions in telomere protection and maintenance, but via cell extrinsic effects on immunosurveillance and angiogenesis, suggesting TRF2 to be a potential target in anti- cancer therapies without pro-aging telomere deprotective effects (Biroccioet al, 2013; El Maı¨et al, 2014; Zizzaet al, 2019). However, the mechanisms by which TRF2 exerts these multiple oncogenic func- tions, as well as their impact on overall survival (OS), tumor relapse, metastasis, or treatment response remain largely unknown.
An efficient antitumor immune response is of paramount impor- tance to restrain cancer progression and metastasis, as well as for successful chemotherapy or immunotherapy (Fridmanet al, 2017).
Because cancer cells possess a variety of sophisticated mechanisms to bypass their recognition and elimination by the immune system (Vesely et al, 2011), targeting these pathways represents an unprecedented opportunity for cancer treatment (Galluzzi et al, 2015; Restifoet al, 2016). Among the immunosuppressive proper- ties of tumors, the recruitment and activation of myeloid-derived suppressor cells (MDSCs) facilitate cancer progression (Vegliaet al, 2018). Although the role of systemic and cancer-associated inflam- mation in this process has been established (Ostrand-Rosenberg &
Fenselau, 2018), little is known about the specific pathways by which cancer cells control the immunosuppressive functions of MDSCs and how the cell-surface molecules of cancer cells can trig- ger MDSC activation; in particular, the impact of the extracellular matrix and glycocalyx in cancer tissues on MDSC remains elusive.
Previously, we revealed the role of TRF2 in the regulation of the HS3ST4gene, which encodes an enzyme involved in the sulfation of the heparin sulfate moiety of proteoglycans, preventing the recruit- ment of natural killer (NK) cells (Biroccioet al, 2013). However, we were unable to decipher the mechanism by whichHS3ST4expres- sion and possibly heparin sulfate proteoglycan (HSPG) biosynthesis keep NK cell activation in check. In this study, we analyzed the tumor immune microenvironment of TRF2 overexpressing tumors in innate immunity competent nude mice xenografted with human transformed fibroblasts (Hahnet al, 1999; Hahn & Weinberg, 2002) and in fully immunocompetent mice grafted with mouse melanoma cells (B16F10) (Cheli et al, 2012). We found that cancer cells recruited and directly activated MDSCs in a TRF2-dependent man- ner, dampening NK and CD8+ T cell cytotoxicity. Moreover, we showed that this MDSC function of TRF2 was associated with its ability to control the glycocalyx structure by acting as a master regu- lator of the transcription of three genes involved in HSPG biosynthe- sis. Overall, our results reveal an immunosuppressive mechanism linking the telomeric factor TRF2 to the glycocalyx and MDSCs, which suggests that targeting TRF2 can counteract the immune escape of cancer cells without inducing telomere deprotection.
Results
TRF2triggers an immunosuppressive tumor microenvironment
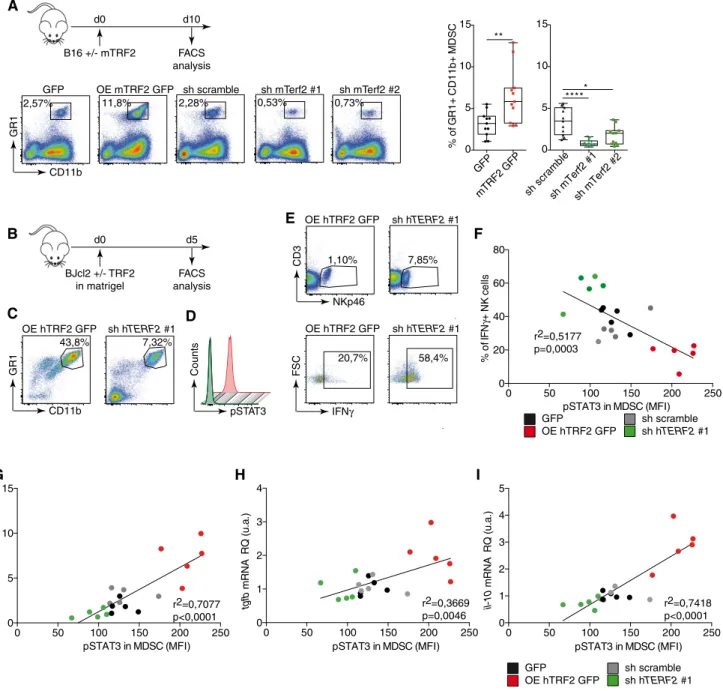
Using the B16F10 melanoma mouse model, we analyzed the effects of TRF2 on intratumoral immune cell infiltration (Fig 1A). Ten days
after tumor injection, TRF2 overexpression (conversely, TERF2 knockdown) did not affect global immune cell infiltration (CD45+) or global CD4+, CD3+, or CD8+T cell infiltration (Fig EV1A). How- ever, intratumoral MDSC infiltration (CD11bHi GR1Hi expressing cells) was strongly dependent on the level of TRF2; its upregulation increased MDSC infiltration by approximately 2.5-fold, whereas its downregulation decreased infiltration (Fig 1A). Notably, the intratu- moral ratio between the two MDSC subpopulations (polymorpho- nuclear MDSCs [PMN-MDSCs] and monocytic MDSCs [M-MDSCs]) was consistent with the findings of a previous report (Fig EV2E and F; Kumaret al, 2016b). Upon TRF2 upregulation, this ratio shifted toward more PMN-MDSCs (Fig EV2E and F). In addition to MDSC infiltration, TRF2 upregulation (or downregulation) increased (or decreased), respectively, CD25+Foxp3+regulatory T cell (Treg) infil- tration and decreased (or increased), respectively, activated CD25+ Foxp3–T cell infiltration (Fig EV1B and C) and NK cell recruitment (Fig EV1D). Similarly, xenografted tumors derived from immortalized RasV12 human skin fibroblasts (named BJcl2; Biroccioet al, 2013) injected into nude mice, which are immunodeficient for T cells compartment but still have an active innate immunity including NK cells, exhibited increased or decreased infiltration of MDSCs upon TRF2 overexpression or knockdown, respectively (Fig EV1E).
We used a Matrigel plug assay to analyze the early immune responses triggered by cancer cells with various TRF2 expression levels (Fig 1B). As observed in tumors, overexpression (knock- down) of TRF2 increased (or decreased) MDSC recruitment, respec- tively (Figs 1C and EV1F). In addition, using phosphorylated STAT3 (pSTAT3) as a marker for MDSC activation and known regulator of the immunosuppressive functions of MDSC (Marvel & Gabrilovich, 2015), we observed that the TRF2 level was correlated with MDSC activation (Figs 1D and F, and EV1F). The proportion of IFN-c+NK cells was negatively correlated (R2=0.5117, P=0.0003) with the pSTAT3 level in MDSCs and with TRF2 expression in cancer cells (Fig 1F), indicating that TRF2-dependent MDSC recruitmentin vivo is associated with inhibition of NK cell cytotoxicity. In the same Matrigel plug assay, we observed that the expression of three immunosuppressive molecules, arginase 1 (Arg-1), IL-10, and TGF-b (Ostrand-Rosenberg & Fenselau, 2018), which are expressed by MDSCs to trigger NK and T cell suppression (Gabrilovich & Nagaraj, 2009; Nagaraj & Gabrilovich, 2012; Sceneayet al, 2012), is upregu- lated when TRF2 is overexpressed (Fig EV1G) and is correlated with the level of pSTAT3 in infiltrating MDSCs (Fig 1G–I; r2=0.7077, P <0.0001 forarg-1;r2=0.3669,P=0.0046 fortgf-b;r2=0.7418, P <0.0001 for il-10). Overall, these results show, using a tumor growth experiment or Matrigel plug assay with B16F10 mouse mela- noma cells implanted into immunocompetent mice and human BJcl2 cells xenografted in Nude mice that a high level of TRF2 in cancer cells induces a strong immunosuppressive tumor microenvi- ronment by promoting MDSC and Treg cell infiltration and inhibit- ing NK cell recruitment and degranulation.
TRF2promotes tumorigenesis and metastasis in an MDSC- dependent manner
Next, we determined whether the pro-tumorigenic and immunosup- pressive effects of TRF2 overexpression are dependent on MDSCs.
MDSCs were selectively depleted in mice by repeated injection of anti-GR-1 antibodies (Kumar et al, 2016a; Svoronos et al, 2017).
Indeed, such a treatment abolished the intratumoral infiltration of MDSCs, in particular PMN-MDSCs (Figs 2G, K and M, and EV2E and F). The pro-tumorigenic and metastatic effects of TRF2
overexpression were obliterated in these MDSC-depleted mice (Figs 2A–F and EV2A and B). The ability of TRF2-overexpressing cancer cells to metastasize was strongly reduced when MDSCs were B16 +/- mTRF2
d0 d10
FACS analysis
A
2,57% 11,8% 2,28% 0,53% 0,73%
CD11b
GR1
GFP mTRF2 GFP 0 5 10 15
% of GR1+ CD11b+ MDSC
sh scramblesh mTerf2 #1sh mTerf2 # 0 2
5 10 15
GFP OE mTRF2 GFP sh scramble sh mTerf2 #1 sh mTerf2 #2
**
*****
B
0 50 100 150 200 250
0 20 40 60 80
pSTAT3 in MDSC (MFI)
% of IFNγ+ NK cells
r2=0,5177 p=0,0003
GFP
OE hTRF2 GFP
sh scramble sh hTERF2 #1 BJcl2 +/- TRF2
in matrigel
d0 d5
FACS analysis
43,8% 7,32%
CD11b
GR1
NKp46
CD3
IFNγ
FSC
OE hTRF2 GFP sh hTERF2 #1
OE hTRF2 GFP sh hTERF2 #1 OE hTRF2 GFP sh hTERF2 #1
1,10% 7,85%
20,7% 58,4%
C D
E
F
0 50 100 150 200 250
0 1 2 3 4
tgfb mRNA RQ (u.a.)
0 50 100 150 200 250
0 1 2 3 4 5
il-10 mRNA RQ (u.a.)
0 50 100 150 200 250
0 5 10 15
arg1 mRNA RQ (u.a.)
pSTAT3 in MDSC (MFI) pSTAT3 in MDSC (MFI) pSTAT3 in MDSC (MFI)
GFP
OE hTRF2 GFP
sh scramble sh hTERF2 #1 r2=0,7077
p<0,0001
r2=0,3669 p=0,0046
r2=0,7418 p<0,0001
G H I
pSTAT3
Counts
Figure1. TRF2overexpression triggers an immunosuppressive tumor microenvironment.
A B16F10melanoma cells with either mTRF2overexpression or knockdown were inoculated into the backs of immunocompetent mice. The percentages of intratumoral CD11bHi GR1Hi MDSCs (n=10mice), CD25+Foxp3+regulatory T cells (Tregs), or CD25+Foxp3-activated T cells (n=5mice per group) among CD45+ cells were analyzed by fluorescence-activated cell sorting (FACS) and represented as box plots
B–E Schematic representation of the experiment (B). TRF2-overexpressing or TRF2-knockdown BJcl2cells were inoculated into the backs of immunodeficient mice in the presence of Matrigel. Five days later, the percentage of immune cells infiltrating the Matrigel plugs of CD11bHi GR1Hi MDSCs (C), the intranuclear staining of pSTAT3(D), and CD3NKp46+and IFN-c+among CD3NKp46+NK cells (E) were determined by FACS (n=5mice per group).
F–I Linear correlation plot of the percentage of IFN-c+NK cells, the mean of fluorescence intensity (MFI) of pSTAT3for MDSCs, and the expression of TRF2(r2=0.5177;
Pearson’s correlation,P=0.003) (F); the mRNA expression level in the Matrigel plugs of arg1, pSTAT3MFI, and TRF2expression (r2=0.7077; Pearson’s correlation, P<0.0001) (G); the mRNA expression level in the Matrigel plugs of tgfb, pSTAT3MFI, and TRF2expression (r2=0.3669; Pearson’s correlation,P=0.0046) (H) and the mRNA expression level in the Matrigel plugs of il-10, pSTAT3MFI, and TRF2expression (r2=0.7418; Pearson’s correlation,P<0.0001) (I).
Data information: Data are presented by box plots min to max showing all points with median. *P<0.05, **P<0.01, ***P<0.001and ****P<0.0001; Mann–Whitney test. In (F–I), Pearson correlation andP-values are indicated.
depleted, either when we searched for natural diffusion of cancer cells into the lungs (GFP+cells infiltrating lungs) from a primitive subcutaneous tumor (Figs 2C and EV2B) or when we used the clas- sical metastasis model by intravenous injection into the tail vein (Fig 2D–F). In both cases, MDSC depletion was sufficient to inhibit the increased number of GFP+cells infiltrating the lungs, the num- ber of nodules, or the metastasis burden induced by TRF2 overex- pression. Although MDSC depletion did not alter the infiltration of CD45, CD3, CD4, or CD8 cells (Fig EV2C), it reversed the immuno- suppressive tumor microenvironment created by TRF2 upregulation (i.e., Treg cell infiltration) (Fig 2G), NK cell inhibition (Fig 2H), and CD8+T cell inhibition (Fig 2I). This rescue by MDSC depletion of the TRF2-dependent immunosuppressive environment was con- firmed by a Matrigel plug assay (Figs 2J–M and EV2F–K). Overall, these results show that TRF2-mediated regulation of MDSCs plays a central role in the TRF2-dependent increases in tumorigenicity and metastasis, shaping the tumor immune microenvironment.
Cancer cells directly activate MDSCs in a TRF2-dependent manner via the TLR2/MyD88/IL-6/STAT3pathway
The above-mentioned results suggest that the immunosuppressive environment controlled by the level of TRF2 in cancer cells results from MDSC recruitment and/or activation. Therefore, we explored whether MDSCs are directly regulated by cancer cells as a function of the TRF2 level. We co-cultured BJcl2 or B16F10 cells in the pres- ence or absence of TRF2 overexpression, in a mouse MDSC line (MSC2 cells; Bruchardet al, 2012) and analyzed the pSTAT3 level in MSC2 cells (Figs 3A and B, and EV3A–C). In TRF2-overexpres- sing cancer cells, the pSTAT3 level was significantly increased in MSC2 cells, whereas it was decreased afterTERF2 knockdown in cancer cells (Figs 3B and EV3C). Interestingly, when the pSTAT3 level was assayed after co-culture with conditioned medium (Fig EV3D), we detected no differences (Fig EV3E), suggesting that cell contact is required. Next, we investigated whether MDSCs are activated by TRF2-overexpressing cancer cells via the Toll-like receptor (TLR)/MyD88 pathway (Fig 3C–E). After determining the optimal concentration of each inhibitor (Fig EV3G and H), we co- cultured BJcl2 cancer cells in the presence or absence of TRF2 over- expression and MSC2 cells in the presence or absence of a TLR4 antagonist (lipopolysaccharide [LPS-RS]), an anti-mouse TLR2- blocking antibody, or a MyD88-inhibitory peptide. The blocking of
TLR4 by LPS-RS did not affect the level of pSTAT3 in MSC2 cells;
however, treatment with the anti-TLR2 antibody or anti-MyD88 pep- tide was sufficient to inhibit the increase of pSTAT3 in MSC2 cells co-cultured with TRF2-overexpressing cancer cells (Figs 3D and EV3F). Since the TLR2/MyD88 pathway does not directly trigger STAT3 phosphorylation, we explored whether activation of the TLR2/MyD88 pathway induces a secondary signal that leads to STAT3 phosphorylation, specifically focusing on IL-6 (Skabytska et al, 2014). We assessed whether a mouse-specific anti-IL-6 block- ing antibody or JAK1/2 inhibitor (Ruxolitinib) can block the increase of STAT3 phosphorylation induced by TRF2 overexpression (Figs 3E and EV3G and H). Adding rat IgG2a isotypic control to the co-culture did not affect the increased pSTAT3 level; however, inhi- bition of mouse IL-6 or JAK1/2 completely inhibited this increase.
Taken together, these data show that overexpression of TRF2 trig- gers the TLR2/MyD88 pathway in MDSCs, which in turn favors STAT3 phosphorylation in an IL-6/JAK1/2-dependent manner.
The TRF2-mediated activation of MDSCs inhibits NK cell function
We assessed whether the dosage of TRF2 in cancer cells affects the immunosuppressive capacity of MDSCs on NK cell activation using anin vitrosuppression assay (Figs 3F–H and EV3J–M). The overex- pression or knockdown of TRF2 in BJcl2 cells (Fig 3F–H) or B16F10 cells (Fig EV3J–M) was conducted in co-culture with MSC2 cells for 18 h; MSC2 cells were then sorted by fluorescence-activated cell sorting (FACS) (Figs 3F and EV3J and K). Simultaneously, NK cells poly I:C-primedin vivofor 18 h were sorted by FACS (Figs 3F and EV3J and K). Sorted MSC2 and NK cells were then co-cultured for 18 h at a 1:1 ratio and finally challenged by adding the target cells (YAK-1 or 3T3 cells) for 4 h (Figs 3F and EV3K). NK cell degranula- tion capacity and IFN-cproduction were determined by flow cytom- etry (Figs 3G and EV3L and M), and the cytotoxicity of NK cells toward the target was assessed using a viability assay (Fig 3H).
After co-culturing MSC2 and cancer cells, we noticed that TRF2 overexpression in cancer cells increased the number of MSC2 cells (Fig EV3I), suggesting that TRF2 enhances MDSC proliferation.
Interestingly, this proliferative effect was not altered when IL-6 was blocked, but was strongly reduced when JAK1/2 was inhibited, sug- gesting that TRF2 enhances MDSC proliferation in a JAK/STAT- dependent manner. We also observed that direct co-culture of TRF2- overexpressing cancer cells and MSC2 cells, either with BJcl2
▸
Figure2. TRF2promotes tumorigenesis and metastasis in an MDSC-dependent manner.
A–C B16F10melanoma cells with or without mTRF2overexpression were inoculated into the backs of immunocompetent mice and treated with anti-GR1antibody or isotypic control (200lg/IP). The tumor volume was determined every2days using hemi-ellipsoid formula (B). On day19of the tumor growth experiment, the percentages of GFP+cells infiltrating the lungs were determined by FACS and presented as the number of GFP+cells/mg lung tissue (C).
D–F B16F10melanoma cells with or without mTRF2overexpression were inoculated into tail vein of immunocompetent mice and treated with anti-GR1antibody or isotypic control (200lg/IP) every3days. On day21, lung metastasis was analyzed by counting macroscopic metastatic nodules and hematoxylin and eosin (H&E) staining (E and F), scale bars =500lm.
G–I Tumor-infiltrating immune cells from tumors of the experiment shown in (A) were analyzed by FACS: MDSCs and CD25+Foxp3+Tregs (G), NK cells (H), and CD8+T cells (I).
J–M BJcl2cells with or without hTRF2overexpression were inoculated into the backs of immunodeficient nude mice and treated with anti-GR1antibody or isotypic control (200lg/IP) as indicated in (J) and NK cells recruitment, degranulation, and MDSC infiltration were monitored by FACS (K-M). Density plot of CD11bHiGR1Hi MDSC staining in control or anti-GR1-treated Matrigel plugs (K). Box plots of the percentages of infiltrating or activated NK cells (CD107a or CD69) (L), of CD11bHi GR1HiMDSC or NKp46+NK cells (M) infiltrating the Matrigel plugs assay among the CD45+cells.
Data information: Data are presented by box plots min to max showing all points with median corresponding to the percentages of each cell population among CD45+ cells or the indicated parent population or the number of lung nodules. Tumor volume is presented in mm3along the time in days. All experiments are performed with n=8mice per group; *P<0.05, **P<0.01, and ***P<0.001; Mann–Whitney test.
SC inj. B16 GFP or B16 OE TRF2 GFP
d0 d12 d14 d16 d18 d20
FACS analysis I.P. 200µg/mice Isotype or anti GR-1 antibody
0 5 10 15 20
0 500 1000 1500 2000
Time (days) Tumor volume (mm3 ) B16 GFP + Isotype
B16 OE mTRF2 + Isotype B16 GFP + anti GR1 B16 OE mTRF2 + anti GR1
isotypic control or anti GR-1
*
*
*
*
0 5 104 1 105
Metastatic GFP+ cells/mg tissue
* *
* *
n s
A B C
D
CD4+ Foxp3+T reg cells
0 20 40 60
0 20 40 60 80
% of CD11b+ GR1+ MDSC
-
+ -
+ -
- + + -
- +
+ -
% of NKp46+ cells % of CD107+ NK cells % of CD69+ NK cells
* * *
* *
* *
*
*
* * n s
* * * n s
n s n s
*
* *
* *
0 2 4 6 * * *
* * *
0 20 40 60 80
n s n s
0 1 2 3 4
* * * *
* * * * n s
n s
n s
* *
* * *
n s n s n s
* * * * * *
* * * * * * 80 *
*
* *
20 40 60 80 100
% CD8+ CD107+ T cells
0 50 100 150
% CD8+ CD69+ T cells
*
*
* *
* n s +
+ -
H
-
+ -
+ - -
+ + -
- +
+ + -
+
- +- -
+ - -
+ + -
- +
+ + -
+
- +- -
+ - -
+ + -
-+ + -+
+ -
-
+ -
+ -
- + +
- - +
+ + -
+ -
-
+ -
+ -
- + + -
- +
+ + -
+
- -
+ -
+ -
- + + -
-+ + -+
+ -
NK cells I T cells
B16 GFP B16 OE mTRF2 GFP Isotypic control anti GR-1
E
BJcl2 +/- hTRF2 in matrigel
d0
d-4 d-2 d2 d4 d5
FACS analysis I.P. 200µg/mice
Isotype or anti GR-1 antibody
J
BJcl2 GFP BJcl2 OE hTRF2 GFP Isotypic control anti GR-1
BJcl2 GFP BJcl2 OE hTRF2 GFP
GR1
Isotypic control anti-GR1
BJcl2 GFP BJcl2 OE hTRF2 GFP
MDSC14,7% MDSC
22,0% MDSC
5,95% MDSC
4,14%
K
L
% of MDSC among CD45+ cells
* *
0 10 20 30 40
* * *
* * * * *
* * n s
-
+ -
+ -
- + + -
- +
+ + -
+ -
0 2 4 6 8
% of NKp46+ cells * * *
*
* *
* *
* * n s
-
+ -
+ -
- + + -
- +
+ + -
+ - 0
10 20 30 40
% of CD107+ NK cells
0 20 40 60 80
% of CD69+ NK cells
* *
* * * n s
* * * n s * * * n s
*
* * *
* *
* *
-
+ -
+ -
- + + -
- +
+ + -
+
- -
+ -
+ -
- + + -
- +
+ + -
+ -
M
CD11b
-
+ -
+ -
- + + -
-+ + -+
+ - B16 GFP B16 OE mTRF2 GFP Isotypic control anti GR-1
*
*
* ns
IV inj. B16 GFP or B16 OE TRF2 GFP
d0 d6 d9 d12 d18d21
Lung analysis I.P. 200µg/mice
Isotype or anti GR-1 antibody
d3 d15
* * * ¨* *
n s
-
+ -
+ -
- + + -
- +
+ + -
+ - B16 GFP B16 OE mTRF2 GFP Isotypic control anti GR-1 0 5 10 15 20 25
Nbr of Nodules
B16 GFP B16 OE mTRF2 GFP Isotypic control anti GR-1
G F
GFP mTRF2 GFP
Isotypic control anti GR-1
GFP mTRF2 GFP
B16
0
Figure2.
(Fig 3G) or with B16F10 cells (Fig EV3L and M), significantly decreased NK cell degranulation and IFN-c production. Inversely, TRF2 knockdown in cancer cells led to significant increases in NK cell degranulation capacity and IFN-cproduction (Fig EV3L and M).
Overexpression of TRF2 not only inhibited NK cell functionality but also strongly affected NK cell cytotoxicity (Fig 3H). Since we observed that STAT3 phosphorylation was dependent on the IL-6/
JAK1/2 pathway, we explored whether inhibition of JAK1/2 or IL-6 was sufficient to reverse the inhibitory effect on NK cell functional- ity. Interestingly, we observed that blocking IL-6 or JAK1/2 restored NK cell degranulation (Fig 3G) and killing capacity (Fig 3H), which were inhibited by TRF2 overexpression. Taken together, our data show that direct contact between TRF2-overexpressing cancer cells and MDSCs is sufficient to trigger TLR2 signaling, which enhances the immunosuppressive capacity of MDSCs on NK cells via an IL-6/
JAK1/2-dependent mechanism.
TRF2regulates the expression of ITS-associated genes involved in glycocalyx synthesis
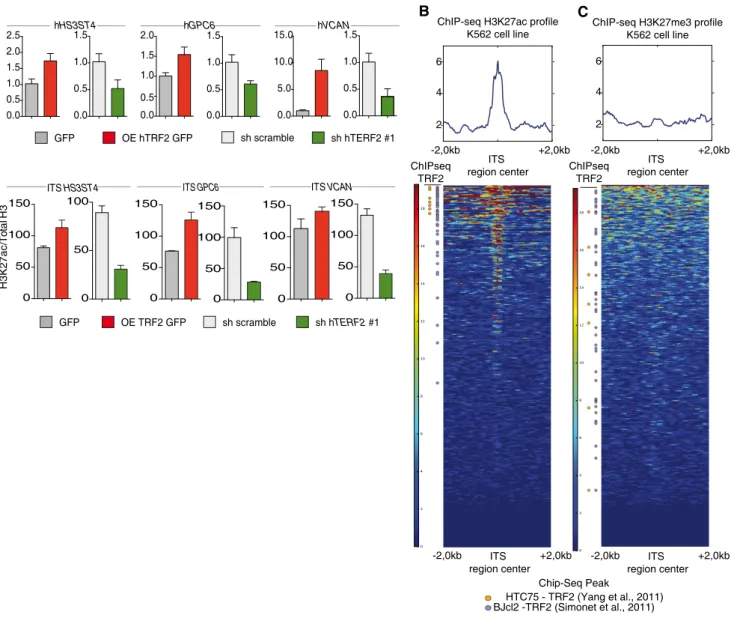
Next, we assessed the mechanism by which TRF2 controls the ability of cancer cells to recruit and activate MDSCs. Because TRF2 binds an extratelomeric range of TTAGGG repeats (ITSs) (Simonetet al, 2011;
Yanget al, 2011) to regulate the expression ofHS3ST4(Biroccioet al, 2013), a gene involved in HSPG biosynthesis, and as HSPGs shape the tumor microenvironment and promote tumor growth (Knelson et al, 2014; Hammondet al, 2014), we systematically searched the genome for ITS-associated genes (Dataset EV1) involved in HSPG biosynthesis using the Reactome online tool (http://reactome.org/Pa thwayBrowser/) (Dataset EV2). This search revealed two ITS-asso- ciated genes in addition toHS3ST4:VCAN, whose product activates the TLR2 pathway (Kimet al, 2009), andGPC6, which encodes glypi- can 6 (Dataset EV2). The expression ofGPC6andVCANwas depen- dent on TRF2 expression, at both the RNA and protein levels (Figs 4A and EV4A–C). These results indicate that TRF2 behaves as a tran- scriptional regulator of three HSPG-related genes. Therefore, we examined whether the binding of TRF2 to ITSs induces chromatin changes involved in transcriptional regulation. Using Encode data (Fig 4B and C), we evaluated the specific enrichment of the activating mark H3K27ac in a large set of TRF2-bound ITSs (Figs 4B and C, and EV4H and Dataset EV4). This specific enrichment of ITS chromatin in H3K27ac is conserved through evolution (Fig EV4D–H and Dataset EV3), suggesting that it plays an important role. Interestingly, almost all the genes for which we previously revealed an ITS by TRF2 ChIP- seq (Simonetet al, 2011) are also identified in the H3K27ac ChIP-seq
from ENCODE (Figs 4B and EV4H). We then tested whether the bind- ing of TRF2 to ITSs triggers H3K27 acetylation and found that enrich- ment of H3K27ac in ITSs associated withHS3ST4,VCAN, andGPC6 was decreased (increased) upon TRF2 downregulation (overexpres- sion) (Figs 4D and EV4I). These results suggest that binding of TRF2 to ITSs converts these sequences into positive regulatory elements that enhance the transcription ofHSPGgenes.
HS3ST4, GPC6, and VCAN are effectors of the MDSC-dependent oncogenic properties of TRF2
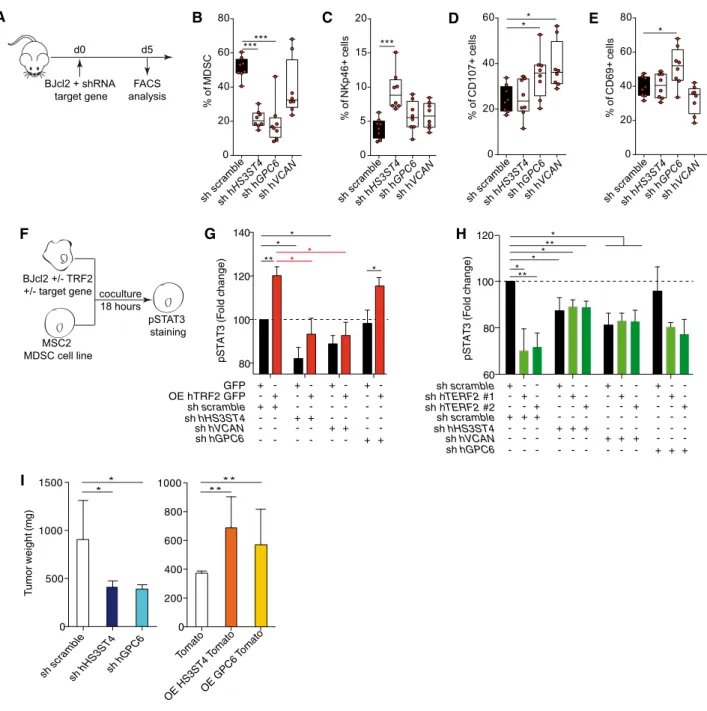
Next, we evaluated the roles ofHS3ST4,GPC6, andVCANin TRF2- mediated immunosuppression (Fig 5A–H and Appendix S1A–C).
We analyzed the impact of TRF2 target genes on immune infiltra- tion (Matrigel plug assay) and observed thatVCANdownregulation decreased total immune cell infiltration, whereas downregulation of HS3ST4 or GPC6 did not alter total immune cell infiltration (Appendix S1B and C). However, all three genes affected MDSC or NK cell recruitment/activation (Fig 5C and Appendix Fig S1B).
Indeed, downregulation ofHS3ST4andGPC6significantly decreased MDSC recruitment (Fig 5B), whereas onlyHS3ST4downregulation increased NK cell recruitment (Fig 5C). In contrast, NK cell degran- ulation (C107a+ NK cells) was positively affected by downregula- tion of GPC6 and VCAN but not HS3ST4 (Fig 5D), whereas only GPC6 affected CD69+ NK cell infiltration (Fig 5E). Thus, MDSC recruitment was mediated byHS3ST4andGPC6, and as expected, NK cell recruitment byHS3ST4(Biroccioet al, 2013)), whereas NK cell degranulation and activation were dependent on GPC6 and VCAN. The roles of these genes in MDSC activation were confirmed using co-culture assays, in whichHS3ST4, GPC6, orVCANexpres- sion was knocked down in TRF2-overexpressing or TRF2-downre- gulated cancer cells (Fig 5F–H). VCAN knockdown did not affect STAT3 phosphorylation, whereas HS3ST4 or GPC6 knockdown decreased it. In cancer cells overexpressing TRF2,HS3ST4orGPC6 knockdown significantly reduced the level of pSTAT3 (Fig 5G). In addition, double knockdown of TRF2with eitherHS3ST4or GPC6 (Fig 5H) decreased the pSTAT3 level in a similar manner to that by HS3ST4knockdown alone,GPC6knockdown alone, orTRF2knock- down alone, suggesting epistatic regulation among TRF2, HS3ST4, and GPC6. Thus, the TRF2-dependent regulation of HS3ST4 and GPC6 is essential for STAT3 phosphorylation in MDSCs. Finally, since we showed that the oncogenic properties of TRF2 were depen- dent on MDSC recruitment and immunosuppressive functions (Figs 1–3) and that STAT3 phosphorylation is dependent on HS3ST4 and GPC6, we evaluated the oncogenic properties of
▸
Figure3. Cancer cells directly activate MDSCs in a TRF2-dependent manner via the TLR2/MyD88/IL-6/STAT3pathway that inhibit NK cell degranulation and cytotoxicity.
A, B Analysis of STAT3phosphorylation by MSC2cells after18h co-culture with BJcl2overexpressing or compromised for TRF2(A). Histograms of the pSTAT3mean fluorescence intensity (MFI) (B).
C–E Same experiment as in (A, B)inhibitors: anti-MyD88peptide inhibitor, anti-mouse TLR2antibody, or lipopolysaccharide (LPS)-RS, an antagonist of TLR4in (D) and anti-mouse IL-6or JAK1/2inhibitor (Ruxolitinib) in (E).
F–H Schematic representation of the MDSC suppression assay (F). TRF2-overexpressing or TRF2-knockdown BJcl2cells were co-cultured with MSC2cells for 18hmouse IL-6blocking antibody or ruxolitinib. After FACS sorting, MSC2cells were co-cultured for18h with primed and purified NK cells before a4h challenge with YAK-1. NK cell degranulation and IFN-cproduction were analyzed by FACS (G). Alternatively, a4h challenge with NIH3T3cells was performed and the ability of NK cells to kill NIH3T3cells were determined by colorimetric analysis (AlamarBlue) (H).
Data information: Panels (G and H) show all points with meanSEM corresponding to the percentages of each cell population among NK cells (G) or the percentage of specific target lysis (H) (n=3independent experiments; *P<0.05, **P<0.01, and ***P<0.001; Student’st-test).
100 150 200 250 300
MSC2 BJcl2 GFP
+ +
-
mfi pSTAT3 (u.a.)
+ + + +
-
+ - - -
BJcl2 OE hTRF2 GFP - - + anti TLR2 ab
anti-MyD88 peptide LPS RS
- - - + - -
- - - - + -
- - - - - +
+ + +
D
pSTAT3
Counts
GFP
OE hTRF2 GFP
sh scramble BJcl2 +/- TRF2
MSC2 MDSC cell line
coculture 18 hours
pSTAT3 staining
A B
BJcl2 +/- TRF2
MSC2 MDSC cell line
coculture 18 hours +/- TLR inhibitors
+/- anti mIL6 ab +/- Ruxolitinib
pSTAT3 staining
C
100 150 200 250 300
mfi pSTAT3 (u.a.)
E
MSC2 BJcl2 GFP
+ + + + + +
+ - BJcl2 OE hTRF2 GFP -
anti mIL-6 abrat IgG2a ab Ruxolitinib
- - + - -
- - - - +
-
- - - - -
+
+ + +
+ - - +
+ - - +
+ - - + - - - - +
+ +
0 20 40 60
% of IFNγ+ cells
0 10 20 30 40
% of CD107a+ cells
0 10 20 30 40 50
% of specific lysis
NK cell degranulation assay (YAK-1 target) cell specific lysis (3T3 target)
* n s* *
* * *
* n s *
* * * n s* * *
n s * * *
* *
* * * *
* * *
* n s
* *
* *
* *
* n s n s
* n s
n s BJcl2 GFP or
BJcl2 OE hTRF2 GFP
F
Primed NK cells FACS sorting pI:C in vivo priming
18 hours
MSC2 MDSC cell line
coculture 18 hours +/- a mIL-6
+/- Ruxo.
MSC2 FACS sorting
coculture 18 hours
addition of YAK 1 target E:T 10/1
coculture
4 hours NK cells degranulation assay
(CD107a and IFNγ)
addition of 3T3 target E:T 10/1
3T3 cell specific killing assay (AlamarBlue) coculture
4 hours
G H
sh hTERF2 #1 sh hTERF2 #2
BJcl2 GFPMSC2 BJcl2 OE hTRF2 GFP Rat IgG2a a mIL-6 Ruxolitinib
- - - + + +
+- +- +-
+ + + + + +
+ - - + - -
- -
+ +
- -
- - + - - +
- - - + + +
+- +- +-
+ + + + + +
+ - - + - -
- -
+ +
- -
- - + - - +
- - - + + +
+ + +- - - + + + + + + + - - + - -
- -
+ +
- -
- - + - - + BJcl2 GFPMSC2
BJcl2 OE hTRF2 GFP Rat IgG2a a mIL-6
Ruxolitinib NK + 3T3
Figure3.
HS3ST4andGPC6in tumor growth experiments. Their overexpres- sion or downregulation affected neither cell proliferation nor clono- genicityin vitro(Appendix Fig S1D and E). However, in xenograft experiments using BJcl2 cells, downregulation ofGPC6orHS3ST4 decreased tumor weight (Fig 5I), delayed tumor occurrence (Appendix Fig S1F), and reduced tumor growth (Appendix Fig S1G). Conversely, overexpression of GPC6 or HS3ST4 increased cancer tumorigenicity, accelerated tumor occurrence, and increased tumor growth. In summary, TRF2 regulates the expression of three HSPG genes that mediate MDSC recruitment and activation and pro- mote tumorigenicity.
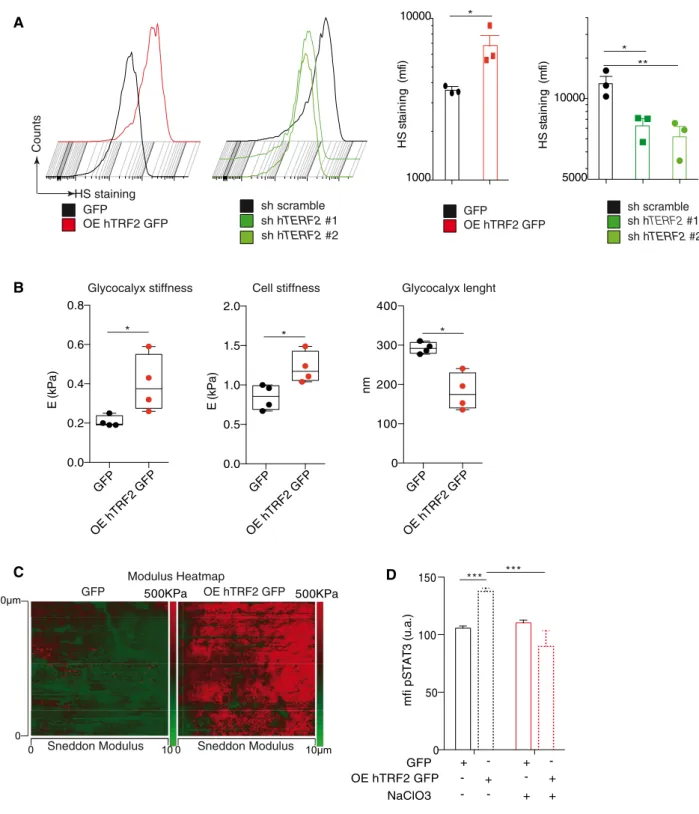
TRF2changes glycocalyx structure, which triggers MDSC activation
Because the above-mentioned results suggest that TRF2 regulates the expression of a network of HSPGgenes, we directly evaluated whether TRF2 acts as a general remodeler of glycocalyx structure.
First, we analyzed the total heparan sulfate (HS) level by FACS using the 10E4 antibody (van den Bornet al, 2005). TRF2 overex- pression increased the level of HS staining (Fig 6A), whereas TRF2 knockdown decreased it, indicating that TRF2 enhances HS synthe- sis. Because HS is an essential component of the glycocalyx, we GFP OE hTRF2 GFP sh scramble sh hTERF2 #1
hHS3ST4
0.0 0.5 1.0 1.5
0.0 0.5 1.0 1.5 2.0
2.5 hGPC6
0.0 0.5 1.0 1.5
0.0 0.5 1.0 1.5 2.0
0.0 5.0 10.0
15.0 hVCAN
0.0 0.5 1.0 1.5
Relative quantity (a.u.)
A B
ChIP-seq H3K27me3 profile K562 cell line
2 4 6
+2,0kb -2,0kb
ITS region center
+2,0kb -2,0kb ITS
region center ChIPseq
TRF2 ChIP-seq H3K27ac profile
K562 cell line
2 4 6
+2,0kb -2,0kb
ITS region center ChIPseq
TRF2
+2,0kb -2,0kb ITS
region center
HTC75 - TRF2 (Yang et al., 2011) BJcl2 -TRF2 (Simonet et al., 2011)
Chip-Seq Peak
C
D
GFP OE TRF2 GFP sh scramble sh hTERF2 #1 Fold Enrichment H3K27ac/Total H3
ITS HS3ST4
0 50 100 150
0 50 100
ITS GPC6
0 50 100 150
0 50 100 150
ITS VCAN
0 50 100 150
0 50 100 150
Figure4. TRF2regulates the expression of ITS-associated genes involved in glycocalyx synthesis.
A Gene expression analysis by quantitative polymerase chain reaction (qPCR) of TRF2target genes following TRF2overexpression or knockdown.
B, C Heatmap of H3K27ac (B) or H3K23me3(C) peaks on the4kilobase (Kb) region around genomic ITSs (ENCODE data for the K562cell line). The mean intensity of the region is depicted in the histograms. ITSs are clustered depending of the peak mean intensity obtained from H3K27ac or H3K27me3chromatin
immunoprecipitation sequencing (ChIP-seq) of the4Kb region. ITSs detected by ChIP-seq using an anti-TRF2antibody are shown on the left.
D Specific qPCR forHS3SH4,GPC6, andVCANITSs after ChIP using an anti-H3K27ac antibody in TRF2-overexpressing or TRF2-knockdown BJcl2cells. Data represent fold enrichment of the H3K27ac level compared with the total H3level.
Data information: Data representn=3independent experiments with meanSEM.
investigated whether TRF2 modifies the glycocalyx and/or cell stiff- ness by atomic force microscopy. By analyzing the force curves obtained by cell nano-indentation, we measured both cell and
glycocalyx stiffness simultaneously (Appendix Fig S2A). Interest- ingly, TRF2 overexpression increased both glycocalyx and cell stiff- ness (Fig 6B). A visual indication of this TRF2-dependent cell
A B
F
**
80 100 120 140
pSTAT3 (Fold change)
sh scramble
GFP + +
-
- - + -
-
+ + - +
OE hTRF2 GFP
+ + - - - -
sh hHS3ST4 sh hGPC6
- - + + - -
- - - - + +
- - - - - -
sh hVCAN
+ - - + - - - - - - + +
*
* *
* *
***
60 80 100 120
pSTAT3 (Fold change)
sh scramble
sh scramble + +
-
- - + -
-
+ + - +
sh hTERF2 #1
+ + - - - -
sh hHS3ST4 sh hGPC6
- - + + - -
- - - - + +
- - - - - -
sh hVCAN
+ - - + - - - - - - + + -
- + - - -
- - - + - -
- - - - + -
- - - - - +
sh hTERF2 #2 - - + - - + - - + - - +
*
*
***
0 200 400 600 800 1000
Tumor weight (mg)
0 500 1000 1500
sh scramble
sh hHS3ST4sh hGPC6 Tomato OE HS3ST4
Tomato
OE GPC6 Tomato
**
0 20 40 60
% of CD107+ cells
******
0 20 40 60 80
% of MDSC
sh scramblesh h HS3ST4
sh h GPC6
sh h VCAN
0 5 10 15 20
% of NKp46+ cells ***
0 20 40 60 80
% of CD69+ cells
*
BJcl2 +/- TRF2 +/- target gene
MSC2 MDSC cell line
coculture 18 hours
pSTAT3 staining
G
BJcl2 + shRNA target gene
d0 d5
FACS analysis
H
****
* *
I
sh scrambl e
sh h HS3ST4
sh h GPC6
sh h VCAN
sh scramblesh hHS3ST4sh h GPC6
sh h VCAN
sh scramblesh h HS3ST4
sh h GPC6
sh h VCAN
C D E
Figure5. HS3ST4, GPC6, and VCAN are effectors of the MDSC-dependent oncogenic properties of TRF2.
A Schematic representation of the Matrigel plug assay with BJcl2cells knockdown for TRF2target genes. Immune cell infiltration within the Matrigel plugs was determined by FACS.
B–E Percentage of CD11bHiGR1HiMDSCs (B), CD3- NKp46+NK cells (C), NKp46+CD107a+NK cells (D), or CD69+NK cells (E)
F–H Analysis of STAT3phosphorylation by MSC2cells after18h co-culture with BJcl2overexpressing or compromised for TRF2and the target genes (F). Histograms of the pSTAT3mean fluorescence intensity (MFI) of MSC2cells when TRF2was overexpressed and the target gene knocked down (G) and when both TRF2and its target gene were knocked down (H).
I Histograms of tumor weights on day19after implantation of subcutaneous xenografts containing BJcl2cells overexpressing or knocked down for HS3ST4or GPC6. Data information: In (B–E), data are presented by box plots min to max showing all points with median corresponding to the percentages of each cell population among CD45+or NK cells (n=8mice per group; *P<0.05and ***P<0.001; Mann–Whitney test). In (G and H), MFI ofn=3independent experiment is normalized to controls and represented as fold change of MFI (n=3independent experiments; *P<0.05and **P<0.01; Student’st-test). In (I), data are represented as meanSEM (n=8 mice per group; *P<0.05, and **P<0.01; Mann–Whitney test).