Principles of Proportionality in Credit
Institutions’ Operational Risk Management*
Norbert Kozma
Operational risk is a natural risk inherent in credit institutions’ activity, and the scope of this risk is becoming increasingly broad. In parallel with banking practices, supervisory authorities have continuously attempted to identify potential risks and ensure that the capital requirement provides sufficient cover for them. In the practical implementation of this, the regulation regards proportionality as a fundamental principle; however, the interpretation and implementation of this into supervisory practice encounters difficulties. Relying on a wide-ranging analysis of operational risk management applied by small, medium-sized and large banks, this paper provides assistance in the proper application of the principle of proportionality, although it cannot undertake to resolve the dilemmas related to the principles of proportionality. In addition, it contributes to the improvement of the operational risk framework and thereby to reducing the range of continuously growing natural risks, based on the analysis of Hungarian credit institutions’ data, the analysis of the EU regulatory and Hungarian supervisory requirements and an assessment of credit institutions’ practices.
Journal of Economic Literature (JEL) codes: G21, G32, L25
Keywords: banking regulation, operational risk, principles of proportionality, supervision
1. Nature and measurement difficulties of operational risk
In the past decade, the operational risk management of commercial banks has undergone major changes. The sector survived the crisis that commenced in 2007, during which banks primarily strived to mitigate credit risks, while numerous operational risk factors were also identified that had to be addressed. In addition, digitalisation and – the previously unknown – operational risks originating from it, have also come into focus. In parallel with banking practices, supervisory authorities have continuously fine-tuned their expectations in order to identify potential risks and ensure that the capital requirement provides sufficient cover for them. In
* The papers in this issue contain the views of the authors which are not necessarily the same as the official views of the Magyar Nemzeti Bank.
Norbert Kozma is a Senior Modeller at the Magyar Nemzeti Bank. Email: kozman@mnb.hu The Hungarian manuscript was received on 16 March 2020.
the practical implementation of this, the regulation regards proportionality as a fundamental principle; however, the interpretation and translation of this into supervisory practice encounters difficulties.
Operational risk is a relevant risk, which affects all operating institutions, companies and organisations, i.e. it follows from its nature that it is not bank-specific. Nevertheless, since it can generate serious losses for financial institutions, the EU regulation applicable to banks1 (hereinafter: CRR) classifies it as a significant risk. According to the definition applied by CRR, operational risk means the risk of loss resulting from inadequate or failed internal processes, people and systems or from external events.
1.1. Definition of operational risk
In view of the fact that it is a risk which is difficult to delimit, the definition of operational risk calls for additional explanation. As follows from its definition, operational risk is the same age as mankind, as human errors can be identified in any period of history. Despite publication of the regulations governing the risk affecting credit institutions in 2007,2 there are still interpretation issues concerning the definition. As regards credit institutions, the regulation has treated legal risk as an operational risk from the outset. Hungarian solution to foreign currency credit issue, one of the biggest economic and social problem of economic history and the threat to the stability of the financial system – the reduction of retail foreign currency loans with the possibility of final repayment, then the introduction of the exchange rate barrier and complete derecognition of retail foreign currency loans from balance sheet of households (conversion to HUF) – identified new types of operational risks in the banking sector. The significant risks of the foreign currency credit issue have become known as conduct risk (Tamásné 2018), while the operational risks originating from digitalisation, i.e. from information and communication technology, are referred to as ICT risk within operational risks.
The presentation of modelling risk and reputational risk as a kind of operational risk can generate disputes, as it is not always explicit which of those risks we regard as operational risk in the classical sense. The incorrect use of models or running them on erroneous database can be regarded as operational risk, but the inadequacy of the model’s predictive power, the under- or overestimated risk returned as a result, the profitability and capital adequacy risks are more model risks, rather than modelling risks to be classified as operational risk. Reputational risk can be often measured on a qualitative scale; it frequently has no financial impact or is difficult to quantify the loss that may be expected from it, and thus it is difficult to fit this risk into frameworks
1 Regulation (EU) No 575/2013 of the European Parliament and of the Council of 26 June 2013 on prudential requirements for credit institutions and investment firms and amending Regulation (EU) No 648/2012.
https://eur-lex.europa.eu/legal-content/EN/TXT/PDF/?uri=CELEX:32013R0575&from=EN. Downloaded:
18 January 2020.
2 200/2007. (VII. 30.) Korm. rend. a működési kockázat kezeléséről és tőkekövetelményéről (Government Decree 200/2007 (VII. 30.) on the Management and Capital Requirement of Operational Risk), http://www.jogipor-
applied for operational risks. ln line with the nature of the risks, the central bank of Hungary (Magyar Nemzeti Bank, MNB) – in its capacity as the institution performing the prudential oversight of the credit institution sector – regards all of the aforementioned risks (legal, conduct, lCT, modelling, reputation) as operational risk.
In order to better capture operational risks, CRR also defines by topics what exactly is regarded as operational risk. According to this categorisation, external and internal fraud, improper employment and market practices, infrastructural shortcomings as well as individual and process errors in the execution of banking operations should be regarded as operational risks. In operational risk control, these seven categories are referred to as Basel event types. This is usually one dimension of operational risk data collection.
1.2. Measurement difficulties of operational risk
The definition of operational risk is difficult not only in terms of content.
Measurement of the risk is equally difficult, since the operational risk exposure is hard to define and measurement reliability is also very low. Operational risks can be measured according to two risk parameters: one of them is the frequency (probability of event (PE)), while the other one is the severity of the event (loss given event (LGE)), which shows the size of loss that the occurrence of an event may cause for the institution (Homolya 2011a). The expected loss (EL) can be defined by the product of multiplying these two factors. However, it is often difficult to determine the size of the event’s severity and frequency, since two operational risk events are very rarely similar, while the severity cannot be measured for several incurred and potential loss events – e.g. upon the breakdown of IT systems – or can be quantified only on the basis of expert estimations.
Another problem is that it is also difficult to manage the identified events in statistical terms, further complicating measurement of the risk. Operational risk events belong to two categories in statistical terms: i) cases of high frequency and low severity (e.g. fraud committed with retail bankcards), and ii) cases of low frequency and high severity (e.g. payment of claims resulting from product fault).
This categorisation is also presented in Table 1.
Table 1
Types of operational risk events
Low frequency High frequency
High severity Key losses
(may also be extreme, difficult to understand and forecast)
Not relevant
(under such risk profile it is advisable to suspend the activity)
Low severity Insignificant Moderate events
(strong threat, easy-to-understand, measurable)
Source: Homolya (2011a)
The key losses and more moderate, but frequent events constitute distinct groups, which call for different treatment in terms of risk management, since in the first case it is advisable to reduce the frequency, while in the latter case reduction of both the severity and frequency parameter significantly reduces the expected loss.
1.3. Management of operational risks
It follows from the nature of operational risks that that the risk management options also include various methods, such as quantitative and qualitative risk management tools. Qualitative tools may serve the purpose of keeping the management of operational risks in the desired channel through process-integrated and subsequent controls: inherent risk can be substantially mitigated by well-regulated processes, process-integrated manual controls or controls enforced by the IT system, by the management through business continuity and risk-mitigating measures and by the transfer of risk (CEBS 2009). One feature of operational risks is that they can never be reduced to zero: part of the inherent risk survives in all organisations even after the controls. This is why it is essential that institutions also cover their residual operational risks, for the assessment of which CRR provides institutions with three methods:
• Basic Indicator Approach (BIA): this specifies the size of the minimum capital to be held as 15 per cent of the three-year average of a relevant indicator based on the bank’s income. No organisational and methodological requirement is linked to the methodology.
• Standardised Approach (TSA): the capital requirement is specified as the aggregated value of 12–18 per cent (depending on the business line) of the three- year average of the relevant indicator by business line. Use of this method is subject to the approval of the supervisory authority; in addition to breaking down income by business lines, the incurred operational risk losses must be collected, and these activities require the development of competences and responsibilities, as well as an organisational framework. Within this method, there is also an Alternative Standardised Approach (ASA), relevant for banks characterised by the prevalence of retail and commercial banking.
• Advanced Measurement Approach (AMA): the institution calculates the capital requirement based on its own mathematical-statistical model with the use of four mandatory input factors (internal and external loss data, scenarios, business environment and internal control factors). Implementation of the method is subject to supervisory authorisation, which is preceded by validation of the model. Application of the method is conditional on meeting strict qualitative requirements, including the expected level of the organisation’s risk awareness, the establishment of an independent risk management function and the application of risk management principles in daily practice.
The difficulties of risk measurement and management, and the different capital requirement calculation methods raise a number of questions, both for institutions and regulatory authorities. Institutions must decide which method to use for the quantification of the operational risk capital, the identification, measurement and management of their risks and the manner of developing the institutional risk management framework. Supervisory institutions, having a view of institutions at the sector level, have the requirement to be able to somehow compare institutions in terms of the adequacy of risk management. In order to be able to do this, institutions must be differentiated based on size and profile, for which they need to learn the nature of the risk, i.e. whether there is any correlation between the size of the institution and the operational risk. If there is, proportionate supervisory requirements must be developed and applied in practice for the institutions. After development of the requirements –since those may be implemented in several ways – in order to ensure sector neutrality, comparability and harmonisation of the results must be achieved. I have tried to find answers to these questions and dilemmas, based on the analysis of the data of Hungarian credit institutions, the analysis of EU regulatory and domestic supervisory requirements and an evaluation of credit institutions’ practices.
2. Comparison of institutions based on size and risk
The more simple capital calculation methods stipulated by CRR, which regulates the management of operational risks,3 define the volume of the capital requirement as a percentage of the income earned by the bank, thereby suggesting that there is a positive correlation between the operational risk and the size of the bank. Based on this logic, the larger the bank, the higher its operational risks, and due to this the size of the capital requirement must be also increased proportionately.
2.1. Operational risk and institution size
Beyond the interpretation of the spirit of the regulation, the link between operational risk and institution size has been examined by several Hungarian and foreign researchers, and regulatory authorities are also continuously contemplating how to formulate proportionate requirements for institutions. These studies were also based on the assumption that operational risk is proportionate to the size of the credit institution: larger banks have larger operational risk exposure, since:
• operational risk events occur more frequently at larger institutions, as they have a larger workforce, IT infrastructure and branch network, and thus there is more room for potential errors,
3 BIA and TSA
• the average operational risk loss of larger institutions is higher: they execute a larger volume of transactions, have tangible assets of larger value and more complex operating models than smaller institutions,
• larger institutions sell more complex products and services and the operational risk exposure stemming from these may be also higher (e.g. investment banking activities are much more complex than e.g. retail deposit collection and lending activity).
The above correlation was also confirmed by the European Banking Authority (EBA), since in its analysis issued in 2016 it emphasised the correct interpretation of the principle of proportionality for the credit institution sector. In the EBA’s opinion, the principle of proportionality requires
• that the objectives and principles set forth in risk management should not exceed the necessary and realistically achievable objectives,
• if an institution can choose from several methods, it should be allowed to choose the method that represents the least burden for it,
• the cost of the implementation of the set goals must not be higher than the benefits resulting from that (EBA 2016).
In an international context, the research of Na et al. (2005) and Dahen – Dionne (2007; 2010) found that there is a positive, significant correlation between total operational risk loss and the size of the institution (primarily gross income). In these analyses, the researchers found that it is the frequency of the events rather than the severity of the events that is determinant in the correlation. In Hungary, the correlation was analysed by Homolya (2011b). As a result of his research, he also found that there is a significant correlation between the institution size based on gross income and the total loss from operational risk, in a given period.
During the analysis – based on the loss data included in the banking sector’s non- public supervisory reports – he also found that the volume of individual losses is determined by institution size to a lesser degree and depends more on the bank’s business line and the type of the loss.
In analysing the correlation between institution size and operational risk, we also face two measurement uncertainties: how to determine the institution size and how to measure the volume of operational risk. In addition, analyses are also complicated by the fact that public data provide limited information on a bank’s operational risk exposure. The size of a financial institution can be characterised by asset and profit/loss indicators, defined on the basis of the balance sheet and profit and loss statement of the public annual reports or of a credit institution’s internal data (e.g. resources used). Based on the several options available, pros and cons
may be weighed up based on the advantages and disadvantages as well as on ease of access; these factors are summarised in Table 2.
Table 2
Indicators determining institution size
Indicator Advantage Disadvantage
Total assets No major volatility between individual financial years, easily accessible
Does not take into consideration the risks of asset components
Risk-weighted assets
(RWA) Takes into consideration the risks of
asset components (risk-sensitive) Asset indicator of the same type as total assets
Earnings before taxes General profitability indicator, easily
accessible Substantially influenced by one-off, extraordinary items
Relevant indicator Generally accepted in the technical
literature on operational risk May fluctuate between financial years
If size is determined as the volume of the institution’s assets, it can be measured by total assets. The advantage of using total assets as an indicator of size is that it shows no major fluctuations between individual financial years and thus may be suitable for comparison. On the other hand, it has the disadvantage that operational risk losses are essentially realised in income rather than in assets, in the form of expenditures or forgone profit. In the assets approach, the size of a bank – as an alternative – can be also measured by risk-weighted assets, the volume of which does not differ significantly from total assets, but which takes into consideration the risks of individual asset components. However, this information is included in the risk reports rather than in the annual accounts and is difficult to interpret by those not proficient in the Basel risk management framework.
Should we wish to use a profit/loss indicator, the size of the institution can be determined the easiest based on earnings before taxes. However, the disadvantage of this easily accessible indicator is that one-off items may substantially influence its size. If we want to minimise this effect, the institution’s relevant indicator may be used for the measurement of profitability, which – according to CRR – is the sum of the net commission and fee income, income from securities, net income on financial transactions and other operating income. As mentioned earlier, the regulation in force applies this indicator as the basis for the simpler, non-risk-sensitive capital calculation methods.
Compared to determining institutions’ size, determining the operational risk exposure is a more complicated issue, as it is difficult to quantify and because the risk data belong to the institutions’ sensitive information, which are published only to a limited degree or not at all. The size of the capital to cover the risk, the amount of the losses incurred in a given period or the total operational risk exposure may
be suitable for measuring operational risks, and the advantages and disadvantages of these are summarised in Table 3.
Table 3
Indicators determining the size of operational risk
Indicator Advantage Disadvantage
Regulatory capital Easily accessible Not risk-sensitive in all cases (BIA, TSA) ICAAP capital Includes an institution’s risk assessment Often corresponds to the regulatory
capital requirement SREP capital Includes the supervisory authority’s risk
assessment Difficult to measure the risk of
unexpected losses Not public
Annual realised loss Risk-based approach Only show an institution’s historical risks
Total operational risk
exposure Best approximation of an institution’s
operational risk Results of the individual methodologies cannot be aggregated
The size of the regulatory capital forms part of the statutory4 information to be published in connection with operational risks; however, the volume of it – if the institution applies basic approaches for defining the size of the capital – depends on the relevant indicator, i.e. it is not risk-sensitive. The institution may revise the regulatory capital during its Internal Capital Adequacy Assessment Process (ICAAP) based on its real risk, which is then reassessed by the supervisory authority, followed by determining the volume of SREP5 capital. However, these three different capital categories are the same at several institutions, or the unexpected part of the losses is difficult to forecast, for which the capital – in addition to the expected loss – should provider cover.
Of those discussed above, the operational risk exposure – which cannot be quantified, or can be quantified only with major difficulties and inaccurately – is the most suitable indicator; however, these data are not available either at the level of institutions or at the sector level, since it should be determined as the sum of historical losses also relevant in the future and the future potential losses. Of this exposure, only one part – the historical losses – can be used, since financial institutions collect operational risk losses either for the purposes of regulatory requirement or for the assessment of the operational risk profile. When these losses are aggregated at an annual level we arrive at the annual realised loss, which may serve as a basis for the analysis.
4 Act CCXXXVII of 2013 on Credit Institutions and Financial Enterprises, https://net.jogtar.hu/
jogszabaly?docid=a1300237.tv, and Regulation (EU) No 575/2013 of the European Parliament and of the Council of 26 June 2013 on prudential requirements for credit institutions and investment firms and amending Regulation (EU) No 648/2012. https://eur-lex.europa.eu/legal-content/EN/TXT/
PDF/?uri=CELEX:32013R0575&from=EN. Downloaded: 18 January 2020.
5 SREP: Supervisory Review and Evaluation Process
2.2. Correlation of linkage measured on Hungarian data
Considering the potential advantages and disadvantages, in the interests of identifying the correlation between institution size and operational risk exposure, out of the potential alternatives I used four variables for this analysis: the total assets and the relevant indicator, the SREP capital and the annual realised loss. The time horizon of each indicator was one year in the analysis.
I performed the quantitative and qualitative analyses on the 17 institutional groups6 overseen by the MNB that are subject to comprehensive and focused ICAAP-SREP review. The institutions include Hungarian-owned credit institutions as well as credit institutions operating as the Hungarian subsidiaries of foreign parent companies.
Some of them have a traditional past in the Hungarian banking market, while others were transformed into commercial banks from small, local saving banks.
Accordingly, the institutions involved in the analysis show major heterogeneity, which is also evidenced by the descriptive statistical analysis (Table 4).
Table 4
Descriptive statistics of the institutions
Indicator Total assets Relevant indicator Annual realised loss HUF millions
Mean 2,173,625 124,470 2,191
Standard deviation 3,501,398 238,791 5,567
Median 1,547,157 68,987 462
Range 14,551,825 988,030 22,772
Sum of values 34,778,430 1,991,520 35,056
Note: The SREP capital is not included in the descriptive statistical analysis, due to the sensitivity of the data linked to the variable.
The descriptive statistical analysis shows that the total assets of the credit institutions involved in the analysis amount to HUF 37,778 billion in aggregate. The high standard deviation value – compared to the mean – shows the heterogeneity of the participants in the sector, also well reflected by the range indicator (difference between the minimum and maximum values).
6 Since the analysis also includes the credit institutions’ non-public loss data, this paper shows only those data of the institutions that are public for all (e.g. total assets).
As mentioned earlier, the correlation between size and operational risk exposure was analysed using four variables:7
• the size with the total assets and relevant indicator,
• the risk with the annual realised loss and the amount of SREP capital recognised to cover it.
The method of the analysis is correlation calculation, performed by the data analysis module of MS Excel. The correlation between the institution size and operational risk capital variables is shown in Table 5.
Table 5
Correlation matrix
Total assets Relevant indicator Realised loss SREP capital
Total assets 1
Relevant indicator 0.99 1
Realised loss 0.90 0.93 1
SREP capital 0.94 0.96 0.98 1
The correlation analysis shows that there is a very strong positive correlation between the institution size and the operational risk exposure, regardless of whether the size is expressed in terms of assets (total assets) or income (relevant indicator). In addition, there is also strong correlation between the size indicators:
institutions with higher assets also have higher profitability. Furthermore, the SREP capital correlates better with the size indicators than the realised loss. This proved the correlation identified in the data of previous professional literature also on data from 2018 applicable to 17 Hungarian banking group.
2.3. Relative comparison of institutions
If there is a correlation between the size and the risk, the individual institutions can be compared by creating relative indicators, as then the absolute differences disappear. Size-proportionate capital and the indicators measuring the coverage of losses are suitable for making the institutions comparable. The 17 analysed institutions show the picture presented in Figure 1 based on size-proportionate capital, i.e. the SREP capital projected on the relevant indicator and total assets.
7 The value of the variables involved in the analysis come from the credit institutions’ data published or provided for 31 December 2018.
The columns of different colour on Figure 1–4 institutions using different capital calculation methods, indicating institutions that use basic approaches with blue colours and those using advanced approaches with red colours. Based on this it can be concluded that the selected operational risk capital calculation methodology has no impact on the size of total assets as a percentage of capital. The ranking of the institutions is different when the SREP capital is compared with the relevant indicator (Figure 2).
Figure 1
SREP capital as a percentage of total assets
Bank 1 Bank 2 Bank 3 Bank 4 Bank 5 Bank 6 Bank 7 Bank 8 Bank 9 Bank 10 Bank 11 Bank 12 Bank 13 Bank 14 Bank 15 Bank 16 Bank 17
Figure 2
SREP capital as a percentage of the relevant indicator
Bank 11 Bank 4 Bank 1 Bank 7 Bank 3 Bank 5 Bank 12 Bank 17 Bank 9 Bank 14 Bank 2 Bank 15 Bank 8 Bank 13 Bank 6 Bank 10 Bank 16
Credit institutions differ based on the total assets and the capital as percentage of the relevant indicator, because they have different asset and profitability positions, and the size of the capital may be also influenced by individual effects, which may materially influence the ranking of individual credit institutions. However, it can be concluded that – in respect of indicators as a percentage of capital – the sector shows major heterogeneity, which does not depend on the selected capital calculation method.
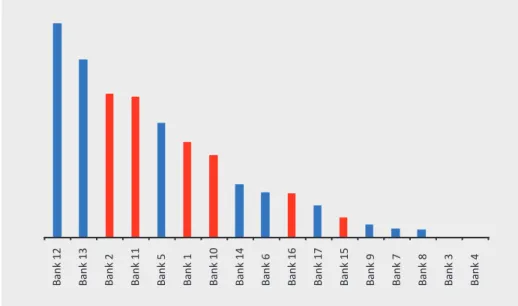
Since the operational risk losses should be covered by the SREP capital and the profit/loss – measured in this analysis by the relevant indicator – it is also worth comparing the credit institutions based on their loss as a percentage of capital and profit/loss. The results are shown in Figure 3.
Figure 3 shows that institution size has no significant influence on the coverage of the loss, provided that we regard the loss data reported by banks as reliable.
However, since the collection of loss data is not required by all capital calculation methods, the completeness of data collection may be an area for improvement in the Hungarian credit institution sector. Comparison of the annual loss with the SREP capital returns a similarly varied result (Figure 4).
Figure 3
Annual realised operational risk loss as a percentage of the relevant indicator
Bank 12 Bank 13 Bank 2 Bank 11 Bank 5 Bank 1 Bank 10 Bank 14 Bank 6 Bank 16 Bank 17 Bank 15 Bank 9 Bank 7 Bank 8 Bank 3 Bank 4
As a result of the analysis, the following may be concluded:
• the correlation analysis performed on the data of Hungarian institutions subject to comprehensive and focused ICAAP review clearly shows close, positive correlation between institution size and operational risk,
• no difference can be identified between the analysed institutions based on the capital calculation approach they use,
• based on the relative indicators (operational risk capital as a percentage of assets and income, loss coverage by capital and profit/loss) the institutions become comparable,
• in order to ensure the reliability of the relative measurement of operational risk, the data collection of operational risk loss must be improved and harmonised across the sector.
Since we realised that there is a correlation between the operational risk and institution size, and the institutions become comparable based on relative indices, it may be worth examining how institutions of various size define their own operational risk activity and whether, on the basis of that, is it necessary to use different type of oversight approaches for institutions of different size.
Figure 4
Annual realised operational risk loss as a percentage of the SREP capital
Bank 13 Bank 12 Bank 2 Bank 10 Bank 16 Bank 5 Bank 11 Bank 1 Bank 6 Bank 14 Bank 17 Bank 15 Bank 9 Bank 8 Bank 7 Bank 3 Bank 4
3. Oversight of operational risk management and the practice of banks
In view of the fact that it is proven that operational risks are proportionate to institution size, it may be assumed that the capital calculation methodology selected by the various institutions and their established risk management practice is also proportionate to size.
3.1. Feature of banks’ selection of methodology
When subjecting the practice of the institutions under review to a qualitative assessment it can be concluded that there is a regularity between the selected capital calculation method and the institutions’ risk management practice, as also shown by Table 6.
Table 6
Selection of Pillar 1 capital calculation methodology by institutions subject to comprehensive or focused ICAAP review
Institution Total assets*
(HUF millions) Method** Category of method
OTP 14,590,288 AMA Advanced
K&H 3,198,727 TSA Basic
UniCredit 3,058,539 AMA Advanced
Erste 2,563,507 AMA Advanced
Raiffeisen 2,417,257 TSA Basic
Integráció*** 2,324,024 BIA Basic
CIB 1,905,081 TSA Basic
MKB 1,857,579 TSA Basic
Budapest Bank 1,236,735 AMA Advanced
Fundamenta 555,267 TSA Basic
Sberbank 365,837 TSA Basic
Gránit 353,544 BIA Basic
Magnet 151,200 BIA Basic
Duna 88,564 BIA Basic
Sopron 73,819 BIA Basic
Polgári 38,463 BIA Basic
Note: * Data on 31 December 2018. ** Applied method in 2019. *** Magyar Takarékszövetkezeti Bank Zrt. and the savings banks subject to consolidated supervision together.
Source: Compiled based on information published by the credit institutions.
The table above sorts credit institutions by the volume of total assets. The data show that there is a major difference in magnitude between the credit institutions in terms of assets, based on which they can be divided into two major groups: credit institutions with total assets over and below HUF 1,000 billion. For the purposes of
latter as small banks. Based on the data disclosed by the credit institutions, it can be concluded that all of the small institutions use the basic approach. Large banks show a mixed picture, but it can be stated that the advanced approach is used only by large banks. This means that larger institutions allocated more resources to the identification, measurement and management of operational risks than small banks, which may have multiple objectives:
• more accurate definition of the operational risk profile to prevent the realisation of the identified risks, thereby minimising losses;
• conscious optimisation of the operational risk capital requirement as the application of the advanced approaches may result in lower capital requirement;
• strengthening reputation by applying the advanced capital calculation approach, which entails a positive perception by owners, supervisory authorities and other stakeholders (e.g. professional investors, lenders, etc.).
3.2. Link between the size of the institution and the risk management practice Beyond the institutions’ choice of methodology, experiences from the MNB’s annual ICAAP-SREP review also confirm that there are major differences between the operational risk management activity of small and large banks, as summarised in Table 7.
Table 7
Different risk management practice of small and large banks
Characteristics Large institutions Small institutions Awareness of operational risk
management Calculated, independent of other
risks Less calculated, integrated with
other risks Organisational features Have independent operational
risk management organisation Have no independent operational risk management
Diversity of the applied risk
management methods Typically they cover the entire spectrum of the operation risk management instruments
Focus on incurred losses through the collection of loss data
“Driver” of operational risk
management Identified risks derived from the
risk profile Economies of scale benefits Method of mitigating risks Proactive and reactive
(through the incurred losses and identified risks)
Reactive
(only through the incurred losses)
In addition to the foregoing, the reviews also found that it is typical of small institutions that – although the organisational and regulatory framework for operational risk management has been established – it is often not applied in daily risk management practices. Accordingly, the collection of loss data – which according to the experiences forms part of all institutions’ risk management practices – is a well-defined activity, but in practice it is implemented only on ad-hoc basis, and
the subsequent control of it is only performed rarely. In addition, it is typical of small institutions that their risk assessment methodologies related to the present or future are underdeveloped, and they typically focus on preventing the repeat occurrence of losses incurred in the past. It follows from this that the mitigation of the identified risks also follows the same pattern: the risk mitigation actions are ad- hoc and monitoring of their implementation is not comprehensive. This is due to the fact that they do not have sufficient resources for the operation of the framework of large banks. However, it should be noted that the above findings should not be generalised: in the Hungarian credit institution sector there is also a foreign- owned small bank that uses advanced measurement approach and framework;
however, stable parent company background and methodology are essential for this.
In contrast to small banks, the framework of large banks is advanced and integrated into the banks’ organisations, with well-defined competences and responsibilities.
However, due to the different interpretation of the effective regulation and the wide-ranging parent company expectations, the output of the operational risk management methods varies in the individual institutions. However, it can be also observed that the implementation of the risk management methods introduced several years ago may become a routine, and the regular review of such may be neglected and, as a result of this, new operational risks appearing in the business environment may not be identified and assessed by the institution. As regards the registration and monitoring of risk mitigation actions, the practice of large institutions also varies: some institutions manage them similarly to the audit points, while others handle them according to competences allocated to organisational units.
3.3. Presence of the principle of proportionality in the supervisory expectations The differences outlined in the previous sections also justify the application of different methods in the oversight of operational risk management between small and large banks, considering the principle of proportionality; additionally, it is also necessary to harmonise the different practice of institutions in parallel with preserving operating good practices. However, practical formulation of the principle of proportionality is not an easy task, as is also underlined by the results of the Basel Committee’s 2019 research. This research identified the following difficulties and potential threats in connection with this:
• the definition and application of the principle of proportionality complicates the comparability of the individual institutions,
• the definition of the principle of proportionality may jeopardise free competition, providing certain institutions or groups of institutions with advantages,
• the differentiation of expectations calls for the development of segments, the practical implementation of which may be cumbersome (selection of measurement methods, integration of quantitative and qualitative elements, etc.),
• banks taking unjustified advantage of the potential benefits stemming from the differentiated requirements, which may widen the gap between the risk profile and the expectations (BIS 2019).
Bearing in mind the aforementioned risks and the principle of proportionality, the MNB – in its capacity as the institution overseeing operational risk management – revised its requirements and published these for the institutions in the ICAAP Manual for 2020 (MNB 2019). The revised expectations apply to the Pillar 2 risk assessment procedure, beyond the statutory expectations applying to the Pillar 2 risk assessment, and were formulated at multiple levels:
• they contain risk management principles, the practical implementation of which is mandatory for all institutions (independently of size and profile),
• they define the expectations – enforcing the principle of proportionality – that are mandatory for small institutions,
• they make recommendations to large banks with a view to maintaining good practices and harmonising methodological differences.
The expectations are summarised in Table 8 and detailed explanations are presented in the following part of this section.
Table 8
Methodological expectations towards small and large banks
Category Components of the framework Large banks Small banks
Basic requirements Regulation x x
Capital requirement calculation x x
Operational risk report x x
Risk governance (Committee) x x
Risk mitigation actions x x
Methods connected to
Pillar 1 Collection of loss data x x
data collection controls x x
regular training x x
Scenario analysis x x
Risk self-assessment x
Key risk indicators (KRI) x
Methods linked to
ICAAP-SREP Product inventory x
Model inventory x
Reputational risk management x x
ICT risk management x x
Conduct risk management x x
Source: MNB (2019)
As regards the management of operational risks, it is a basic requirement for all institutions that they be able to assess their own operational risk profile and the bank’s management must take into consideration the assessed risks in the decision-making process. To this end, it is essential that risk management is a well- defined, calculated and regulated activity in the credit institution and apart from historical risks, current and future risks are also taken into consideration (Figure 5).
Institutions are also expected to attempt to consciously reduce their operational risk exposure and to define and identify new types of operational risks (e.g. conduct, reputation and ICT risks) in the institutions. As regards the expectations, the supervisory authority must ensure that none of the institutions incurs competitive disadvantage vis-à-vis other institutions in respect of the applied methodologies;
in addition, the principles of proportionality must be taken into consideration upon the development and assessment of the framework.
When formulating the expectations, it was stipulated that both small and large institutions must collect loss data, as the losses incurred in the past serve as a skeleton for the development of the operational risk profile. The prevention and/
or mitigation of the effects of losses thus identified is key to a bank’s proper long- term operation and profitability. Small institutions are also expected, in addition to data collection, to introduce at least one method that measures present and future risks. This method may be – as also shown in Figure 5 – the risk self-assessment, the definition, measurement and monitoring of key risk indicators (KRI) and the analysis of the operational risk scenarios. The risk-based model and product inventory, implemented in domestic practice, may be also suitable for the quantification of operational risks. However, in respect of the expectations related to the selected method, the expectation does not differ based on institution size.
Figure 5
Time horizon of operational risk management methods
Loss data collection
Present
Past Future
Risk-based model inventory
and controlRisk self-assessment
Risk-based product inventory
Key risk indicators
Scenario analysis
Large institutions should preserve good practices and harmonise the individual methods. It is important that all supervised institutions assess the operational risks that are typical for the industry and identify in their framework the risks that appear as new in the market from time to time. Since the key objective is to prevent future risks, the MNB intended to support this by creating the list of recommended scenarios and KRIs for the sector, which was published in the 2020 ICAAP manual, and defined in accordance with the logic outlined on Figure 6.
After processing 721 key risk indicators and 172 scenarios of ten domestic credit institutions, the MNB recommends scenarios in 17 topics and key risk indicators in 21 topics to be developed by the institutions, which standardises the most frequently applied indices of the domestic small, medium-sized and large banks as the best practice of the sector, and also includes the following new types of risks:
• since at sector level the provision of labour force of proper quality and quantity represents difficulties, it is proposed to perform regular backtesting of the losses arising from the exit of key personnel, and the number of vacancies and the average time of hiring,
• the assessment of risks related to digitalisation should cover the existing infrastructure (ratio of obsolete IT systems), risks originating from erroneous IT developments and related project management and the related system failures, Figure 6
Process of defining the proposed scenarios and indices
Overview of large bank’s scenarios and
key risk indicators
Identification of the same indicators and
scenarios (industrial benchmark)
Defining scenarios and indicators for uncovered risk
List of recommended indicators and scenarios
• due to the cross-border payment transactions carried out faster and faster, money laundering risks should be taken into consideration,
• potential operational risk events and losses arising from non-compliance with the EU data protection regulation (General Data Protection Regulation – GDPR) also qualify as an operational risk, and thus the measurement of such must also form part of the operational risk framework.
As a result of the foregoing, the ICAAP Manual for 2020 formulated the following lists of KRIs and scenarios (Table 9 and Table 10) for the supervised institutions broken down by risk categories.
Table 9
Set of key risk indicators recommended by the MNB
Category Recommended KRI
Improper employment and
market practices Number/duration of vacancies
Staff turnover rate Number of complaints received
Number/amount of litigation Number/amount of penalties paid Internal and external fraud Number/amount of prevented/occurred fraud cases
Number/ratio of money laundering alerts Number of internal fraud cases Infrastructural shortcomings Availability of IT systems
Number/ratio of obsolete IT systems Number of HelpDesk reports
Number of BCP incidents Execution, delivery and process
management Number of data protection of incidents
Number of missed deadlines (external and/or internal) Number/ratio of complaints responded to after the deadline
Workload indicators (by functional areas) Number/ratio of erroneous transactions
Number/ratio of incomplete loan files Lead time of retail/corporate loans Number/ratio of overdue audit points
Number/ratio unrevised regulations Source: MNB (2019)
Table 10
Set of scenarios recommended by the MNB
Category Proposed scenario
Improper employment and market practices Epidemic illness Exit of key personnel Large-amount administrative penalty
Erroneous product/model/practice Lawsuit for damages (client/partner/employee)
Internal and external fraud Credit fraud
Fraud committed with transaction products Unauthorised treasury activity IT security incident (hacker, virus, phishing)
Money laundering and terrorist financing Infrastructural shortcomings Breakdown of key IT systems/public utility services
Erroneous IT development and/or project Natural disasters
War or terrorist attack
Execution, delivery process management High-amount transactions carried out by mistake Absence of deadline and/or documentary requirements
Supplier performance in breach of the contract Source: MNB (2019)
When the credit institutions assess the proposed scenarios and key risk indicators, it also must be analysed whether those are relevant for the respective institution.
The rejection of a proposed scenario or indicator without due justification may result in the institution’s failure to take account of a real risk.
If the institutions’ risk management practice and the supervisory expectations meet, it will be possible to apply and backtest the principles of proportionality also in the operational risk management activity of the Hungarian credit institution sector, with the following results:
• all credit institutions – irrespective of the size – collect their loss data in full and in a controlled manner, from which the institutional and sector-level operational risk exposure can be determined more accurately;
• all domestic credit institutions perform operational risk analysis for the present and future, in addition to the historical focus; risk management improves;
• operational risks that affect all financial institutions and the new types of operational risk are also identified in addition to the regularly assessed risk factors by prescribing the application of best practices;
• the mitigation of operational risks by measures takes place in accordance with identical registration and procedural criteria, both at the level of institutions and at the sector level.
4. Summary
In this paper, I present how operational risk control and oversight activity can be developed applying the principle of proportionality that is capable of identifying and efficiently mitigating risks irrespective of the institution size, at the same time taking due account of the operational and resource differences resulting from the size.
In order to determine the principles of proportionality, it had to be examined whether there is any correlation between the magnitude of the risk and size of the credit institution. The strong correlation was also proven by the statistical analysis performed on the data included in the Hungarian and international professional literature and on the data of institutions subject to comprehensive and focused ICAAP-SREP review process. In addition, credit institutions’ choice of methodology – according to which larger institutions tend to opt for advanced operational risk management methods – also confirm that the interpretation and scope of the operational risk control activity varies depending on the size of the institutions.
In order to apply the principles of proportionality in practice as well, supervisory authorities must provide specific guidance. Firstly, general principles must be formulated that are essential for the identification of an institution’s operational risks and for the decision whether the institution accepts, mitigates or transfers the risk. These general principles include the creation of the regulatory framework, the development of the reporting lines, the creation of dedicated competences and responsibilities and the monitoring and management of identified risks.
After formulating general principles, applicable to all institutions, it is advisable to manage small and large banks separately, since – as seen – their operation is implemented through different organisational solutions and complexity, and their resources also differ. While large banks may be expected to use all operational risk assessment methodologies, in the case of small banks it may be sufficient to use at least one instrument – in addition to collecting historical loss data – that identifies their future potential risks.
In the case of larger credit institutions, harmonisation of the applied methods and the identified risks may be set as an objective by sharing the good practices that can be regarded as an industry benchmark. The set of key risk indicators and set of scenarios, proposed in the paper, provide banks with the opportunity to measure and manage their risk uniformly across the sector.
The paper tries to apply the principles of proportionality in practice in the area of operational risk management. The practical application of these will strengthen institutions’ risk-based operation and risk-based oversight by the supervisory authority. This contributes to the stability of the financial system and to increasing its shock-absorbing capacity. In addition, both the regulation – included the new capital calculation requirements (BIS 2017) being finalised – and the range of potential operational risks are continuously changing, for the implementation of which it is essential to create stable common foundation in the present operational risk management practice.
References
BIS (2017): Basel III: Finalising post-crisis reforms. Bank for International Settlements, December, pp. 128–137. https://www.bis.org/bcbs/publ/d424.pdf. Downloaded: 18 January 2020.
BIS (2019): Proportionality in bank regulation and supervision – a survey on current practices.
Bank for International Settlements. March, pp. 6–7. https://www.bis.org/bcbs/publ/d460.
pdf. Downloaded: 30 May 2020.
CEBS (2009): Guidelines on Operational Risk Mitigation Techniques. Committee of European Banking Supervisors. December 2209. https://eba.europa.eu/sites/default/documents/
files/documents/10180/16094/f3178712-1791-47ed-b648-928f78211a93/cebs42_
Guidelines.pdf?retry=1. Downloaded: 30 May 2020.
Dahen, H. – Dionne, G. (2007): Scaling Models for the Severity and Frequency of External Operational Loss Data. Working Paper 07–01, Canada Research Chair in Risk Management.
https://doi.org/10.2139/ssrn.958759
Dahen, H. – Dionne, G. (2010): Scaling Models for the Severity and Frequency of External Operational Loss Data. Journal of Banking & Finance, 34(7): 1484–1496. https://doi.
org/10.1016/j.jbankfin.2009.08.017
EBA (2016): Proportionality in Bank Regulation. A Report by the EBA Banking Stakeholder Group. European Banking Authority, pp. 15–17. https://eba.europa.eu/sites/default/
documents/files/documents/10180/807776/de9b6372-c2c6-4be4-ac1f-49f4e80f9a66/
European%20Banking%20Authority%20Banking%20Stakeholder%20Group-%20 Position%20paper%20on%20proportionality.pdf?retry=1. Downloaded: 30 May 2020.
Homolya, D. (2011a): Bankok működési kockázata és intézményméret (Operational risk of banks and institution size). Phd. thesis, Doctoral School of Business and Management, Corvinus University of Budapest.
Homolya, D. (2011b): Operational risk and its relationship with institution size in the Hungarian banking sector. MNB-Bulletin, 2011(June): 7–17.
MNB (2019): A tőkemegfelelés belső értékelési folyamata (ICAAP), a likviditás megfelelőségének belső értékelési folyamata (ILAAP) és felügyeleti felülvizsgálatuk, valamint az üzleti modell elemzés (BMA). (Internal Capital Adequacy Assessment Process (ICAAP), Internal Liquidity Adequacy Assessment Process (ILAAP) and their supervisory review, and business model analysis (BMA)). Magyar Nemzeti Bank. https://www.mnb.hu/
felugyelet/szabalyozas/felugyeleti-szabalyozo-eszkozok/modszertani-kezikonyvek/icaap- ilaap-bma-felugyeleti-felulvizsgalatok. Downloaded: 27 February 2020.
Na, H.S. – Couto Miranda, L. – van den Berg, J. – Leipoldt M. (2005): Data Scaling for Operational Risk Modelling. ERIM Report Series: ERS-2005-092-LIS.
Tamásné Vőneki, Zs. (2018): Működési kockázatkezelés a válság után (Operational risk management after the crisis). Economy and Finance, 5 (4): pp 321–333.