Ilkogretim Online - Elementary Education Online, 2021; 20 (2): pp.123-132 http://ilkogretim-online.org
doi: 10.17051/ilkonline.2021.02.16
Students Perception of Teachers’ Use of Formative Assessment Strategies in Mathematics Classrooms
Ruth Nanjekho Wafubwa, University of Szeged, ruthnanje@gmail.com, ORCID: 0000-0002-7236-8408 Peter Okiri Ochieng, University of Szeged, ochiengokwirih@gmail.com,ORCID: 0000-0003-2163-4830 Abstract. This study examined the perceptions of Kenyan secondary school students regarding the use of formative assessment practices by their mathematics teachers. The sample consisted of 1000 students from 30 secondary schools. The results showed that students had an overall low perception of their mathematics teachers' use of formative assessment, with the lowest perception reflected in the use of monitoring strategies. There was no significant difference in the perceptions of male and female students regarding perceived monitoring strategies but a significant difference regarding the scaffolding strategies was found. Analysis of variance showed a significant effect on school categories. The findings suggest that Kenyan secondary school mathematics teachers rarely use formative assessment but instead use the traditional summative assessment in classrooms. The findings point out the need for establishing the reasons that hinder mathematics teachers’ use of formative assessment and how formative assessment can best be introduced into the classrooms.
Keywords: Students’ perceptions, Formative assessment, Monitoring strategies, Scaffolding strategies Received: 04.12.2020 Accepted: 19.01.2021 Published: 03.02.2021 INTRODUCTION
The growing importance associated with the 21st-century skills and competences has seen educators and researchers shift the focus of educational assessment from summative to formative (Demetriou et al., 2011). Formative assessment is commonly referred to as a classroom practice that shows evidence about student achievement (Black & William, 2009). According to Clark (2012), formative assessment is designed to continuously support teaching and learning. Formative assessment thus occurs throughout the teaching and learning cycle. Gipps et al. (2015) looked at the assessment in terms of its functions. For instance, assessment can support teaching and learning and document information about learners in terms of their knowledge, skills, and attitudes. Formative assessment is seen as a tool to empower students to ‘learn how to learn’ by emphasizing the process of teaching and learning and involving students as partners in the learning process (Swaffield, 2011). Through formative assessment, students can build skills and develop a wide range of effective learning strategies for lifelong learning and become autonomous and self-regulating learners (Nicol & Macfarlane-Dick, 2005; Vrugt & Oort, 2008). Empirical studies support the fact that formative assessment is associated with benefits such as making learning visible and providing strong feedback to teachers (Black & Wiliam, 1998; Hattie, 2008; Black & William, 2009; Clark, 2012; Hargreaves & McCallum, 2015). Studies have also shown that formative assessment has positive effects on students’ achievement (e.g., Anderson & Palm, 2017; Ozan & Kincal, 2018) and can promote students’ learning (Gipps et al., 2015).
Significant research has been done regarding teacher’s perceptions of formative assessment (Öz, 2014; Pat-El, et al., 2015; Nasr et al., 2018; Kyaruzi et al., 2018) but very limited focus on students’
perceptions of formative assessment in secondary schools. Related research has looked at assessment in general. For instance, a study by Brown and Hirschfeld (2008) looked at how students conceive assessment and how it is related to learning outcomes. The study revealed that students who see assessment as making them responsible learners have increased learning outcomes. Studies have also revealed that students’ perceptions of assessment positively influence their academic self-efficacy beliefs (Alkharusi et al., 2014). Recent studies have shown that formative assessment strategies such as feedback and success criteria are frequently valued by students (DeLuca et al., 2018; Vattøy & Smith, 2019). Studies have further suggested that teachers’ quality feedback and scaffolding strategy use positively predict students’ use of feedback whereas monitoring strategy use harms students’ feedback use (Kyaruzi et al., 2019). A study by Pat-El et al. (2013) specifically looked at students’ perceptions of formative assessment in terms of monitoring and scaffolding practices. Students’ perceptions of their teachers’ use of monitoring and scaffolding strategies affect their learning approaches (Baas et al., 2014).
Monitoring practices foster students’ self-monitoring while scaffolding activities stimulate students’ to reflect on their learning process (Pat-El et al., 2013).
Research on students’ gender and formative assessment has not received much attention. Few studies have addressed assessment in general. Gao (2012) in his study on high school students’
perceptions of classroom assessment in mathematics found a statistically significant gender difference in favor of girls. A study by Alkharusi & Al-Hosni (2015) also reported gender difference effects on students’
perceptions of classroom assessment tasks. On the contrary, a study by Deutsch et al. (2012) reported that gender did not play a role in the number of e-assessment tests involving university students.
Generally, few studies have focused on the effect of gender on students’ perceptions of assessment. It will be interesting to find out the effect of gender on the perceptions of students towards formative assessment.
Formative assessment theory stems from the seminal work of Black & Wiliam (1998) after the synthesis of over 250 studies that linked assessment and learning. The main features of formative assessment that were identified included: sharing criteria with learners; developing classroom talk and questioning; giving appropriate feedback; and peer and self-assessment. Reiterating on Black & Wiliam’s work, Sadler (1998) defined formative assessment as the assessment which is intended to provide feedback on performance and accelerate learning. The Assessment Reform Group (2002) defined formative assessment (also referred to as assessment for learning) as involving the process of searching and clarifying evidence for use by learners and their teachers which entails filling the gap in students’
learning. The Assessment Reform Group definition was informed by research-based principles such as effective planning of teaching and learning and learning how to learn. Formative assessment is thus regarded as central to the classroom and should be part of the learning process.
During the Third International Conference on Assessment for Learning, formative assessment was seen as part of everyday practice by teachers, students, and peers involving ways that promote ongoing learning (Third Assessment for Learning Conference, 2009). This definition is in line with the definition given by the Formative Assessment for Teachers and Students (FAST) group which defined Formative Assessment as “a process used by teachers and students during instruction that provides feedback to adjust ongoing teaching and learning to improve students’ achievement of intended instructional outcomes” (Popham, 2008, p.5). This definition is also in line with the commonly quoted definition of formative assessment by Black & Wiliam (2009) who considered formative assessment as a classroom practice.
Practice in a classroom is formative to the extent that evidence about student achievement is elicited, interpreted, and used by teachers, learners, or their peers, to make decisions about the next steps in instruction that are likely to be better, or better founded, than the decisions they would have taken in the absence of the evidence that was elicited (Black and Wiliam, 2009, p. 9).
The central idea behind formative assessment is that evidence of student learning is used to adjust instruction to better meet students’ learning needs. Whereas evidence in formative assessment is used to inform teaching and learning, in summative assessment, the evidence is used to report on where the learning is at a particular point in the learning process (Black & Wiliam, 2009; Wiliam, 2011). Unlike summative assessment which is used as a measurement instrument, formative assessment is designed to support teaching and learning continuously (Clark, 2012; Gipps, 2015). In the formative assessment framework (Black & Wiliam, 2009), teachers, learners, and their peers are the key agents of learning.
Learners take part in formative assessment through self-assessment which enables them to reflect, evaluate, and judge the quality of their work and their learning based on the set goals (Andrade & Du, 2007). Understanding learners’ perceptions of the use of formative assessment in their classrooms are therefore crucial for effective learning.
Kenya is one of the countries that have adopted the framework for the implementation of 21st- century skills and competences. This means that the focus of assessment has to shift from summative to a formative assessment of competences (KICD, 2017). The country is currently going through a transition period from the old 8-4-4 curriculum which focused more on summative assessment to a new 2-6-6-3 structure which is competency-based. So far, the competency-based curriculum (CBC) has been introduced to the lower grades from preprimary 1 to primary 4. The CBC is yet to be introduced to the secondary schools which are still using the old structure. The 8-4-4 structure implies eight years of primary education, four years of secondary education, and a minimum of four years of university education. Students who sit their end of primary school examination in standard eight (grade 8) are promoted to secondary schools of their choice based on merit. The secondary schools are classified in different categories as National, county, or sub-county schools. Under each category, a school can either be girls’ school, boys’ school, or mixed boys’ and girls’ schools. Since the introduction of a policy on 100 percent transition of primary school pupils (Republic of Kenya, 2010), students who graduate from
primary schools are admitted to one of the school categories based on merit. Top students are therefore admitted to national schools, average students to county schools whereas low performing students to sub-county schools.
Students in all school categories are taught by trained and qualified teachers who must be registered by the Teachers’ Service Commission (TSC). All secondary school teachers in Kenya go through the same training either at the university or a diploma college for four and three years respectively. Due to high rates of unemployment, some teachers teach on a contract basis whereas the majority of them are on permanent employment. Any qualified teacher can thus teach in any category of school. Over the years, the performance of students in mathematics has been dismal despite several interventions that have been put in place (Wafubwa & Obuba, 2015; KNEC, 2017; KCSE, 2019). Among the interventions that have been carried out in secondary schools so far, none has fully focused on formative assessment. This study sought to fill the gap by examining the learners’ perceptions of formative assessment to design an intervention program that is hoped to impact positively on mathematics achievement. This study will also help in understanding the role that background factors play in students’ perceptions of their teachers’ use of formative assessment strategies. The current study was, therefore, guided by the following research questions:
1. How do Kenyan secondary school students perceive the use of monitoring and scaffolding strategies in mathematics classrooms?
2. How do students’ perceptions of formative assessment differ by gender and school category?
METHODS Instruments
This study was conducted using a Student Assessment for Learning Questionnaire (SAFL-Q) which was developed and validated by Pat-El et al. (2013). The questionnaire consisted of two scales: perceived monitoring (16 items) and perceived scaffolding (12 items) with high psychometric properties. This questionnaire was adapted for the mathematics classrooms by giving clear instructions so that students focused on their mathematics teachers as they responded to the items. All items were measured on a 5 point Likert scale ranging from not at all (NA=0) to always (A=4).
Sample
The study was conducted in Bungoma County which is located in the western part of Kenya with an approximate population of 1.7 million people (Kenya National Bureau of Statistics, 2019). The study sample consisted of 1000 students aged between 16 and 18 years (male=505) from 30 public secondary schools. The target population in this study was form three (grade 11) students from 242 public schools in Bungoma County. The sample was obtained from eight different school categories within the County.
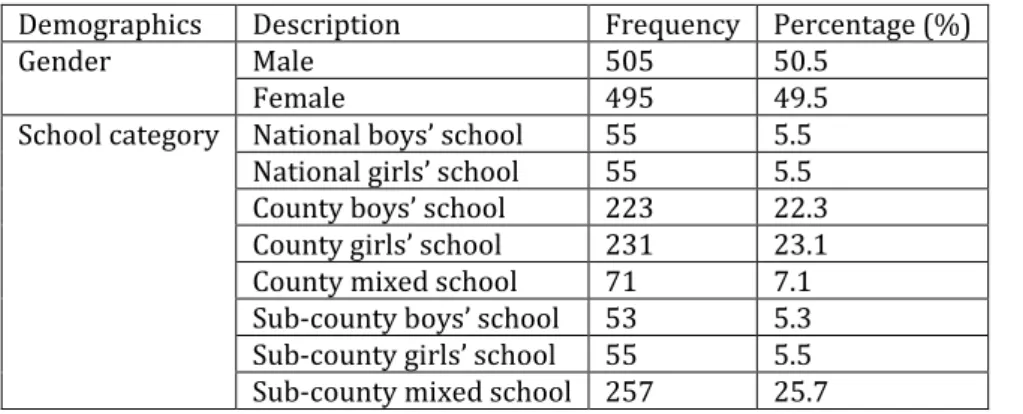
Stratified and simple random sampling techniques were used to obtain a representative sample for the eight school categories as shown in table 1. Grade 11 class was deemed suitable for the study because it was a pre-candidate class. This implied that a follow-up study could be carried out to assess the student’s achievement during summative evaluation which is carried out at the end of secondary education (grade 12).
Table 1. Background information about the participants
Demographics Description Frequency Percentage (%)
Gender Male 505 50.5
Female 495 49.5
School category National boys’ school 55 5.5 National girls’ school 55 5.5 County boys’ school 223 22.3 County girls’ school 231 23.1
County mixed school 71 7.1
Sub-county boys’ school 53 5.3 Sub-county girls’ school 55 5.5 Sub-county mixed school 257 25.7 Data Collection and Analysis
After obtaining a research permit from the ministry of education, science, and technology, the questionnaires were administered to the students with the help of the classroom teachers who were not
mathematics teachers. Students were allowed to seek clarification and each student took approximately 15 minutes to complete the questionnaire. Statistical data analyses were conducted using AMOS Graphics 23 for confirmatory factor analysis and IBM SPSS 25 for descriptive and inferential statistics. Descriptive statistics such as frequency, mean and standard deviation were computed to show the characteristics of the data. Confirmatory factor analysis was done to examine the extent to which the model fitted the questionnaire data of the Kenyan sample. The independent samples T-test was used to examine the difference in the perceptions of formative assessment between boys and girls. One way ANOVA was conducted to determine any differences among the school categories.
Questionnaire Analysis Confirmatory Factor Analysis
The adapted two-factor questionnaire which consisted of 16 items on the monitoring scale (see Table 3) and 12 items on the scaffolding scale (see Table 4) was subjected to confirmatory factor analysis to see whether the model fitted the Kenyan sample well. The confirmatory factor analysis was computed through AMOS Graphics 23 and data analyzed through the maximum likelihood estimation method. The standardization approach where all covariances were set to be 1 was used to assess the model. Different goodness of fit indices which included the normed chi-square (CMIN/DF), the root-mean-square error of approximation (RMSEA), standardized root mean square residual (SRMR), Tucker-Lewis index (TLI) and the comparative fit index (CFI) were used to check if the original model was suitable for the Kenyan context. Confirmatory factor analysis (N = 1000) of the two factor model (perceived monitoring and perceived scaffolding) resulted to the following statistical fit indices: CMIN/DF = 3.507, RMSEA = .05 [90% CI = .47, .53], SRMR = .0465, TLI = .856, CFI= .867.
Although the recommended value for CMIN/DF should range between 1.0 and 3.0, values below 5 are also acceptable (Schumacker & Lomax, 2004). The values of RMSEA (0.05) and SRMR (0.0465) obtained in the current sample all indicated a good fit (Teo, 2013). The values of the two incremental indices; TLI (0.856) and CFI (0.867) are slightly below the recommended threshold of 0.9 but still within the acceptable range (Ho, 2006). All in all, the fit indices show that the model fits the Kenyan context.
Reliability Analysis
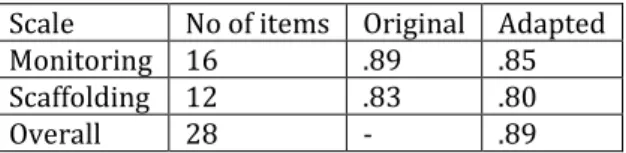
Cronbach's alpha statistics were computed to determine the reliability of the scale and subscales. The reliability for the 28 items of the SAFL-Q was .89. The reliabilities for the subscales were .85 for the Monitoring scale and .80 for the scaffolding scale. The reliability analysis confirmed that the SAFL-Q scale measures precisely the underlying constructs. Table 2 shows reliabilities for the original and the adapted instrument
Table 2. Cronbach's alphas for the instrument Scale No of items Original Adapted
Monitoring 16 .89 .85
Scaffolding 12 .83 .80
Overall 28 - .89
RESULTS Students’ Perceptions of Formative Assessment
Students’ perceptions were analyzed using descriptive statistics, independent samples T-test, and one way ANOVA. The mean of the overall scale was M=2.62; SD=.68 whereas the means for the subscales of perceived monitoring and perceived scaffolding were M=2.48; SD=.77 and M=2.81; SD=.73 respectively.
This indicates that students had a generally low perception of their mathematics teachers’ use of formative assessment. The mean for perceived scaffolding was however slightly higher than the mean for the perceived monitoring scale.
Monitoring Strategies
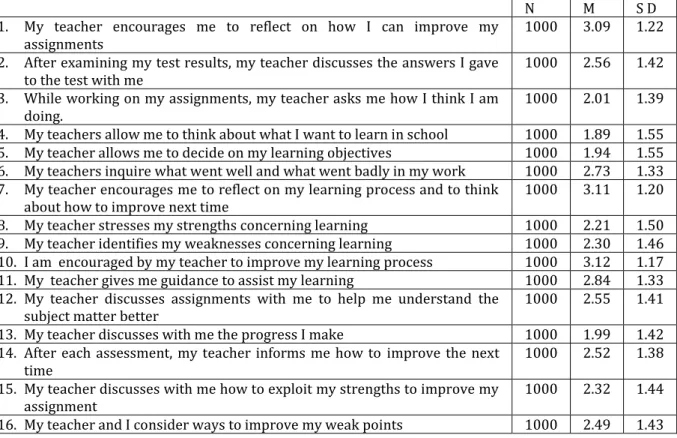
Analysis of the monitoring strategies showed that the perceptions of students ranged from low (M=1.99;
SD=1.42) to moderate (M=3.12; SD=1.17). The students’ lowest perception was reflected in items 4, 5, and 13 with means below 2.0 (see Table 3). Items 3 and 4 were assessing the students’ involvement in planning their learning through goal setting and how to achieve the goals. This shows that teachers rarely
involved students in self-regulating activities. Item 13 was about teachers’ involvement in students’
progress. The low mean in the students’ perceptions implies that teachers rarely gave feedback to students regarding their learning progression. Perceptions for items 1 and 10 were moderate. This suggests that on average, mathematics teachers encourage students to improve on the assignments and learning process. Generally, the use of monitoring strategies by mathematics teachers is below average implying that teachers rarely use monitoring strategies in mathematics classrooms.
Table 3. Descriptive statistics for monitoring strategies
N M S D
1. My teacher encourages me to reflect on how I can improve my
assignments 1000 3.09 1.22
2. After examining my test results, my teacher discusses the answers I gave
to the test with me 1000 2.56 1.42
3. While working on my assignments, my teacher asks me how I think I am
doing. 1000 2.01 1.39
4. My teachers allow me to think about what I want to learn in school 1000 1.89 1.55 5. My teacher allows me to decide on my learning objectives 1000 1.94 1.55 6. My teachers inquire what went well and what went badly in my work 1000 2.73 1.33 7. My teacher encourages me to reflect on my learning process and to think
about how to improve next time 1000 3.11 1.20
8. My teacher stresses my strengths concerning learning 1000 2.21 1.50 9. My teacher identifies my weaknesses concerning learning 1000 2.30 1.46 10. I am encouraged by my teacher to improve my learning process 1000 3.12 1.17 11. My teacher gives me guidance to assist my learning 1000 2.84 1.33 12. My teacher discusses assignments with me to help me understand the
subject matter better 1000 2.55 1.41
13. My teacher discusses with me the progress I make 1000 1.99 1.42 14. After each assessment, my teacher informs me how to improve the next
time 1000 2.52 1.38
15. My teacher discusses with me how to exploit my strengths to improve my
assignment 1000 2.32 1.44
16. My teacher and I consider ways to improve my weak points 1000 2.49 1.43 Scaffolding Strategies
Descriptive statistics for scaffolding strategies ranged from low (M=2.14; SD=1.39) to average with item 26 registering the lowest mean (M=2.14; SD=1.39) and item 28 the highest mean (M=3.29; SD=1.13). The students had a moderate agreement on items 21, 22, 25, and 28 (mean above 3.0). The analysis implies that on average, mathematics teachers use scaffolding strategies that involve questioning whereby students can participate and reflect on their strengths and weaknesses. It seems that although the questioning strategy was used, the questions were directed to the teachers but not peers as reflected in the low perception on item 23 (M=2.20; SD=1.51). Although the perceptions of students regarding scaffolding strategies seem to be moderate (M=2.81; SD=.73), strategies regarding learning criteria (item 26) and peer assessment (item 26) are rarely used by mathematics teachers. Table 4 shows the descriptive statistics for scaffolding strategies.
Table 4. Descriptive statistics for scaffolding strategies
N M SD
17. When I do not understand a topic, my teacher tries to explain it in a
different way 1000 2.85 1.32
18. My teacher provides me with hints to help me understand the subject
matter 1000 2.75 1.36
19. During class, I have an opportunity to show what I have learned 1000 2.56 1.38 20. My teacher asks questions in a way I understand 1000 2.98 1.25 21. My teacher asks questions that help me gain an understanding of the
subject matter 1000 3.03 1.25
22. My teacher allows for my contribution during the lesson 1000 3.04 1.25 23. I have the opportunity to ask my classmates questions during the lesson 1000 2.20 1.51
24. My teacher makes me aware of the areas I need to work on to improve my
results 1000 2.71 1.34
25. There is an opportunity to ask questions during the lesson 1000 3.26 1.19 26. I am aware of the criteria by which my assignments will be evaluated 1000 2.14 1.39 27. When I receive an assignment it is clear to me what I can learn from it 1000 2.97 1.18 28. My assignments allow me to show what I am capable of 1000 3.29 1.13 Perceptions Based on Gender
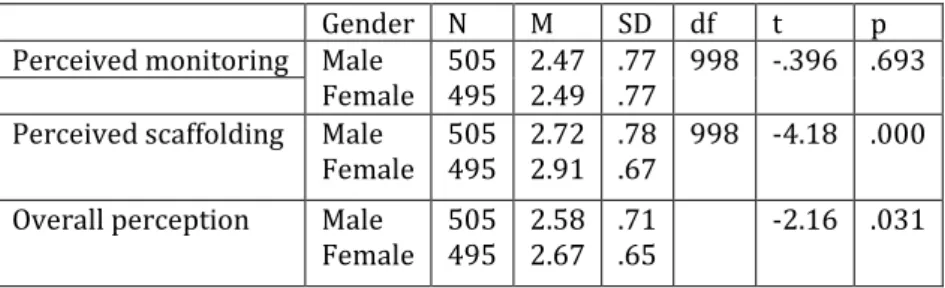
As reflected in table 5, female students had a higher overall perception (M=2.67) of their mathematics teachers’ use of formative assessment as compared to the male students (M=2.58). Regarding monitoring and scaffolding strategies, female students also had a slightly higher mean as compared to their counterparts. There was no significant difference in the perceptions of male and female students regarding perceived monitoring strategies [t (998) =-.396, p=.693]. There was however a significant difference between male and female students regarding the scaffolding strategies [t (998) =-4.18, p<.001].
The results imply that male students feel more the use of scaffolding strategies by their teachers as compared to female students.
Table 5. Descriptive statistics by gender
Gender N M SD df t p
Perceived monitoring Male
Female 505 495 2.47
2.49 .77
.77 998 -.396 .693 Perceived scaffolding Male
Female 505 495 2.72
2.91 .78
.67 998 -4.18 .000 Overall perception Male
Female 505 495 2.58
2.67 .71
.65 -2.16 .031
Perceptions Based on School Category
Descriptive statistics showed that the national boys’ school category had the highest perception of formative assessment (M=2.84; SD=.72) and the national girls’ school had the least perception (M=2.32;
SD=.72). Girls’ schools in the county category had a higher mean (M=2.71; SD=.63) as compared to county boys’ schools (M=2.52; SD=.70). Students in the county mixed schools had a higher perception (M=2.83;
SD=.64) as compared to students in the county boys’ and girls’ schools. Sub-county girls’ schools had a higher mean (M=2.66; SD=.64) as compared to sub-county boys’ and sub-county mixed schools. Students in the county mixed schools and national boys ‘schools have slightly higher perceptions of formative assessment as compared to other categories. This implies that students in mixed schools and national boys’ schools feel slightly more the use of monitoring and scaffolding strategies as compared to students in the other school categories. The analysis also shows that students had a higher mean for scaffolding strategies as compared to monitoring strategies in all school categories (see Table 6).
Table 6. Descriptive statistics by school category
School category N Monitoring M(SD) Scaffolding M(SD) Overall M(SD)
National boys 55 2.60(.80) 3.16(.73) 2.84(.72)
National girls 55 1.96(.85) 2.80(.67) 2.32(.72)
County boys 223 2.40(.77) 2.69(.77) 2.52(.70)
County girls 231 2.47(.76) 3.02(.63) 2.71(.63)
County mixed 71 2.75(.69) 2.93(.68) 2.83(.64)
Sub county boys’ 53 2.38(0.84) 2.60(.77) 2.48(.76) Sub county girls 55 2.63(.63) 2.70(.77) 2.66(.64) Sub-county mixed 257 2.56(.73) 2.69(.63) 2.62(.67)
Total 1000 2.48(.770 2.81(.73) 2.62(.68)
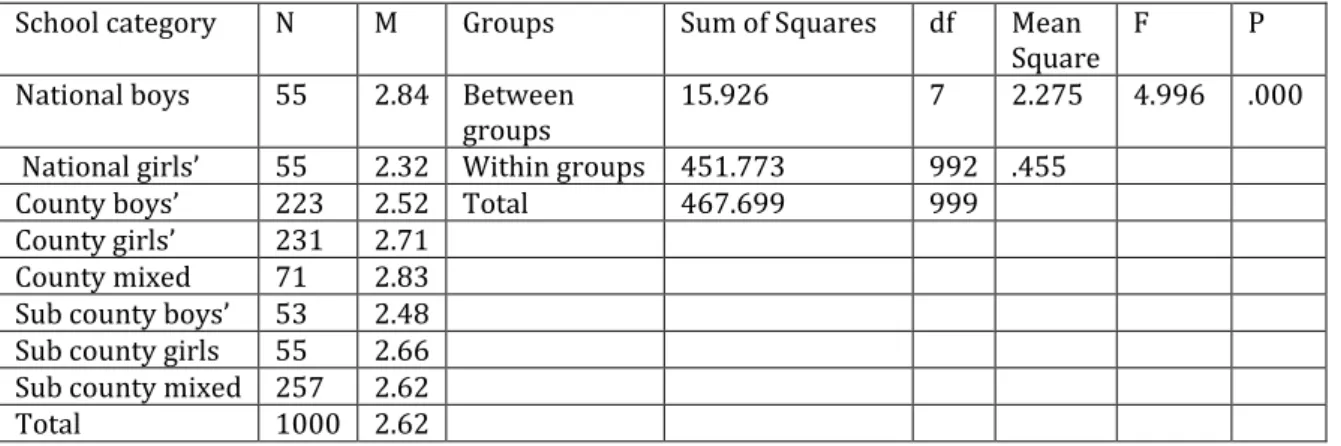
Analysis of variance showed a significant effect of the school category on students’ perception of formative assessment [F (7, 992) =4.996, p<.001] as reflected in table 7.
Table 7. ANOVA results of overall perception by school category
School category N M Groups Sum of Squares df Mean
Square F P National boys 55 2.84 Between
groups 15.926 7 2.275 4.996 .000
National girls’ 55 2.32 Within groups 451.773 992 .455
County boys’ 223 2.52 Total 467.699 999
County girls’ 231 2.71 County mixed 71 2.83 Sub county boys’ 53 2.48 Sub county girls 55 2.66 Sub county mixed 257 2.62
Total 1000 2.62
A post hoc analysis using Tukey HSD test revealed substantial differences in the means of national boys and girls schools (d=0.53, p=.005); national girls’ and county girls’ schools (d=0.39, p=.01);
national girls and county mixed schools (d=0.51, p=.002); and county boys and county mixed schools (d=0.30, p=.023). Table 8 shows part of the results from the multiple comparisons with considerable mean differences.
Table 8. Post hoc test results
School category School category Mean difference(d) SE p National boys’ National girls’ .52792* .13690 .005 National girls’ County girls’ -.39152* .10508 .010 National girls County mixed -.51291* .12266 .002 County boys’ County mixed -.30473* .08906 .023
*. The mean difference is significant at the 0.05 level.
DISCUSSION AND CONCLUSIONS
This study first examined the suitability of SAFL-Q in the Kenyan context and used it to measure the secondary school students’ perceptions of formative assessment in mathematics classrooms. Though the questionnaire had already been validated in Netherlands secondary schools (Pat-El et al., 2013), it was necessary to examine its suitability in the Kenyan context. Formative assessment has not gained much attention in Kenyan schools especially in secondary schools which are still dominated by summative assessment (Ngware et al., 2014). This study aimed to fill the gap in the Kenyan context and to a larger extent contribute to the limited literature regarding students’ perceptions of formative assessment.
Confirmatory factor analysis (N = 1000) results of the two-factor model (perceived monitoring and perceived scaffolding) resulted in an acceptable statistical fit for the Kenyan sample. The results showed that the questionnaire was fit to measure Kenyan secondary school students’ perceptions of monitoring and scaffolding strategies. There is however need to replicate the study involving students across different grades since this study only focused on grade 11 students.
Descriptive statistics showed that students had a generally low to a moderate perception of their mathematics teachers’ use of formative assessment. The perceptions for monitoring strategies were slightly lower than the scaffolding strategies. When a teacher uses monitoring strategies, students can identify their strengths and weakness in the learning process (Pat-El et al., 2013). The results revealed the lowest mean for monitoring strategies like learning intentions (items 4 and 5). Learning intentions as described by Black & Wiliam (2009) help the learner to identify the learning gap between the current state and the desired end. The use of scaffolding strategies encourages deeper learning where a student can construct his/her learning and hence engage in lifelong learning. Although the perception for scaffolding strategies was average, specific aspects like self-assessment, peer assessment, and assessment criteria seem to be rarely used in mathematics classrooms. Learners’ knowledge of assessment criteria for their work is an important motivating factor and helps them in understanding how to fill the achievement gap (Black & Wiliam, 2009). A study by Crichton & McDaid (2016) also revealed that teachers rarely use strategies like learning intentions and assessment criteria in classrooms. This analysis has shown areas of weaknesses that teachers need to concentrate on to get the maximum benefits of formative assessment.
Analysis of perceptions by gender revealed that female students had a higher perception as compared to male students. No significant difference in the perceptions of students regarding perceived monitoring strategies but a significant difference in favor of female students were found regarding scaffolding strategies. Analysis of variance based on the school category showed a significant difference among the school categories. The post hoc analysis showed significant differences between national boys’
and girls’ schools; national girls and county girls school; national girls and mixed schools; and county boys and mixed schools. The largest difference was between national boys’ and national girls’ schools (d=0.53, p=.005). This was a very interesting finding since both national boys’ and girls’ school categories have similar characteristics in terms of learning environment and performance. These results seem to suggest that the students' perceptions of formative assessment are mediated by other factors possibly related to students’ motivation, achievement, or teacher efficacy. A study by Pat-El, et al. (2015) showed that differences in perceptions can be influenced by factors such as teacher efficacy and student language proficiency.
This study has revealed that background factors such as gender and school category play a role in students’ perceptions of monitoring and scaffolding strategies. This study has pointed out areas that mathematics teachers need to improve to effectively use formative assessment in mathematics classrooms. Specifically, there is a need for teachers to make use of strategies like learning intentions, feedback, peer assessment, and assessment criteria. Interventions on the teachers’ use of monitoring and scaffolding strategies will be necessary so that students can develop more skills to regulate their learning.
This is a timely study especially to the Kenyan curriculum developers as they plan to conduct in-service training to secondary school teachers in preparation for the new competency-based curriculum.
REFERENCES
Alkharusi, H., et al. (2014). Classroom assessment: Teacher practices, student perceptions, and academic self-efficacy beliefs. Social Behavior and Personality: An International Journal, 42, 835-855.
https://doi.org/10.2224/sbp.2014.42.5.835
Alkharusi, H.A, & Al-Hosni, S. (2015). Perceptions of Classroom Assessment Tasks: An Interplay of Gender, Subject Area, and Grade Level. Cypriot Journal of Educational Sciences, 10, 205-217.
http://dx.doi.org/10.14204/ejrep.40.15177
Andersson, C., & Palm, T. (2017). The impact of formative assessment on student achievement: A study of the effects of changes in classroom practice after a comprehensive professional development
program. Learning and Instruction, 49, 92-102.
https://doi.org/10.1016/j.learninstruc.2016.12.006
Andrade, H., & Du, Y. (2007). Student responses to criteria-referenced self-Assessment.
Assessment and Evaluation in Higher Education, 32 (2), 159–181.
https://doi.org/10.1080/02602930600801928
Assessment Reform Group (2002). Assessment for learning. http://arrts.gtcni.org.uk/gtcni/
handle/2428/4617
Baas, D., et al. (2014). The relation between Assessment for Learning and elementary students’ cognitive and metacognitive strategy use. British Journal of Educational Psychology, 85, 36–46.
https://doi.org/10.1111/bjep.12058
Black, P. & William, D. (1998). Assessment and classroom learning.assessment in
education, principles, policy, and practice 5, 7 –68. https://doi.org/10.1080/0969595980050102 Black, P., & Wiliam, D. (2009). Developing the theory of formative assessment. Educ Asse
Eval Acc: DOI 10.1007/s11092-008-9068-5
Brown, G. T., & Hirschfeld, G. H. (2008). Students’ conceptions of assessment: Links to outcomes. Assessment in Education: Principles, Policy & Practice, 15, 3-17.
https://doi.org/10.1080/09695940701876003
Clark, I. (2012). Formative assessment: assessment is for self-regulated learning. Educ Psycho Rev 24, 205–249. DOI: 10.1007/s10648-011-9191-6
Crichton, H., & McDaid, A. (2016). Learning intentions and success criteria: learners' and teachers' views. The Curriculum Journal, 27, 190-203.
https://doi.org/10.1080/09585176.2015.1103278
DeLuca, C., et al. (2018). Student perspectives on assessment for learning. The Curriculum Journal, 29, 77- 94. https://doi.org/10.1080/09585176.2017.1401550
Demetriou, A., et al. (2011). Educating the developing mind: Towards an overarching paradigm. Educational Psychology Review, 23, 601-663.
https://doi.org/10.1007/s10648-011-9178-3
Deutsch, T., et al. (2012). Implementing computer-based assessment – A web-based mock examination changes attitudes. Computers & Education, 58 (4), 1068-1075.
https://doi.org/10.1016/j.compedu.2011.11.013
Gao, M. (2012). Classroom assessments in mathematics: High school students' perceptions. International Journal of Business and Social Science, 3, 63- 68
Gipps, C., Hargreaves, E., & McCallum, B. (2015). What makes a good primary school teacher?: Expert classroom strategies. Routledge.
Hattie, J. (2008). Visible learning: A synthesis of over 800 meta-analyses relating to achievement. New York: Routledge.
Ho, R. (2006). Handbook of univariate and multivariate data analysis and interpretation with SPSS. Gipps, C., Hargreaves, E., & McCallum, B. (2015). What makes a good primary school teacher?: Expert classroom strategies. Routledge.
Hargreaves E, McCallum B (2015). What makes a good primary school teacher? Expert classroom strategies. London: Routledge.
KCSE (2019). Analysis: Best performed subjects https://www.tuko.co.ke/331473-kcse-2019-analysis- best-performed-subjects.html (accessed on January 22, 2020)
KICD. (2017). Republic of Kenya: Basic Education Curriculum Framework. Republic of Kenya, KICD.
Kenya National Bureau of Statistics (2019). Population by County and Sub County: Kenya Population and Housing Census Volume 1. Retrieved 6 December 2019 from http://www.knbs.or.ke
KNEC. (2017). Kenya National Examination Council, Newsletter, Nairobi, Government printer
Kyaruzi, F., et al. (2019). Students’ formative assessment perceptions, feedback use, and mathematics performance in secondary schools in Tanzania. Assessment in Education: Principles, Policy &
Practice, 1-25. https://doi.org/10.1080/0969594X.2019.1593103
Kyaruzi, F., et al. (2018). Teacher AfL perceptions and feedback practices in mathematics education among secondary schools in Tanzania. Studies in Educational Evaluation, 59, 1-9
Nasr, M., et al. (2018). Iranian EFL teachers’ perceptions of assessment for learning regarding monitoring and scaffolding practices as a function of their demographics. Cogent Education, 5(1), 1558916.
DOI: 10.1080/2331186X.2018.1558916
Ngware, M. W., et al. (2014). Does teaching style explain differences in
learner achievement in low and high performing schools in Kenya?. International Journal of Educational Development, 36, 3-12
Nicol, J. D., and Macfarlane-Dick, D. (2005). Formative assessment and self-regulated learning: A model and seven principles of good feedback practice; Studies in Higher Education 31, 199–218.
https://doi.org/10.1080/03075070600572090
Ozan, C., & Kincal, R.Y (2018). The Effects of Formative Assessment on Academic Achievement, Attitudes toward the Lesson, and Self-Regulation Skills. Educational Sciences: Theory and Practice, 18, 85- 118. https://doi.org/10.12738/estp.2018.1.0216
Öz, H. (2014). Turkish Teachers' Practice of Assessment for Learning in English as a Foreign Language Classroom. Journal of Language Teaching & Research, 5, 775-785
Pat-El, R. J., et al. (2013). Validation of assessment for learning questionnaires for teachers and students.
British Journal of Educational Psychology, 83, 98–113. DOI:10.1111/j.2044-8279.2011.02057.
Pat-El, R. J., et al. (2015). Multilevel predictors of differing perceptions of assessment for learning practices between teachers and students. Assessment in Education: Principles, Policy & Practice, 22, 282–298. https://doi.org/10.1080/0969594X.2014.975675
Popham, W.J. (2008). Transformative Assessment. VA: ASCD.
Republic of Kenya (2010). The Constitution of Kenya. Nairobi: Government Printer.
Sadler, D.R. (2009) 'Indeterminacy in the use of preset criteria for assessment and grading in
higher education', Assessment and Evaluation in Higher Education, 34, 159–79.
https://doi.org/10.1080/02602930801956059
Schumacker, R. E., and Lomax, R. G. (2004). A beginner's guide to structural equation modeling, Second edition. Mahwah, NJ: Lawrence Erlbaum Associates.
Swaffield, S. (2011) Getting to the heart of authentic Assessment for Learning, Assessment in Education.
Principles, Policy & Practice, 18, 433–449. https://doi.org/10.1080/0969594X.2011.582838 Teo, T. (2013). Examining the Psychometric Properties of the Epistemic Belief Inventory (EBI). Journal of
Psychoeducational Assessment, 31, 72–79.
https://doi.org/10.1177/0 734282912449436
Third Assessment for Learning Conference Participants (2009). Third International Conference on Assessment for Learning. March 15–20 in Dunedin, New Zealand
Vattøy, K. D., & Smith, K. (2019). Students 'perceptions of teachers' feedback practice in teaching English as a foreign language. Teaching and Teacher Education, 85, 260-268.
https://doi.org/10.1016/j.tate.2019.06.024
Vrugt, A., & Oort, F. J. (2008). Metacognition, achievement goals, study strategies, and academic achievement: pathways to achievement. Metacognition and learning, 3, 123-146 https://doi.org/10.1007/s11409-008-9022-4
Wafubwa, N. R., & Obuba, E. (2015) Influence of Strengthening Mathematics and Science in Secondary Education (SMASSE) in Service Education and Training (INSET) on the Attitude of Students towards Mathematics Performance in Public Secondary Schools of Rangwe Division, Homa-Bay SubCounty-Kenya. Journal of Education and Practice, 6,57-61
Wiliam, D. (2011). Embedded formative assessment. Bloomington, IN Solution Tree Press.
https://www.bookdepository.com/Embedded-Formative-Assessment...Wiliam/978193