R E S E A R C H Open Access
Increased plasma neurofilament light chain concentration correlates with severity of post-mortem neurofibrillary tangle
pathology and neurodegeneration
Nicholas J. Ashton1,2,3,4, Antoine Leuzy1,2, Yau Mun Lim3,4, Claire Troakes3,4, Tibor Hortobágyi3,5, Kina Höglund1, Dag Aarsland3,4,6, Simon Lovestone7, Michael Schöll1,8,9, Kaj Blennow1,10, Henrik Zetterberg1,10,11,12and
Abdul Hye3,4*
Abstract
Alzheimer’s disease (AD) is pathologically characterized by the accumulation of amyloid-β(Aβ) plaques,
neurofibrillary tangles and widespread neuronal loss in the brain. In recent years, blood biomarkers have emerged as a realistic prospect to highlight accumulating pathology for secondary prevention trials. Neurofilament light chain (NfL), a marker of axonal degeneration, is robustly elevated in the blood of many neurological and
neurodegenerative conditions, including AD. A strong relationship with cerebrospinal fluid (CSF) NfL suggests that these biomarker modalities reflect the same pathological process. Yet, the connection between blood NfL and brain tissue pathology has not been directly compared. In this study, longitudinal plasma NfL from cognitively healthy controls (n= 12) and AD participants (n= 57) were quantified by the Simoa platform. On reachingpost-mortem, neuropathological assessment was performed on all participants, with additional frozen and paraffin-embedded tissue acquired from 26 participants for further biochemical (Aβ1–42, Aβ1–40, tau) and histological (NfL) evaluation.
Plasma NfL concentrations were significantly increased in AD and correlated with cognitive decline, independent of age. Retrospective stratification based on Braak staging revealed that baseline plasma NfL concentrations were associated with higher neurofibrillary tangle pathology atpost-mortem. Longitudinal increases in plasma NfL were observed in all Braak groupings; a significant negative association, however, was found between plasma NfL at time point 1 and both its rate of change and annual percentage increase. Immunohistochemical evaluation of NfL in the medial temporal gyrus (MTG) demonstrated an inverse relationship between Braak stages and NfL staining.
Importantly, a significant negative correlation was found between the plasma NfL measurement closest to death and the level of NfL staining in the MTG atpost-mortem. For the first time, we demonstrate that plasma NfL associates with the severity of neurofibrillary tangle pathology and neurodegeneration in thepost-mortembrain.
Keywords:Neurofilament light chain, Blood biomarkers, Braak, Tau, Post-mortem
* Correspondence:abdul.1.hye@kcl.ac.uk
3King’s College London, Institute of Psychiatry, Psychology & Neuroscience, Maurice Wohl Clinical Neuroscience Institute, London, UK
4NIHR Biomedical Research Centre for Mental Health & Biomedical Research Unit for Dementia at South London & Maudsley NHS Foundation, London, UK
Full list of author information is available at the end of the article
© The Author(s). 2019Open AccessThis article is distributed under the terms of the Creative Commons Attribution 4.0 International License (http://creativecommons.org/licenses/by/4.0/), which permits unrestricted use, distribution, and reproduction in any medium, provided you give appropriate credit to the original author(s) and the source, provide a link to the Creative Commons license, and indicate if changes were made. The Creative Commons Public Domain Dedication waiver (http://creativecommons.org/publicdomain/zero/1.0/) applies to the data made available in this article, unless otherwise stated.
Introduction
In recent years, there has been an increasing emphasis on developing a blood biomarker (plasma or serum) to predict the clinical onset of Alzheimer’s disease (AD) or to identify the underlying pathophysiology at its earliest stage. A blood-based measure has substantial practical and economic advantages over the most well-established AD biomarkers. Structural imaging (MRI) and positron emission tomography (PET) techniques using18F-fluoro- deoxyglucose, amyloid tracers, and, more recently, tau ligands are costly, and access is limited to specialised centres. On the other hand, cerebrospinal fluid (CSF) sampling is becoming routine in neurology clinics and the cost for the core AD CSF immunological assays (Aβ1–42, phosphorylated tau [P-tau] and total tau [T-tau]) are much lower per patient than for PET scans.
Yet, there remains a level of perceived invasiveness or complexity attached to a lumbar puncture in many countries. Therefore, a blood-based marker would com- plement CSF and molecular imaging biomarkers as a simplified initial triage step in a multi-stage assessment for early diagnosis, secondary prevention trial participant selection or monitoring of response to intervention over time (for review see, (Lewczuk et al.2017)).
It has proven challenging to establish a robust blood biomarker for AD. Candidate proteins are influenced by peripheral expression from extra-cerebral tissues and the measurements are confounded by matrix effects from plasma proteins (Zetterberg2015). More recently, ultra- sensitive immunological assays (Single Molecule Array) and mass spectrometric studies have overcome these complications and recently reported plasma amyloid-beta peptide ratios (Aβ1–42/Aβ1–40and APP699–711/Aβ1–42) that can identify cerebral amyloidosis with high accuracy (Jane- lidze et al. 2016; Nakamura et al. 2018). Furthermore, using the Simoa platform, plasma T-tau has been shown to be consistently elevated in AD (Mattsson et al. 2016) and to correlate with cognitive decline (Mielke et al.
2017). However, there are large overlaps in concentrations between clinical groups, with a poor association with CSF T-tau (Mattsson et al. 2016; Zetterberg et al. 2013). One promising avenue for AD is the neuroaxonal injury marker neurofilament light (NfL). Patients with AD have increased NfL concentrations in the CSF (Sjogren et al.
2000) and this is also reflected in the blood despite being more than 50-fold lower in concentration (Gisslen et al.
2016; Lewczuk et al. 2018). Increases in blood NfL have also been described in frontotemporal dementia (Rohrer et al. 2016), Huntington’s disease (Byrne et al.2017) and atypical parkinsonian disorders (Hansson et al. 2017), making blood NfL a global marker of neurodegeneration rather than a disease-specific biomarker per se. Intri- guingly, plasma NfL correlates highly with CSF NfL in the same individuals (correlation coefficients > 0.75 (Zetterberg
and Blennow 2018)), further supporting the notion that plasma NfL indeed reflects central nervous system damage and could be used as a proxy measure for CSF NfL. How- ever, at this time, no evidence has been gathered to suggest if blood NfL reflects the degree of neuropathology at post-mortem.
In this study, we sought to investigate this relationship by measuring longitudinal plasma NfL concentrations in cognitively unimpaired elderly controls (CTL) and pa- tients with a clinical diagnosis of probable AD. For all participants, Braak staging of tau pathology was per- formed at post-mortem. Biochemical measures of brain Aβ(Aβ1–42, Aβ1–40 and Aβ1–42/ Aβ1–40) and tau (P-tau and T-tau), as well as immunohistochemical assessment of NfL, were performed in a subset.
Materials and methods Study participants
The current study is comprised of two cohorts; the Alz- heimer Research Trust (ART) cohort and the dementia case register (DCR). The details regarding the process of recruitment and clinical diagnosis have been previously described (Hye et al. 2006,2014). In brief, the diagnosis of probable AD was made according to Diagnostic and Statistical Manual for Mental Diagnosis, fourth edition and National Institute of Neurological, Communicative Disorders and Stroke–Alzheimer’s disease and Related Disorders Association (NINCDS-ADRDA) clinical cri- teria. Standardized clinical assessments included the informant interview for diagnosis and the Mini-Mental State Examination (MMSE). CTL subjects were either spouses of cases or recruited though primary care age- sex registers; all had MMSE > 26. The APOE single nucleotide polymorphisms (SNPs) rs429358 and rs7412 were genotyped using Taqman SNP genotyping assays (determined by allelic discrimination assays based on fluorogenic 5′ nuclease activity) and the allele inferred.
The human biological samples were sourced ethically, and their research use was in accordance with the terms of the informed consent. To be included in the present study, participants must have completed one or more blood draws throughout life and have reached post-mor- temwith a pathological assessment at the MRC London Neurodegenerative Diseases Brain Bank. We included 72 participants meeting such criteria (Table 1). Consent for autopsy, neuropathological assessment and research was obtained for all cases and the study was carried out under the ethical approval of the tissue bank. Block taking and neuropathological assessment was performed accord- ing to standard criteria (for more detail see (Skogseth et al.2017)). This included assessment for vascular lesions, TAR DNA-binding protein 43 (TDP-43), and Lewy body pathology. Using these individual scores, a cumulative co-pathology burden score was generated for each subject
(Additional file1: Table S1). Furthermore, frozen brain tis- sue (20 mg, medial temporal gyrus [MTG]) was obtained for further biomarker characterization.
Plasma NfL
At the time of assessment, approximately 10 mL venous blood was collected in glass tubes containing sodium ethyl- enediaminetetraacetic acid (EDTA) from each subject. Par- ticipants were required to fast for at least 2 h prior to collection. The blood samples were centrifuged at 2000 x g at 4 °C for 8 min within approximately 2 h of collection.
Plasma supernatant was collected, divided into aliquots, and frozen at−80 °C until further use. Plasma NfL concen- tration was measured using the Simoa platform (NF-light;
Quanterix, Lexington, MA) at the Maurice Wohl Clinical Neuroscience Institute, London, UK. Samples were ran- domized, blinded and measured in duplicate using a batch of reagents from the same lot. The intra-assay and inter-assay coefficients of variance were 8.1 and 11.2% re- spectively. The limit of detection (LOD) was 0.52 pg/mL and the lower limit of quantification (LLOQ) was 3.26 pg/
mL when compensated for a 4-fold sample dilution.
Brain tissue homogenization and biochemical measures (Aβ1–42,Aβ1–40,P-tau and T-tau)
Frozen post-mortem tissue (20 mg) from the MTG and subjacent white matter representing Brodmann area 22 (BA22) was obtained for 26 participants with serial plasma measures. Each sample was homogenized in 10%
(w/v) Tris-buffered saline (TBS + protease inhibitors, cOmplete™, Roche) and sonicated for 1 min using a son- icating probe at 4 °C. The tissue lysate underwent ultra-centrifugation at 100,000 x g for 1 h (4 °C) and the supernatant was collected (TBS fraction [T]). Two % (w/
v) sodium dodecyl sulfate (SDS) was added to the remaining pellet that was sonicated further for 1 min at
4 °C and centrifuged at 25,000 g for 1 h (4 °C). The supernatant was collected as the SDS fraction [S]. Lastly, 70% (w/v) formic acid was added to the remaining pellet, sonicated and spun under the same conditions as the SDS fraction. Subsequently, the supernatant was col- lected and neutralized at 1:20 with 1 M Tris for im- munoassay analysis (formic acid fraction [F]). Tissue homogenates (T, S and F) were analysed for Aβ1–42,
Aβ1–40, P-tau and T-tau by the human Luminex 4-plex xMAP assay (Millipore; HNABTMAG-68 K) at the Maur- ice Wohl Clinical Neuroscience Institute, London, UK.
Briefly, both fractions T and S were diluted 1:2 and frac- tion F was undiluted (post pH neutralization at 1:20). Me- dian fluorescent intensity (MFI) was measured using the Luminex 200 using Xponent 3.1 software. Both raw ab- sorbance and MFI was exported to Sigma plot (ver13;
Systat software) for estimation of protein concentration using a five-parameter logistic fit. The intra- and inter-assay coefficients of variance for Aβ1–40 (8.2% &
16%), Aβ1–42(6.1% & 16%), P-tau (6.7% & 7%) and T-tau (9.1% & 14%) respectively. Each individual fraction and the sum of all fractions were used for further statistical analysis.
NfL immunohistochemistry & microscopy
Sevenμm thick formalin-fixed paraffin-embedded MTG sections were deparaffinised with xylene and rehydrated in a graded series of industrial methylated spirit (IMS;
100, 95, 70%). Endogenous peroxidase was quenched with 0.7% v/v hydrogen peroxide in methanol. Heat- induced epitope retrieval (HIER) was performed with citric acid-based antigen unmasking solution (Vector La- boratories). Sections were blocked with 10%v/v normal goat serum (Vector Laboratories, S-1000) in Tris-buff- ered saline (TBS) with 0.25% v/v Triton X-100 (TBS-Tx 0.25%). Mouse anti-NfL chain (clone DA2; 1:200 Table 1Demographic, clinical (time point 1, 2 & 3) andpost-mortemcharacteristics
CTL AD
Time point 1 2 3 1 2 3
No. 15 12 4 57 57 32
Age, years 86 [79, 87] 88 [83, 90] 90 [89, 95] 83 [77, 88] 84 [78, 89] 87 [79, 89]
Gender, M/F 6/9 7/5 3/1 22/35 22/35 11/21
MMSE 29 [28.5, 30] 29 [28, 30] 29 [28, 29.3] 17 [9, 22] 14 [6, 20] 8 [4, 15]
APOE,ε4 carriers 5/14 (36%) 5/12 (42%) 2/4 (50%) 33/54 (61%) 33/54 (61%) 19/32 (59%)
NfL, pg/mL 29 [23, 34.5] 33 [29.3, 47] 39.3 [33, 45] 42 [33, 57] 48.3 [32, 67] 65 [47.3, 87]
Time topost-mortem, years 7 [3, 8] 7 [4, 8] 6.5 [6, 8] 4 [3, 6] 3 [2, 5] 2 [1, 3]
Braak staging Transentorhinal (I/II) 8 7 3 2 2 0
Limbic (III/IV) 4 3 0 11 11 4
Isocortical (V/VI) 3 2 1 44 44 28
MMSE was found to be lower among CTL subjects, as compared to AD, across all three time points (p< 0.001)
Plasma NfL was higher among AD subjects, relative to controls, at time point 1 (p< 0.01) and at both second and third time points (p< 0.05)
dilution; Thermo Fisher Scientific, MA1–2010) with 1%
v/v blocking serum in TBS with 0.1% v/v Triton X-100 (TBS-Tx 0.1%) was incubated with sections overnight at 4 °C. Biotinylated goat anti-mouse IgG (1:200 dilution;
Vector Laboratories, BA-9200) in TBS with 0.1% v/v Tween 20 (TBS-T 0.1%) was applied on the sections for 1 h at RT. Sections were visualised with VECTASTAIN Elite ABC HRP Kit (Vector Laboratories) and 3,3′-di- aminobenzidine tetrahydrochloride (DAB) Peroxidase (HRP) Substrate Kit (Vector Laboratories). Sections were counterstained in Mayer’s haematoxylin. Sections were dehydrated in increasing concentrations of IMS (70, 95, 100, 100%) and cleared with xylene. Sections were cover- slipped with DPX mountant medium. Sections were scanned using the VS120 Virtual Slide Microscope sys- tem (Olympus). The density of NfL immunostaining was measured by the percentage of positive DAB staining across the entire tissue section using Visiopharm image analysis program.
Statistical analysis
Levels of plasma NfL between groups were compared using Wilcoxon signed rank test. Plasma NfL by Braak stage was examined using one-way ANOVA on ranks,
with post-hoc Wilcoxon signed rank tests where appro- priate. Categorical variables were compared pairwise using Fischer’s exact test. Spearman’s rank-order correl- ation was used to assess the association between plasma NfL and post-mortemBraak staging, as well as the rela- tionship between plasma NfL levels and their rate of change. Linear mixed models, including random inter- cepts at the subject level, were used to assess longitudinal changes in NfL levels, with linear models used to assess the relationship between plasma NfL and MMSE and be- tween NfL and MTG immunostaining. Given the associ- ation between NfL and age, all analyses were adjusted for age atpost-mortemas well as for post-mortemdelay, the interval between plasma sampling and death, and co-pathology burden. Four AD patients were excluded from our analyses due to outlying plasma NfL values (> 3 standard deviations of the mean). Analyses were per- formed using R (v.3.3.2, R Foundation for Statistical Computing, https://www.R-project.org/), with p< 0.05 (two-tailed) used to indicate statistical significance.
Results
Demographic, clinical, and post-mortem Braak staging characteristics are summarized in Table1. No significant
Fig. 1Plasma neurofilament light chain (NfL) concentrations in healthy controls (CTL) versus Alzheimer’s disease (AD) patients at time point 1 (p< 0.001). The horizontal dashes indicate median (long) and quartiles (short)
between group differences were found for age at base- line, gender, APOE ε4 carriership, plasma storage time or in the interval to post-mortem. As expected, MMSE scores were lower in AD patients, as com- pared to CTL subjects, at both baseline and longitu- dinally (p< 0.001). Plasma NfL concentrations were significantly higher in AD, as compared to CTL sub- jects, at both time point 1 (p< 0.01, Fig. 1) and sub- sequent time points (p< 0.05).
Plasma NfL correlates with age and with poorer cognition independent of age
Across all subjects, plasma concentrations of NfL posi- tively correlated with age (rho = 0.27, p< 0.05), although the correlation coefficient was stronger in CTL partici- pants than AD participants. Due to this effect, a finding also reported in previous studies (Hansson et al. 2017;
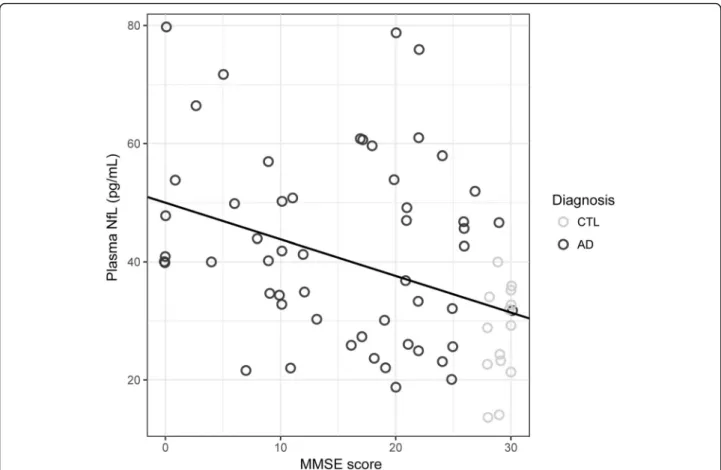
Zetterberg et al. 2016), further statistical analyses were adjusted for age. As expected, poorer MMSE scores were associated with increasingpost-mortemBraak stages across all subjects (rho =−0.61, p< 0.001); among sub-groups, statistical significance of this correlation held only among AD subjects (rho =−0.30,p< 0.05; CTL, rho =−0.33,p= 0.18). MMSE scores also showed a moderately strong in- verse correlation with plasma NfL at time point 1 (rho =−
0.49,p< 0.001; Fig.2). Time point 1 NfL was also associ- ated with cognitive decline, as evidence by correlations with MMSE at time points 2 (rho =−0.46,p< 0.001) and 3 (rho =−0.31,p< 0.05). These associations, however, were not significant at the sub-group level.
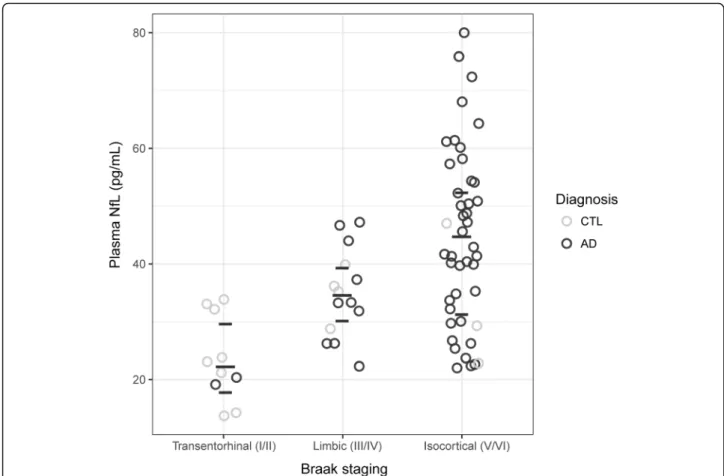
Plasma NfL is associated withpost-mortemBraak staging Using plasma NfL across all subjects at time point 1, a moderately strong correlation was observed with post-- mortem Braak stages (rho = 0.55,p< 0.001); further, NfL levels were found to significantly increase across Braak stages (isocortical (V/VI) > limbic (III/IV) > transentorh- inal (I/II);p< 0.001; Fig.3). Longitudinally, patients with higher NfL concentration displayed higher Braak staging atpost-mortem(p< 0.001).
Longitudinal increases in plasma NfL
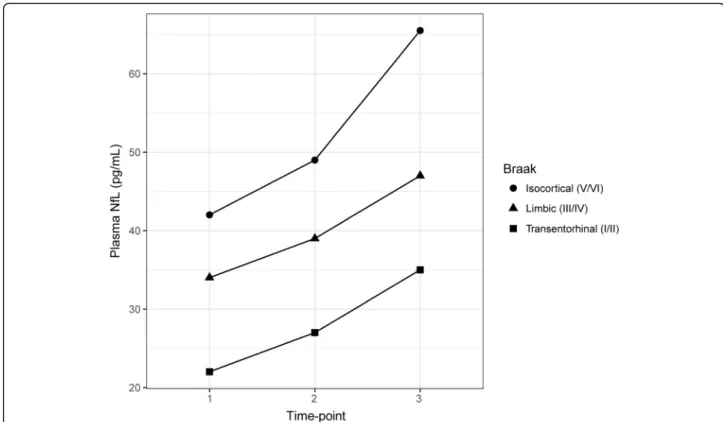
Figure 4 shows median NfL values across time points, plotted by Braak stage. Using linear mixed modelling, longitudinal increases in plasma NfL were seen across all groups (p< 0.01). A significant negative association was found, however, between plasma NfL at time point 1 and longitudinal measures (NfL rate of change; rho
=−0.46, p< 0.01) and annual percentage increase (rho =−0.42, p< 0.05). No significant differences were
Fig. 2Time point 1 plasma neurofilament light chain (NfL) concentrations in comparison to global cognition (MMSE; rho =−0.49,p< 0.001)
seen between Braak stage group for either of these longitudinal metrics.
Relationship between plasma NfL and biochemical measures of Aβand tau
MTG homogenate measures of Aβ1–40, Aβ1–42, Aβ1– 42/Aβ1–40, P-tau, and T-tau were available for 26 sub- jects: 7 controls and 19 AD. Firstly, the sum of the concentrations from fractions T, S and F were exam- ined. Aβ isoforms, alone (Aβ1–40, Aβ1–42) and in ratio (Aβ1–42/Aβ1–40) were higher and lower, respectively, in AD, as compared to controls (p< 0.001; Additional file 2: Table S2). P-tau was higher in AD, though T-tau was higher in controls (p< 0.001). Significant group differences were also seen for separate hom- ogenate fractions (T, S and F); similar to findings using the sum of fractions, Aβ and P-tau fractions were higher in AD, while T-tau fractions were higher in controls. Among plasma NfL measurements, only baseline levels significantly associated to the sum of T-tau fractions (rho =−0.45, p< 0.05) and its F frac- tion (rho =−0.42, p< 0.05).
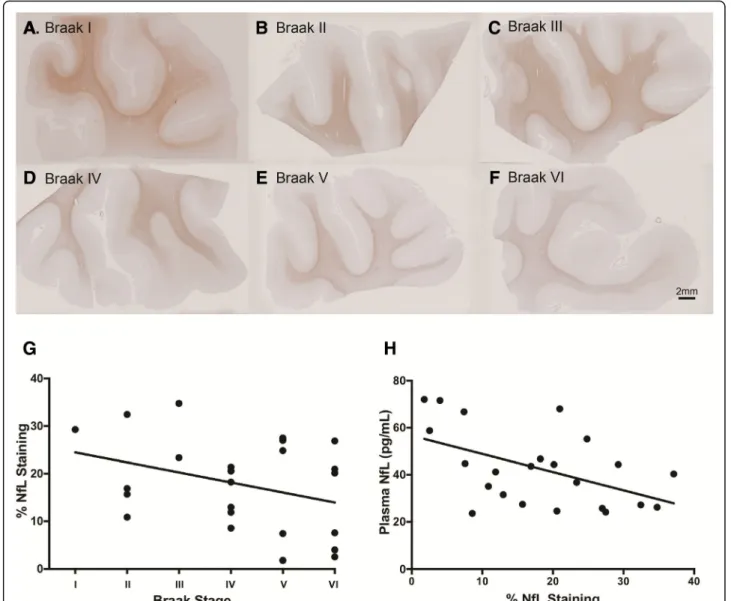
Inverse relationship between plasma NfL and immunohistochemical staining of NfL atpost-mortem Formalin-fixed paraffin-embedded MTG sections for 26 participants with longitudinal plasma NfL measures were immunohistochemically stained for NfL. Percentage of positive NfL staining (% staining) across the entire tissue section was measured using Visiopharm image analysis program. A non-significant trend of decreased % NfL staining with increased Braak staging was found (rho =
−0.34, p= 0.102; Fig. 5g). Visualised representation of decreasing % NfL staining from Braak stage I to VI are shown in Fig. 5a-f. Further, a significant association be- tween increased plasma NfL and decreased % NfL stain- ing was observed (rho =−0.47, p< 0.01; Fig. 5h). This was only true for plasma NfL concentrations measured at time point 3, however (i.e., closest to post-mortem, median interval 2 years (interquartile range: 1, 3)). No association was found for plasma NfL at time point 1 or time point 2.
Discussion
To our knowledge this is the first study investigating longitudinal measures of plasma NfL in relation to
Fig. 3Time point 1 plasma neurofilament light chain (NfL) concentrations and Braak staging at post-mortem. The horizontal dashes indicate median (long) and quartiles (short). Clinical classification was determined at plasma time point 1
post-mortem measures, including neurofibrillary tangle (NFT) burden and neurodegeneration as determined by NfL immunohistochemistry. The main findings demon- strate that plasma NfL (1) is elevated with increased se- verity of AD-related NFT pathology at post-mortem, (2) increases over time independent of tangle pathology at post-mortemand (3) is inversely associated with the de- gree of NfL immunostaining at post-mortem. We also confirm other findings previously reported; plasma NfL correlates with age (Chatterjee et al.2018; Gisslen et al.
2016; Lewczuk et al. 2018; Mattsson et al. 2017), how- ever in our study this is driven by cognitively unimpaired individuals. Independent of age, plasma NfL correlates inversely with global cognition (Chatterjee et al. 2018;
Lewczuk et al.2018; Mattsson et al.2017) and is increased in AD, despite large overlaps with other diagnostic groups (Lewczuk et al. 2018; Mattsson et al. 2017). Together, these findings support the notion that plasma NfL is a promising biomarker for neurodegeneration in AD.
There are 4 different neurofilament subunits, includ- ing NfL, neurofilament medium, neurofilament heavy and α-internexin. The neurofilaments are critical struc- tural components of the neural cytoskeleton but their interaction with mitochondria, microtubules and other proteins (Yuan et al. 2017) imply their function is far more imperative than simply axonal stability. In addition
to widespread grey matter loss, substantial white matter (WM) atrophy is also reported in AD (Delbeuck et al.
2003). These degenerated tracts are composed of large-caliber myelinated axons that are abundant in neu- rofilaments (Trojanowski et al.1986). In previous studies, CSF measures of NfL have been shown to reflect WM changes (Sjogren et al.2001; Zetterberg et al.2016). Given the strong correlation of blood and CSF NfL (Disanto et al.2017; Gaiottino et al.2013; Mattsson et al.2016) maybe it is unsurprising that we demonstrate blood NfL to reflect the state of degenerated large-caliber axons at post-mor- tem. However, this was only observed in plasma measures at the closest measure to death, and not at the first time point collection. This may suggest that this is a peripheral change in advanced dementia. Interestingly, time point 1 plasma NfL (approximately 8 years prior to death) was the highest in subjects classified as Braak V/VI at post-mor- tem, despite large group overlaps. We were also able to demonstrate that individuals classified as Braak III/IV had higher levels of plasma NfL than Braak I/II. This associ- ation remained at all subsequent time point plasma collec- tions. Moreover, our only significant finding with biochemical brain analysis of core AD biomarkers was an association was between plasma NfL and P-tau. In support of these finding, plasma and CSF NfL concentrations have been shown to correlate with CSF P-tau, the key
Fig. 4Longitudinal neurofilament light chain (NfL) concentrations by Braak stage. Circles, triangles, and squares indicate median values for isocortical (BraakV/VI), limbic (Braak III/IV) and transentorhinal (Braak I/II) stages, respectively. Significant increases were seen across all groups, between time point 1 and subsequent time points (time point 2,p< 0.01; time point 3,p< 0.001)
component of NFTs, in AD (Mattsson et al.2017; Zetter- berg et al.2016) but not in parkinsonian disorders (Hans- son et al.2017). However, it remains unclear if CSF P-tau truly reflects NFT burden, with mixed findings having been reported for P-tau181(Buerger et al.2007; Engelborghs et al.
2007; Seppala et al.2012), though a positive association has been reported for P-tau231(Buerger et al.2006).
While cross-sectional plasma NfL has been shown to predict future cognitive decline and correlate with age, as we have also confirmed, there has been little evidence to determine how plasma NfL concentrations change over-time in AD. In this study, longitudinal analysis from 69 participants demonstrates increases of NfL con- centration over time, independent of diagnosis and post-mortem Braak stage stratification. This finding is
likely due to the on-going axonal injury that is associ- ated with age-related changes. In CSF, NfL normal refer- ence ranges increase 2.5-fold between 20 years and 50 years, doubling by the age of 70 years (Yilmaz et al.
2017). Furthermore, studies in healthy ageing indicate that CSF NfL remains a predictor of hippocampal atro- phy that is independent of age and other AD biomarkers (Idland et al.2017). In this current study, negative asso- ciations were found between time point 1 plasma NfL concentrations in both its rate of change and annual per- centage increase. One might expect a slower trajectory of NfL after initial increases in groups with more severe pathology (in this study, likely to be AD) atpost-mortem, as this may well reflect a deceleration in neurodegenera- tion. Longitudinal decreases in CSF tau have also been
Fig. 5Formalin-fixed paraffin-embedded MTG sections stained for mouse anti-neurofilament light chain (clone DA2), one representative section from each Braak stage (I-VI) is displayed (a-f). The relationship between % NfL staining in the MTG and Braak staging atpost-mortem(rho =−0.34,p= 0.102) (g).
A significant negative correlation between plasma NfL time point closest to death and % NfL staining in the MTG atpost-mortem(rho =−0.47,p< 0.01 (h)
reported, possibly indicating a deceleration in neurode- generation due to substantial neuronal loss (Sutphen et al. 2018). This hypothesis has also gained support from recent stable isotope labelling kinetics (SILK) studies that track the turnover of tau in the human CNS (Sato et al. 2018). However, in this study, a slowed trajectory of plasma NfL was observed in all groups (including Braak I/II and controls) and therefore the reported aged-related reduction in CSF turnover (Reiber 1994) may be a better explanation of this finding.
In the clinical work-up of suspected neurodegenerative disease, NfL will most likely be of limited value from a differential diagnostic perspective (with the differenti- ation of typical idiopathic Parkinson's disease from atyp- ical parkinsonian disorders being one potential exception (Hansson et al. 2017)) but could instead be used to determine disease intensity, predict progression or rule out on-going neurodegeneration for cognitive complaints. Our data also suggests that plasma NfL could provide prognostic information as to the extent of NFT involvement in disease progression, which might prove important if immunotherapies targeting pathological tau in AD become available. However, the most promising application of plasma NfL is in evaluating treatment response in AD, as seen in mul- tiple sclerosis studies (Novakova et al. 2017), as re- cent animal studies using β-secretase inhibitors have shown reduction in plasma NfL (Bacioglu et al. 2016).
This study is not without limitations. Although the primary aim was to associate plasma NfL withpost-mor- tem pathology, conclusions about plasma NfL in isola- tion are based upon a smaller sample size than previous investigations. Further, given the nature of the study and cohort, cross-sectional, longitudinal and post-mortem participants had a bias toward AD participants com- pared to aged controls. AD patients were elderly, with a majority showing severe dementia, particularly at later time points. As such, our observations surrounding NfL are confined to a late portion of the AD continuum, one potentially also confounded by brain pathologies other than amyloid-β and tau (e.g., α-synuclein, TDP-43 and vascular lesions) (James et al. 2016), which have been shown to increase in prevalence with age (Schneider et al.2007) and involve brain regions not examined in this study. Though we attempted to control for this by adjusting our analyses for a cumulative measure of re- ported co-pathology, this included only selected patholo- gies. In addition, while a useful measure of global cognition, the MMSE was designed to measure cognitive deficits in patients in the mild-to-moderate stages of de- mentia, and has been found to be deficient in detecting more severe cognitive decline, tending to show floor ef- fects in patients with profound dementia (Herrmann et al.2007; Vellas et al.2005).
Conclusion
This study, for the first time, demonstrates that plasma NfL is not only reflective of CSF biomarker changes but also of NFT pathology and neurodegeneration (as deter- mined by NfL) at post-mortem. This important finding adds further, yet unique, support to the use of plasma NfL as a simple, accessible screening tool to rule out on-going neurodegeneration in primary care and for population en- richment and response monitoring in clinical trials.
Additional files
Additional file 1:Table S1.Visual assessment (present/absent) of selected co-pathologies. (DOCX 16 kb)
Additional file 2:Table S2.Biochemical measures of Aβ1-40, Aβ1-42, P- tau and T-tau (pg/mL) in MTG brain homogenate fractions (TBS [T], SDS [S] and Formic acid [F]) for both CTL and AD subjects. The total fraction is the sum of all homogenate fractions. (DOCX 15 kb)
Acknowledgments
This study represents independent research partly funded by the National Institute for Health Research (NIHR) Biomedical Research Centre at South London and Maudsley NHS Foundation Trust and King’s College London.
Tissue samples were supplied by The London Neurodegenerative Diseases Brain Bank, which receives funding from the UK Medical Research Council and as part of the Brains for Dementia Research programme, jointly funded by Alzheimer’s Research UK and the Alzheimer’s Society. The views expressed are those of the authors and not necessarily those of the NHS, the NIHR or the Department of Health. The datasets used and/or analysed during the current study available from the corresponding author on reasonable request.
NJA is funded by the Wallenburg Centre for Molecular and Translational Medicine. TH is supported by a grant from the Hungarian Brain Research Program. MS has received funding from the Knut och Alice Wallenberg Foundation (the Wallenberg Centre for Molecular and Translational Medicine), the Swedish Research Council and the Swedish Alzheimer Foundation. KB holds the Torsten Söderberg Professorship in Medicine and is supported by grants from the Swedish Research Council, the Swedish Alzheimer Foundation, and the Swedish Brain Foundation. HZ is a Wallenberg Academy Fellow supported by grants from the Swedish Research Council, the European Research Council and the UK Dementia Research Institute at UCL. AH is funded by Research Centre for Mental Health and Biomedical Research Unit for Dementia.
Authors’contributions
NJA, AL and AH created the concept and design. All authors contributed to sample selection and/or interpretation of data. Data acquisition was performed by NJA, YML and AH. NJA and AL, carried out data analysis and interpretation. NJA, AL, KB, HZ, AH drafted the manuscript and all authors revised. All authors read and approved the final manuscript.
Competing interests
KB and HZ are co-founders of Brain Biomarker Solutions in Gothenburg AB, a GU Ventures-based platform company at the University of Gothenburg. KB has served as a consultant or at advisory boards for Alzheon, Eli Lilly, Fujire- bio Europe, IBL International, Novartis and Roche Diagnostics. HZ has served at advisory boards of Eli Lilly and Roche Diagnostics and has received travel support from TEVA. SL is an employee of Johnson and Johnson.
Publisher’s Note
Springer Nature remains neutral with regard to jurisdictional claims in published maps and institutional affiliations.
Author details
1Department of Psychiatry and Neurochemistry, Institute of Neuroscience &
Physiology, the Sahlgrenska Academy at the University of Gothenburg,
Mölndal, Sweden.2Wallenberg Centre for Molecular and Translational Medicine, University of Gothenburg, Gothenburg, Sweden.3King’s College London, Institute of Psychiatry, Psychology & Neuroscience, Maurice Wohl Clinical Neuroscience Institute, London, UK.4NIHR Biomedical Research Centre for Mental Health & Biomedical Research Unit for Dementia at South London & Maudsley NHS Foundation, London, UK.5MTA-DE Cerebrovascular and Neurodegenerative Research Group, Department of Neurology, University of Debrecen, Debrecen, Hungary.6Centre for Age-Related Medicine, Stavanger University Hospital, Stavanger, Norway.7Department of Psychiatry, University of Oxford. Warneford Hospital, Oxford, UK.8Clinical Memory Research Unit, Department of Clinical Sciences, Malmö, Lund University, Lund, Sweden.9Department of Neurodegenerative Disease, UCL Institute of Neurology, London, UK.10Clinical Neurochemistry Laboratory, Sahlgrenska University Hospital, Mölndal, Sweden.11Department of Molecular Neuroscience, UCL Institute of Neurology, Queen Square, London, UK.12UK Dementia Research Institute at UCL|, London, UK.
Received: 11 December 2018 Accepted: 11 December 2018
References
Bacioglu M, Maia LF, Preische O, Schelle J, Apel A, Kaeser SA, Schweighauser M, Eninger T, Lambert M, Pilotto A et al (2016) Neurofilament Light Chain in Blood and CSF as Marker of Disease Progression in Mouse Models and in Neurodegenerative Diseases. Neuron 91:56–66.https://doi.org/10.1016/j.
neuron.2016.05.018
Buerger K, Alafuzoff I, Ewers M, Pirttila T, Zinkowski R, Hampel H (2007) No correlation between CSF tau protein phosphorylated at threonine 181 with neocortical neurofibrillary pathology in Alzheimer's disease. Brain 130:e82.
https://doi.org/10.1093/brain/awm140
Buerger K, Ewers M, Pirttila T, Zinkowski R, Alafuzoff I, Teipel SJ, DeBernardis J, Kerkman D, McCulloch C, Soininen H et al (2006) CSF phosphorylated tau protein correlates with neocortical neurofibrillary pathology in Alzheimer’s disease. Brain 129:3035–3041.https://doi.org/10.1093/brain/awl269 Byrne LM, Rodrigues FB, Blennow K, Durr A, Leavitt BR, Roos RAC, Scahill RI,
Tabrizi SJ, Zetterberg H, Langbehn D et al (2017) Neurofilament light protein in blood as a potential biomarker of neurodegeneration in Huntington’s disease: a retrospective cohort analysis. Lancet Neurol 16:601–609.https://
doi.org/10.1016/S1474-4422(17)30124-2
Chatterjee P, Goozee K, Sohrabi HR, Shen K, Shah T, Asih PR, Dave P, ManYan C, Taddei K, Chung R et al (2018) Association of plasma neurofilament light chain with neocortical amyloid-beta load and cognitive performance in cognitively normal elderly participants. J Alzheimers Dis 63:479–487.https://
doi.org/10.3233/JAD-180025
Delbeuck X, Van der Linden M, Collette F (2003) Alzheimer’s disease as a disconnection syndrome? Neuropsychol Rev 13:79–92
Disanto G, Barro C, Benkert P, Naegelin Y, Schadelin S, Giardiello A, Zecca C, Blennow K, Zetterberg H, Leppert D et al (2017) Serum Neurofilament light:
A biomarker of neuronal damage in multiple sclerosis. Ann Neurol 81:857– 870.https://doi.org/10.1002/ana.24954
Engelborghs S, Sleegers K, Cras P, Brouwers N, Serneels S, De Leenheir E, Martin JJ, Vanmechelen E, Van Broeckhoven C, De Deyn PP (2007) No association of CSF biomarkers with APOEepsilon4, plaque and tangle burden in definite Alzheimer’s disease. Brain 130:2320–2326.https://doi.org/10.1093/brain/awm136 Gaiottino J, Norgren N, Dobson R, Topping J, Nissim A, Malaspina A, Bestwick JP,
Monsch AU, Regeniter A, Lindberg RL et al (2013) Increased neurofilament light chain blood levels in neurodegenerative neurological diseases. PLoS One 8:e75091.https://doi.org/10.1371/journal.pone.0075091
Gisslen M, Price RW, Andreasson U, Norgren N, Nilsson S, Hagberg L, Fuchs D, Spudich S, Blennow K, Zetterberg H (2016) Plasma concentration of the Neurofilament light protein (NFL) is a biomarker of CNS injury in HIV infection: a cross-sectional study. EBioMedicine 3:135–140.https://doi.org/10.
1016/j.ebiom.2015.11.036
Hansson O, Janelidze S, Hall S, Magdalinou N, Lees AJ, Andreasson U, Norgren N, Linder J, Forsgren L, Constantinescu R et al (2017) Blood-based NfL: A biomarker for differential diagnosis of parkinsonian disorder. Neurology 88:
930–937.https://doi.org/10.1212/WNL.0000000000003680
Herrmann N, Gauthier S, Lysy PG (2007) Clinical practice guidelines for severe Alzheimer's disease. Alzheimers Dement 3:385–397.https://doi.org/10.1016/j.
jalz.2007.07.007
Hye A, Lynham S, Thambisetty M, Causevic M, Campbell J, Byers HL, Hooper C, Rijsdijk F, Tabrizi SJ, Banner S et al (2006) Proteome-based plasma biomarkers for Alzheimer’s disease. Brain 129:3042–3050.https://doi.org/10.1093/brain/awl279 Hye A, Riddoch-Contreras J, Baird AL, Ashton NJ, Bazenet C, Leung R, Westman E,
Simmons A, Dobson R, Sattlecker M et al (2014) Plasma proteins predict conversion to dementia from prodromal disease. Alzheimers Dement 10:
799–807 e792.https://doi.org/10.1016/j.jalz.2014.05.1749
Idland AV, Wyller TB, Stoen R, Dahl GT, Frihagen F, Braekhus A, Hassel B, Watne LO (2017) Cerebrospinal fluid phosphate in delirium after hip fracture.
Dement Geriatr Cogn Dis Extra 7:309–317.https://doi.org/10.1159/000478723 James BD, Wilson RS, Boyle PA, Trojanowski JQ, Bennett DA, Schneider JA (2016)
TDP-43 stage, mixed pathologies, and clinical Alzheimer’s-type dementia.
Brain 139:2983–2993.https://doi.org/10.1093/brain/aww224
Janelidze S, Stomrud E, Palmqvist S, Zetterberg H, van Westen D, Jeromin A, Song L, Hanlon D, Tan Hehir CA, Baker D et al (2016) Plasma beta-amyloid in Alzheimer’s disease and vascular disease. Sci Rep 6:26801.https://doi.org/10.
1038/srep26801
Lewczuk P, Ermann N, Andreasson U, Schultheis C, Podhorna J, Spitzer P, Maler JM, Kornhuber J, Blennow K, Zetterberg H (2018) Plasma neurofilament light as a potential biomarker of neurodegeneration in Alzheimer’s disease.
Alzheimers Res Ther 10:71.https://doi.org/10.1186/s13195-018-0404-9 Lewczuk P, Riederer P, O'Bryant SE, Verbeek MM, Dubois B, Visser PJ, Jellinger KA,
Engelborghs S, Ramirez A, Parnetti L et al (2018) Cerebrospinal fluid and blood biomarkers for neurodegenerative dementias: an update of the consensus of the task force on biological markers in psychiatry of the World Federation of Societies of Biological Psychiatry. World J Biol Psychiatry 19:
244–328.https://doi.org/10.1080/15622975.2017.1375556
Mattsson N, Andreasson U, Zetterberg H, Blennow K, Alzheimer's Disease Neuroimaging I (2017) Association of Plasma Neurofilament Light with Neurodegeneration in patients with Alzheimer Disease. JAMA Neurol 74:557– 566.https://doi.org/10.1001/jamaneurol.2016.6117
Mattsson N, Zetterberg H, Janelidze S, Insel PS, Andreasson U, Stomrud E, Palmqvist S, Baker D, Tan Hehir CA, Jeromin A et al (2016) Plasma tau in Alzheimer disease.
Neurology 87:1827–1835.https://doi.org/10.1212/WNL.0000000000003246 Mielke MM, Hagen CE, Wennberg AMV, Airey DC, Savica R, Knopman DS,
Machulda MM, Roberts RO, Jack CR Jr, Petersen RC et al (2017) Association of plasma total tau level with cognitive decline and risk of mild cognitive impairment or dementia in the mayo clinic study on aging. JAMA Neurol 74:
1073–1080.https://doi.org/10.1001/jamaneurol.2017.1359
Nakamura A, Kaneko N, Villemagne VL, Kato T, Doecke J, Dore V, Fowler C, Li QX, Martins R, Rowe C et al (2018) High performance plasma amyloid-beta biomarkers for Alzheimer’s disease. Nature 554:249–254.https://doi.org/10.1038/nature25456 Novakova L, Zetterberg H, Sundstrom P, Axelsson M, Khademi M, Gunnarsson M,
Malmestrom C, Svenningsson A, Olsson T, Piehl F et al (2017) Monitoring disease activity in multiple sclerosis using serum neurofilament light protein.
Neurology 89:2230–2237.https://doi.org/10.1212/WNL.0000000000004683 Reiber H (1994) Flow rate of cerebrospinal fluid (CSF)--a concept common to
normal blood-CSF barrier function and to dysfunction in neurological diseases. J Neurol Sci 122:189–203
Rohrer JD, Woollacott IO, Dick KM, Brotherhood E, Gordon E, Fellows A, Toombs J, Druyeh R, Cardoso MJ, Ourselin S et al (2016) Serum neurofilament light chain protein is a measure of disease intensity in frontotemporal dementia.
Neurology 87:1329–1336.https://doi.org/10.1212/WNL.0000000000003154 Sato C, Barthelemy NR, Mawuenyega KG, Patterson BW, Gordon BA, Jockel-
Balsarotti J, Sullivan M, Crisp MJ, Kasten T, Kirmess KM et al (2018) Tau Kinetics in Neurons and the Human Central Nervous System. Neuron 97:
1284–1298 e1287.https://doi.org/10.1016/j.neuron.2018.02.015
Schneider JA, Arvanitakis Z, Bang W, Bennett DA (2007) Mixed brain pathologies account for most dementia cases in community-dwelling older persons.
Neurology 69:2197–2204.https://doi.org/10.1212/01.wnl.0000271090.28148.24 Seppala TT, Nerg O, Koivisto AM, Rummukainen J, Puli L, Zetterberg H, Pyykko
OT, Helisalmi S, Alafuzoff I, Hiltunen M et al (2012) CSF biomarkers for Alzheimer disease correlate with cortical brain biopsy findings. Neurology 78:
1568–1575.https://doi.org/10.1212/WNL.0b013e3182563bd0
Sjogren M, Blomberg M, Jonsson M, Wahlund LO, Edman A, Lind K, Rosengren L, Blennow K, Wallin A (2001) Neurofilament protein in cerebrospinal fluid: a marker of white matter changes. J Neurosci Res 66:510–516.https://doi.org/
10.1002/jnr.1242
Sjogren M, Rosengren L, Minthon L, Davidsson P, Blennow K, Wallin A (2000) Cytoskeleton proteins in CSF distinguish frontotemporal dementia from AD.
Neurology 54:1960–1964
Skogseth R, Hortobagyi T, Soennesyn H, Chwiszczuk L, Ffytche D, Rongve A, Ballard C, Aarsland D (2017) Accuracy of clinical diagnosis of dementia with Lewy bodies versus neuropathology. J Alzheimers Dis 59:1139–1152.https://
doi.org/10.3233/JAD-170274
Sutphen CL, McCue L, Herries EM, Xiong C, Ladenson JH, Holtzman DM, Fagan AM, Adni (2018) Longitudinal decreases in multiple cerebrospinal fluid biomarkers of neuronal injury in symptomatic late onset Alzheimer’s disease.
Alzheimers Dement 14:869–879.https://doi.org/10.1016/j.jalz.2018.01.012 Trojanowski JQ, Walkenstein N, Lee VM (1986) Expression of neurofilament
subunits in neurons of the central and peripheral nervous system: an immunohistochemical study with monoclonal antibodies. J Neurosci 6:650–660 Vellas B, Gauthier S, Allain H, Andrieu S, Aquino JP, Berrut G, Berthel M, Blanchard F, Camus V, Dartigues JF et al (2005) Consensus statement on dementia of Alzheimer type in the severe stage. J Nutr Health Aging 9:330–338 Yilmaz A, Blennow K, Hagberg L, Nilsson S, Price RW, Schouten J, Spudich S,
Underwood J, Zetterberg H, Gisslen M (2017) Neurofilament light chain protein as a marker of neuronal injury: review of its use in HIV-1 infection and reference values for HIV-negative controls. Expert Rev Mol Diagn 17:761– 770.https://doi.org/10.1080/14737159.2017.1341313
Yuan A, Rao MV, Veeranna, Nixon RA (2017) Neurofilaments and Neurofilament proteins in health and Disease. Cold Spring Harb Perspect Biol 9.https://doi.
org/10.1101/cshperspect.a018309
Zetterberg H (2015) Plasma amyloid beta-quo vadis? Neurobiol Aging 36:2671– 2673.https://doi.org/10.1016/j.neurobiolaging.2015.07.021
Zetterberg H, Blennow K (2018) From cerebrospinal fluid to blood: the third wave of fluid biomarkers for Alzheimer's Disease. J Alzheimers Dis 64:S271– S279.https://doi.org/10.3233/JAD-179926
Zetterberg H, Skillback T, Mattsson N, Trojanowski JQ, Portelius E, Shaw LM, Weiner MW, Blennow K, Alzheimer's Disease Neuroimaging I (2016) Association of Cerebrospinal Fluid Neurofilament Light Concentration with Alzheimer Disease Progression. JAMA Neurol 73:60–67.https://doi.org/10.
1001/jamaneurol.2015.3037
Zetterberg H, Wilson D, Andreasson U, Minthon L, Blennow K, Randall J, Hansson O (2013) Plasma tau levels in Alzheimer’s disease. Alzheimers Res Ther 5:9.
https://doi.org/10.1186/alzrt163
![(Additional file 1: Table S1). Furthermore, frozen brain tis- tis-sue (20 mg, medial temporal gyrus [MTG]) was obtained for further biomarker characterization.](https://thumb-eu.123doks.com/thumbv2/9dokorg/1064009.70330/3.892.84.819.150.401/additional-table-furthermore-frozen-temporal-obtained-biomarker-characterization.webp)