Cite this article as: Bán, Z., Győri, E., Tóth, L., Gráczer, Z., Mahler, A. "Characterization and Liquefaction Hazard Assessment of Two Hungarian Liquefied Sites from the 1956 Dunaharaszti Earthquake", Periodica Polytechnica Civil Engineering, 64(3), pp. 713–721, 2020. https://doi.org/10.3311/PPci.15607
Characterization and Liquefaction Hazard Assessment of Two Hungarian Liquefied Sites from the 1956 Dunaharaszti Earthquake
Zoltán Bán1*, Erzsébet Győri2, László Tóth3, Zoltán Gráczer2, András Mahler1
1 Department of Engineering Geology and Geotechnics, Faculty of Civil Engineering, Budapest University of Technology and Economics, 1111 Budapest, Műegyetem rkp. 3., Hungary
2 CSFK GGI Kövesligethy Radó Seismological Observatory, 1112 Budapest, Meredek u. 18., Hungary
3 GeoRisk LTd., 1112 Budapest, Budaörsi u. 131/a., Hungary
* Corresponding author, e-mail: ban.zoltan@epito.bme.hu
Received: 22 January 2020, Accepted: 28 April 2020, Published online: 22 May 2020
Abstract
The seismicity of Hungary can be considered moderately active, nevertheless contemporary reports from the past approx. 350 years documented surface manifestations of liquefaction occurrences. The last such earthquake was the 1956 Dunaharaszti ground motion, for which the location of two liquefied sites could be identified approx. 60 years after the event. This provided an excellent opportunity to analyze possibly the only accessible liquefied sites in Hungary. Analysis of the two sites included field and laboratory tests allowing the back-calculation of maximum horizontal ground acceleration of the earthquake. This parameter was previously unknown because the closest seismometer saturated during the event. The performed back-analysis using the principles of paleoliquefaction studies was the first of such analyses in the country. In areas with low to moderate seismicity, geotechnical engineers often neglect and overlook liquefaction hazard, however, when it is addressed, the hazard is often overestimated due to improper characterization of the seismic loading and site characterization. To explore this observation more deeply, probabilistic seismic and liquefaction hazard assessment were carried out at the two liquefied sites and it was found that this conclusion is also valid for Hungary, but the degree of conservatism of the pseudo-probabilistic procedures decreases with increasing earthquake return period (lower annual probability of occurrence).
Keywords
liquefaction, seismicity, back-analysis, probabilistic approach
1 Introduction
Hungary is situated in the Pannonian Basin, which can be characterized as a seismically moderately active area based on the magnitude recurrence parameters [1]. The return period of magnitude 6 earthquake is about 125 years while magnitude 5 events occur in every 15 years on average.
The greatest portion of Hungary is occupied by low-lying plains, which are covered by young Holocene fluvial and alluvial sediments with relatively high groundwater table.
Consequently, the area is prone to the development of liq- uefaction, and in fact, despite the moderate seismicity, sev- eral liquefaction cases were documented after larger his- torical earthquakes [2].
The purpose of this research was twofold: the first was to analyze the soil profile of two liquefied sites during the 1956 Dunaharaszti earthquake, and back-calculate the
maximum horizontal ground acceleration that struck those areas, because no instrumental data exist regarding this parameter of the earthquake.
The second goal of the research emerged because some critical facilities, including the Paks Nuclear Power Plant (NPP), have been built on liquefaction-susceptible subsoil and in order to properly characterize liquefaction hazard, it is very important to address and understand uncertainties involved in the different calculation methods. Therefore, the performance-based, fully probabilistic liquefaction evaluation procedure of Kramer and Mayfield [3] was applied on the two liquefied sites and the obtained results were compared with the conventional, pseudo-probabi- listic approach, which is used to compute the conditional probability of liquefaction for a given scenario event.
2 The 1956 Dunaharaszti earthquake
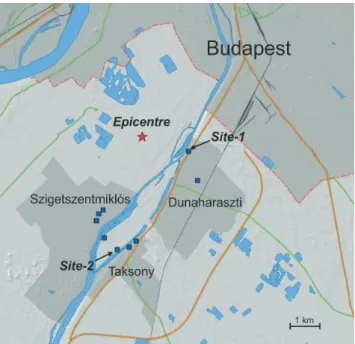
One of the largest documented earthquakes in Hungary occurred on 12 January 1956 at Dunaharaszti located directly to the south of the capital, Budapest. The inten- sity of the event was estimated to be about VIII on the EMS scale [4] and its moment magnitude is assumed to be Mw = 5.9 [2]. Instrumental epicenter was located near Dunaharaszti, in the triangle bordered by the settle- ments of Dunaharaszti, Taksony and Szigetszentmiklós.
The highest damage was also reported from these three settlements. A focal depth of 14 km has been determined from instrumental data [5].
The earthquake was felt throughout Hungary with the exceptions of the easternmost and westernmost parts.
Building damage occurred within a radius of 37 kilome- ters in an average. In Dunaharaszti, approx. 90 % of the buildings suffered damage, however it should be noted that most of these buildings were constructed from adobe. The earthquake claimed two casualties and left many wounded and homeless. After the main shock, hundreds of smaller and larger aftershocks were observed in the region.
Formation of cracks indicating soil liquefaction, as well as sand and mud volcanos were found after the ground motion in a few locations close to the Danube. Several cracks in SSW–NNE direction were observed on the sur- face in the yard of Sziget Csárda in Taksony only a few 10 m distance from the Ráckeve branch of Danube [6].
Eyewitnesses claimed that water was ejected high from the well on the yard of the inn. Bluish grey silty sand came to the surface through 5–8 cm diameter holes found behind and north of the inn. Local accounts from the villages of Szigetszentmiklós and Dunaharaszti reported sand and mud spurt and siltation of dug wells.
A Wiechert-type seismometer was operated in Budapest cca. 15–20 km north of the epicenter but it was saturated by the earthquake; so, instrumental informa- tion does not exist about the maximum horizontal ground acceleration (amax). This parameter could only be deduced from macroseismic intensity values and from analogies of recent similar earthquakes where strong motion data exist.
ShakeMap simulation that is based on ground motion pre- diction equations constructed using the measured acceler- ation data of recent earthquakes, yielded amax > 0.2g in the 220 km2 area of the epicenter. The horizontal peak accel- eration was greater than 0.1g in an area of 2,600 km2 and reached 0.05g at about 8,000 km2 [2].
3 Geotechnical characterization of the liquefied sites After the Dunaharaszti earthquake, exact location of some liquefied sites was recorded, and in December 2013 it was possible to identify many of these during our site visit even approx. 60 years after the earthquake. Two of the locations proved to be suitable for performing in-situ geotechnical measurements: Site-1: Duna street in Duna- haraszti and Site-2: yard of the Sziget Csárda at 1 Sziget út, Taksony (Fig. 1).
After the site visit, both locations were subjected to geo- technical site investigation, which included borings, stan- dard penetration testing (SPT) and cone penetration testing (CPT). The borings were carried out by auger boring in 190 mm diameter. The soil samples were then transferred to the Geotechnical Laboratory of the Department of Engineering Geology and Geotechnics, BME, Budapest, where laboratory tests were conducted on them.
The site investigation showed that the sites comprise the following soil profile: the surface is covered by tran- sitional layers (silty clay, silt, sandy silt) in approx. 3 m thickness. This is underlain by an approx. 1 m thick silty sand/sand layer, which is followed by a thin gravelly layer.
Below the gravelly layer, sandy silt can be found at the Dunaharaszti site and sand and gravel at the Taksony site.
Then, the boreholes terminated in clay at both locations.
The groundwater was encountered in 2.8 and 2.5 m depth in Dunaharaszti and Taksony, respectively.
Fig. 1 Surface manifestations of liquefaction after the Dunaharaszti earthquake and the location of the two studied site
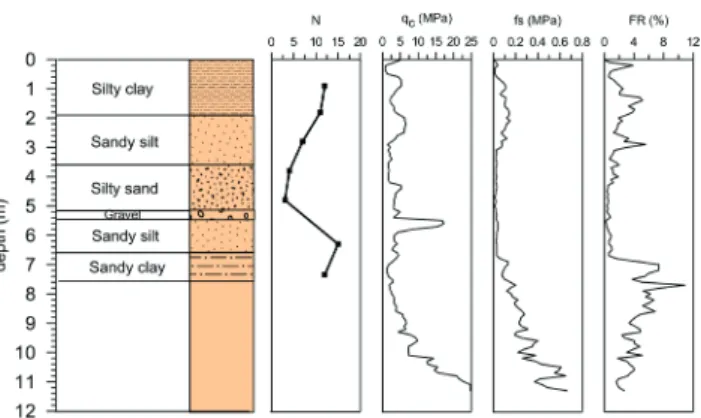
Identification of the critical layers that liquefied during the earthquake is an important step in any case history analysis. At Site-1, the liquefied layer could be identified easily as both the CPT and SPT records and the grain size distribution support that the silty sand layer between 3.5 and 5.1 m depths was the critical one (Fig. 2). This layer is loosely deposited, which is also reflected by the fact that it was not possible to retrieve soil sample from the SPT as it pushed aside the soil in front of it during penetration. The layer has a coefficient of uniformity of CU = 6–9 and a fines content (FC) of 25 %. At Site-2, the soil profile is more variable. The silty sand is proved to be slightly more com- pacted than at Dunaharaszti, thus it seems that the most susceptible layer to liquefaction is the sand layer around 5 m depth based on the test results (Fig. 3). According to the layer’s grain size distribution, it is more poorly graded (coefficient of uniformity is CU = 3.76). The layer has an average FC of 10 %. Nagy and Huszák showed that these types of soils are also the most vulnerable for piping [7].
4 Back-analysis of Dunaharaszti earthquake peak ground acceleration
As it was mentioned in Section 2, no instrumental data exists regarding the shaking intensity of the Dunaharaszti earthquake, because the ground movement exceeded the measurement range of the closest seismometer. Our pur- pose was to give an independent estimation of the possible amax values of the sites on geotechnical basis.
Several methods are available for this back-analy- sis on geotechnical basis, but only two have been used extensively: cyclic stress-based methods, and the mag- nitude-bound method. Major reliance has been placed on cyclic stress-based methods, which were developed and commonly used to evaluate the liquefaction potential of sites subjected to design (future) earthquake motions.
However, in addition to forward analysis, these proce- dures have proven valuable for estimating the combina- tion of amax and Mw required to induce liquefaction at sites for pre-instrumental earthquakes.
Compared to conventional paleoliquefaction studies of historical earthquakes, the case of Dunaharaszti ground motion is somewhat different, because the magnitude of the event is well-known and only the acceleration needs to be estimated. The probabilistic estimation of amax was carried out using the CPT-based probabilistic method of Boulanger and Idriss [8]. Among the commonly used cyclic stress-based methods, the CPT-based method of Boulanger and Idriss is deemed to be the most accurate and
most realistic. On one hand, SPT testing has no tradition in Hungary and contractors has no practice in performing them, hence the results often turned out to be erroneous as it was also pointed out by Katona et al. [9]. On the other hand, independent comparison of CPT-based methods by Green et al. [10] showed that the procedure proposed by Idriss and Boulanger [11] – which was updated in 2014 – results in the lowest error index for the case histories that were analyzed from the Canterbury Earthquake Sequence, New Zealand.
In the month before the earthquake, the average pre- cipitation was approximately the same as the 100-year average, therefore the presence of an average ground- water level is a reasonable assumption during the event.
The subsequent site exploration was also carried out at an average groundwater level in the early summer months of 2014. Therefore, the calculation was performed with the assumption of the same groundwater depths that were measured during the ground investigation.
Fig. 4 shows the required peak ground acceleration to trigger liquefaction with different probability levels in the critical layer for both sites. The figures can also be
Fig. 2 Soil profile, SPT blow counts (N), CPT tip resistance (qc), sleeve friction (fs) and friction ratio (FR) at Site-1
Fig. 3 Soil profile, SPT blow counts (N), CPT tip resistance (qc), sleeve friction (fs) and friction ratio (FR) at Site-2
interpreted as showing the probability of non-exceedance of different peak ground accelerations if we assume that lique- faction just occurred (i.e. factor of safety was exactly 1.0).
The amax values corresponding to 50 % liquefaction occurrence probability are 0.247g and 0.193g at Site-1 and Site-2, respectively. These estimations are close to the ShakeMap simulation accelerations, thus they seem to be a realistic approximations of the actual values.
The Dunaharaszti site (Site-1) was probably hit by higher acceleration than the Taksony site (Site-2) as it is reflected in Fig. 4 showing that higher acceleration is needed in Dunaharaszti to induce liquefaction (which is known to have occurred). This difference is mainly attributed to the fines content in the critical layer, which is FC = 25 % at Site-1, but only FC = 10 % at Site-2.
5 Probabilistic evaluation of liquefaction hazard Liquefaction potential evaluations are most commonly per- formed using the in-situ test-based simplified methods, which can quantify the liquefaction hazard deterministi- cally by defining a factor of safety or predicting the prob- ability of liquefaction for a specific scenario earthquake.
The seismic loading is represented by a single pair of amax and Mw associated with the return period or hazard level of interest. Usually, the level of ground motion is obtained from the results of probabilistic seismic hazard assessment (PSHA) or from codified seismic zonation maps (such as that presented in the National Annex of MSZ EN 1998-1:2008).
Although these ground motion parameters have proba- bilistic basis, a single level of ground shaking is selected and used within the liquefaction potential evaluation [3].
This approach is called pseudo-probabilistic approach.
In contrary, the fully probabilistic liquefaction hazard assessment (PLHA) methods provide a complete picture of liquefaction hazard, namely taking into account the joint probability distribution of amax and Mw of earthquake scenarios; both of which are key inputs in the stress-based simplified methods.
The basis of PLHA is the same as that of the PSHA pro- posed by Cornell [12]. But in this case, maximum acceler- ation is replaced with the level of liquefaction as the haz- ard being examined. The probabilistic cyclic stress-based (simplified) methods provide the conditional probability of liquefaction for a scenario earthquake and therefore it is more self-evident to use them during the calculation of total probability of liquefaction, i.e. to integrate them into the process of PLHA.
Kramer and Mayfield [3] developed a fully probabilis- tic liquefaction potential evaluation method using the per- formance-based earthquake engineering (PBEE) frame- work. It computes the hazard and/or risk as a function of several intermediate variables characterized as the intensity measure, engineering demand parameter (EDP), damage measure (DM), and decision variable (DV). Each of these intermediate variables is linked together using the total prob- ability theory into a chain of conditional probabilities [13].
According to the performance-based liquefaction potential evaluation method of Kramer and Mayfield [3], FS represents the EDP and the joint distribution of amax and Mw represents the IM. The annual rate of non-exceedance for a given factor of safety (FS*), i.e. the liquefaction haz- ard curve can be calculated as:
ΛFS ∆
j N
i N
max i w j a M
Mw amax
max i w j
P FS FS a M
* , ,
*
,, , , ,
=
(
<)
= =
∑ ∑
1 1λ (1)
where: NMw and Namax are the number of magnitude and horizontal peak surface acceleration increments, respec- tively, P(FS < FS*|amax,i , Mw,j) is the conditional probabil- ity of liquefaction given the occurrence of amax,i and Mw,j , and Δλamax,i,Mw,j is the joint incremental mean annual rate of exceedance of amax,i and Mw,j that are computed from the joint probability bins from a ground motion disaggrega- tion analysis.
The inputs of the procedure representing the loading are the magnitude distributions contributing the amax for dif- ferent return periods; these come from the disaggregation matrices of probabilistic seismic hazard assessment. The other inputs are the results of in-situ and laboratory tests that characterize the liquefaction resistance of soils. The
Fig. 4 Peak ground acceleration required to trigger liquefaction with different probability levels in the critical layers using the CPT-based
method of Boulanger and Idriss [8]
procedure gives the direct estimate of the return period of liquefaction and the liquefaction hazard curves in function of depth as results.
Equation (1) describes the liquefaction hazard curves that can be determined for any depth where liquefaction susceptible sandy soils occur. Since liquefaction is expected to occur when FS < 1.0, the return period of liquefaction (TR) corresponds to the reciprocal of the mean annual rate of non-exceedance of FS = 1.0.
6 Liquefaction hazard in areas with low to moderate seismicity
In areas with low to moderate seismicity, such as Hungary, geotechnical engineers often neglect liquefaction hazard however when it is addressed, the hazard is often over- estimated due to improper characterization of probabi- listic seismic loading and site characterization as pointed out by Franke et al. [14]. The authors demonstrated that the pseudo-probabilistic procedure, however commonly used in practice, tends to overestimate liquefaction haz- ard in areas with low to moderate seismicity compared to the fully probabilistic performance-based PLHA.
As they conclude, this trend occurs because the perfor- mance-based approach considers seismic loading from all return periods, thus accounting for the much lower likeli- hood of ground motion occurrence at lower return periods in areas of low to moderate seismicity. Arndt [15] incor- porated CPT-based probabilistic models into the perfor- mance-based PLHA and arrived to the same conclusion.
Katona et al. [16] performed a similar analysis for the site of Paks NPP, however the considered return periods were considerably larger: 10,000 and 100,000 years, which are typical for design and safety analyses for nuclear power plants. The authors proposed a simple method, that is based on the proper selection of Mw as mean value from the distribution of magnitudes contributing to the mean amax at given hazard level, for the evaluation of liquefaction hazard for screening and margin assessment purposes.
The results showed that pseudo-probabilistic methods will not yield to over-conservative results for return periods of T ≥ 10,000 years, where near-to-the-site large earthquakes dominate the hazard.
These studies indicate that conservatism of the pseu- do-probabilistic approach compared to fully probabilis- tic performance-based PLHA may decrease with increas- ing return periods. This conjecture was attempted to be verified on the two liquified sites of the Dunaharaszti
1956 earthquake, that are presented in detail in Section 3.
The calculations were performed by incorporating the CPT-based procedure of Boulanger and Idriss [11] into pseudo-probabilistic and performance-based approach.
7 Seismic and liquefaction hazard assessment of Dunaharaszti
7.1 PSHA of Dunaharaszti
The PSHA for Dunaharaszti was performed using the soft- ware CRISIS2007 [17]. The applied procedure was basi- cally the same as originally defined by Cornell [12] and that is used for the hazard assessment of different proj- ects in Hungary. Disaggregation matrices, which show the contribution of different magnitude - distance pairs to a given level of mean value of the hazard, were determined for altogether 24 return periods. The relative contribution of smaller events decreases whereas the contribution of larger magnitudes increases with increasing return peri- ods (decreasing annual probability). For 475-year return periods, for example, nearby (with an epicentral distance of 0–20 km) relatively smaller magnitude (Mw = 4.9–5.3) events give the largest contribution to the hazard.
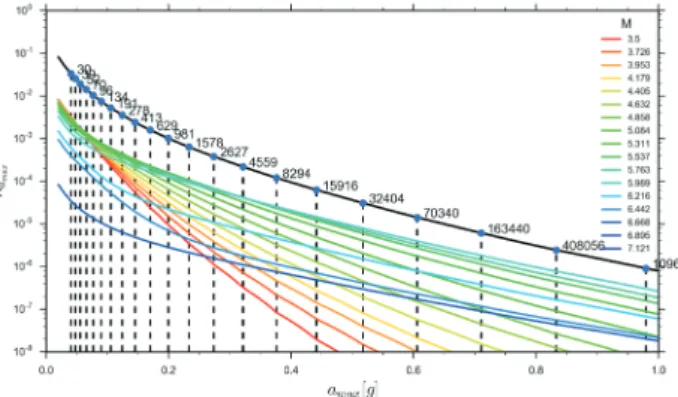
Seismic hazard curves disaggregated on the basis of magnitude were then calculated; their sum yields the total hazard curve (Fig. 5). These disaggregated curves also show the larger contribution of small magnitude events at larger probabilities, i.e. at smaller amax values.
PSHA was computed for stiff soil characterized by 550 m/s average shear wave velocity value in the upper 30 m, which is realistic for Pannonian sediments according to our previous experiences. However, stress-based liquefac- tion assessment methods require the maximum accelera- tion expected on the surface as input parameter. Because young Holocene fluvial sediments with lower S wave velocities cover the surface and velocity measurements
Fig. 5 Seismic hazard curves disaggregated based on the magnitude
were not carried out, site amplification could only be determined empirically, so the surface amax was computed using the median Quaternary alluvium amplification fac- tor (AF) determined by Stewart et al. [18].
However, this is not a major issue as our main purpose was to study the differences arising from the application of various liquefaction potential assessment methods, and not to precisely define the liquefaction hazard at the two selected sites. The two studied sites are approximately 5 km distance from each other so the same PSHA results could be used as input loading.
For the pseudo-probabilistic liquefaction hazard eval- uation, five different return periods were selected. These and the corresponding surface acceleration and the modal and mean magnitude values are shown in Table 1.
The performed PSHA used a minimum magnitude (Mmin) of 3.5. Nevertheless, it was found that Mmin has no consid- erable influence on the results, and the observed trend that conservatism of pseudo-probabilistic approach is decreas- ing with increasing return period also appears this case also.
7.2 Loading side of the PLHA
In moderate seismicity regions, such as Hungary, the smaller magnitude earthquakes give significant contribution to the hazard, especially at higher exceedance probabilities [19].
However, these earthquakes do not cause shaking of suffi- ciently high amplitude and duration that could induce liq- uefaction. According to Green and Bommer [20], the min.
magnitude is about 5.0 that can induce liquefaction for soil profiles that has sufficient strength to support foundations.
So, they proposed that in liquefaction hazard assessments for engineering applications, magnitude 5.0 should be adopted as the min. earthquake size. This recommendation is consistent with the opinion of Atkinson et al. [21].
The two studied sites are located on granular terrace formations of the Danube, close to the residential part of the settlements, so a minimum magnitude of 5.0 was adopted in the PLHA. Therefore, curves belonging to
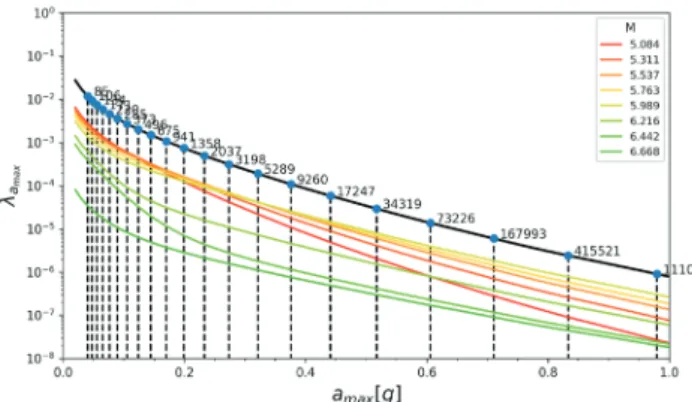
magnitudes less than 5.0 had been removed from the dis- aggregated hazard curves shown in Fig. 5 for the PLHA.
Because of this, the total hazard curve has changed, which is especially noticeable at low return periods (Fig. 6). In the performance-based assessment, these curves were used to characterize seismic loading.
7.3 Results
Liquefaction hazard curves and return periods of lique- faction for both sites were determined by the PBEE pro- cedure of Kramer and Mayfield [3]. Liquefaction hazard curves show the mean annual rate of non-exceedance of different factors of safety. These can be used in the same manner as conventional ground motion hazard curves, but in this case probabilities of non-exceedance are computed instead of exceedance probabilities. Figs. 7 and 8 show the hazard curves calculated for the two sites.
Table 1 Return periods, maximum accelerations and magnitudes belonging to the six selected earthquake scenarios for the pseudo-
probabilistic analysis
T (year) amax (g) Mw - modal Mw - mean
475 0.151 5.3 5.1
981 0.199 5.5 5.3
2627 0.274 5.8 5.4
4980 0.327 5.8 5.5
10000 0.391 6.0 5.6
Fig. 6 Seismic hazard curves disaggregated based on magnitude (Mw > 5)
Fig. 7 Liquefaction hazard curves computed for different depths for Site-1 using the CPT-based procedure of Boulanger and Idriss [11]
Factor of safety can be obtained from the liquefac- tion hazard curves by selecting the annual probability of exceedance (i.e. return period) of interest and then, the corresponding factor of safety can be read from the hori- zontal axis for each measurement depth.
Further to applying the PBEE framework, FS was also calculated by the conventional pseudo-probabilistic way for the five listed return periods. In this case, the calcula- tion was carried out for the corresponding scenario events that are listed in Table 1 by using both the mean and modal magnitudes. Although, the used method [12] have prob- abilistic basis and give the probability of liquefaction for a scenario earthquake as a result, deterministic FS can also be obtained by rearranging its formula.
The results of the analysis confirmed the conclusion of Franke et al. [14] that the pseudo-probabilistic approach tends to overestimate liquefaction hazard in areas with low to moderate seismicity compared to the fully probabilis- tic performance-based PLHA. If the FS calculated by the fully probabilistic approach is divided by that of the pseu- do-probabilistic one, the ratio will decrease with increas- ing return period (i.e. decreasing annual probability of occurrence) as it is shown in Fig. 9. For 475-year return period, PLHA yielded approx. 1.45 times higher FS than the pseudo-probabilistic procedure, whereas this value is 1.22 for 10,000-year return period if the modal magnitude values are considered. The rate of change is decreasing with increasing return period. The same conservatism
level of the two approaches at high return periods was not reached as it was noted by Katona et al. [16], neverthe- less the conservatism of the pseudo-probabilistic approach reduced considerably.
The same tendencies can be observed if the mean mag- nitudes are used in the calculation instead of the modal magnitudes (Fig. 9). As Table 1 shows, mean magnitudes are somewhat smaller than the modal values; this yields slightly smaller factors of safety for the pseudo-probabilistic approach, and consequently, slightly (with approx. 2–5 %) smaller ratio of the results between the different approaches, but the overall trends are the same. The observed tenden- cies seem to be irrespective to subsoil conditions as the two studied sites basically gave the same result.
The performed PSHA used a minimum magnitude of 3.5 however, as noted by Bommer and Crowley [22], Mmin is really an engineering rather than a seismologi- cal parameter and its meaning is related to the estimation of seismic risk. For this reason, different seismic hazard analyses use different Mmin values, e.g. the Seismic Hazard Harmonization in Europe (SHARE) project selected a minimum magnitude of 4.5. To analyze the effect of the Mmin value on the above discussed conclusion, PSHA was also performed by using this minimum threshold value in the analysis and then calculating factor of safety with pseudo-probabilistic approach by applying the new seis- mic loading parameters. It was found that Mmin has no considerable influence on the results, and the observed trend that conservatism of pseudo-probabilistic approach is decreasing with increasing return period also appears this case also.
Fig. 8 Liquefaction hazard curves computed for different depths for Site-2 using the CPT-based procedure of Boulanger and Idriss [11]
Fig. 9 Ratio of the factors of safety obtained by pseudo-probabilistic and fully probabilistic PLHA approach in the function of earthquake
return period considering mean and modal magnitudes
8 Conclusions
This study focuses on two Hungarian liquefied sites, which are possibly the only accessible liquefied sites in the country. After the 1956 Dunaharaszti earthquake, sur- face manifestation of liquefaction has been observed at several location in the epicentral area, from which one site at Dunaharaszti and one site at Taksony could be identified and subjected to field tests approx. 60 years after the event.
Analysis of the two sites included field tests (CPT, SPT, borings) and laboratory tests (soil classification) allow- ing the back-calculation of maximum horizontal ground acceleration of the earthquake. This parameter could be only estimated from macroseismic intensities and from analogies of recent similar instrumentally recorded earthquakes because the closest seismometer saturated during the event. The performed back-analysis using the
principles of paleoliquefaction studies gave an indepen- dent estimation of the ground acceleration and it was the first of such analyses in Hungary.
Performance based probabilistic liquefaction assessment procedure of Kramer and Mayfield [3] was successfully implemented using the CPT-based built-in stress-based sim- plified method of Boulanger and Idriss [8] for the two liq- uefied sites. Liquefaction hazard curves showing the mean annual rate of non-exceedance of different factors of safety and return period of liquefaction in function of depth were also computed. It was found that, similarly to the obser- vation of Franke et al. [14], pseudo-probabilistic liquefac- tion potential evaluation methods overestimate the hazard compared to the fully probabilistic performance-based approach and degree of conservatism of the pseudo-prob- abilistic procedures decreases with increasing earthquake return period (lower annual probability of occurrence).
References
[1] Tóth, L., Mónus, P., Zsíros, T., Kiszely, M. "Seismicity in the Pannonian Region", EGU Stephan Mueller Special Publication Series, 3, pp. 9–28, 2002.
https://doi.org/10.5194/smsps-3-9-2002
[2] Győri, E., Tóth, L., Mónus, P. "Secondary effects generated by earthquakes: liquefaction occurrences in and around Hungary", Acta Geodaetica et Geophysica, 50, pp. 79–95, 2015.
https://doi.org/10.1007/s40328-014-0079-z
[3] Kramer, S. L., Mayfield, R. T. "Return Period of Soil Liquefaction", Journal of Geotechnical and Geoenvironmental Engineering, 133(7), pp. 802–813, 2007.
https://doi.org/10.1061/(ASCE)1090-0241(2007)133:7(802) [4] Zsíros, T. "A Kárpát-medence szeizmicitása és földrengés veszély-
essége: Magyar földrengés katalógus (456-1995)", (Seismicity and seismic hazard of the Carpathian Basin: Hungarian earthquake cat- alogue (456-1995)), MTA Földtudományi Kutatóközpont Geodéziai és Geofizikai Kutatóintézet Szeizmológiai Obszervatórium, Budapest, Hungary, 2000. (in Hungarian) [online] Available at:
http://mek.oszk.hu/04800/04801/
[5] Szeidovitz, Gy. "The Dunaharaszti Earthquake January 12, 1956", Acta Geodaetica et Geophysica, 21(1–2), pp. 109–125, 1986.
[6] Somogyi, S. "Megfigyelések Budapest környékén az 1956. január 12-i földrengéstől sújtott területen", (Observations of the area struck by the 12 January 1956 earthquake around Budapest), Földrajzi Értesítő, 2, pp. 129–134, 1956. (in Hungarian)
[7] Nagy, L., Huszák, T. "Investigation of piping material", Periodica Polytechnica Civil Engineering, 56(2), 233–238, 2012.
https://doi.org/10.3311/pp.ci.2012-2.09
[8] Boulanger, R. W., Idriss, I. M. "CPT and SPT based liquefaction trig- gering procedures", Centre for Geotechnical Modelling. Department of Civil and Environmental Engineering, University of California, Davis, Report No. UCD/CGM-14/01, 2014.
[9] Katona, T. J., Bán, Z., Győri, E., Tóth, L., Mahler, A. "Safety Assessment of Nuclear Power Plants for Liquefaction Consequ- ences", Science and Technology of Nuclear Installations, Article ID 727291, 2015.
https://doi.org/10.1155/2015/727291
[10] Green, R. A., Cubrinovski, M., Cox, B., Wood, C., Wotherspoon, L., Bradley, B., Maurer, B. "Select Liquefaction Case Histories from the 2010–2011 Canterbury Earthquake Sequence", Earthquake Spectra, 30(1), pp. 131–153, 2014.
https://doi.org/10.1193/030713EQS066M
[11] Idriss, I. M., Boulanger, R. W. "Soil Liquefaction During Earth- quakes", Earthquake Engineering Research Institute, Oakland, CA, USA, 2008.
[12] Cornell, C. A. "Engineering seismic risk analysis", Bulletin of the Seismological Society of America, 58(5), pp. 1583–1606, 1968.
[13] Cornell, C. A., Krawinkler, H. "Progress and Challenges in Seismic Performance Assessment", PEER Center News, 3(1–3), 2000.
[14] Franke, K. W., Lingwall, B. N., Youd, T. L., Blonquist, J., Liang, J. H.
"Overestimation of liquefaction hazard in areas of low to moderate seismicity due to improper characterization of probabilistic seis- mic loading", Soil Dynamics and Earthquake Engineering, 116, pp.
681–691, 2019.
https://doi.org/10.1016/j.soildyn.2018.10.040
[15] Arndt, A. M. "Performance-Based Liquefaction Triggering Analyses with Two Liquefaction Models Using the Cone Penetration Test", MSc Thesis, Brigham Young University, 2017. [online] Available at:
http://hdl.lib.byu.edu/1877/etd9521
[16] Katona, T. J., Győri, E., Tóth, L. "Applicability of Pseudoprobab- ilistic Method of Liquefaction Hazard Assessment for Nuclear Power Plants at Diffuse Seismicity Sites", Science and Technology of Nuclear Installations, Article ID 5010814, 2019.
https://doi.org/10.1155/2019/5010814
[17] Ordaz, M., Aguilar, A., Arboleda, J. "CRISIS 2007 v1", Engineering Institute of the National University of Mexico, Coyoacán, Mexico, 2007. [computer program] Available at: https://ecapra.org/topics/
crisis-2007
[18] Stewart, J. P., Liu, A. H., Choi, Y. "Amplification Factors for Spectral Acceleration in Tectonically Active Regions", Bulletin of the Seismological Society of America, 93(1), pp. 332–352, 2003.
https://doi.org/10.1785/0120020049
[19] Győri, E., Gráczer, Z., Tóth, L., Bán, Z., Horváth, T. "Probabilistic liquefaction hazard analysis at liquefied sites of 1956 Dunaharaszti earthquake, in Hungary", Geophysical Research Abstract, 19, Article ID: EGU2017-7474, 2017.
[20] Green, R. A., Bommer, J. J. "What is the Smallest Earthquake Magnitude that Needs to be Considered in Assessing Liquefaction Hazard?", Earthquake Spectra, 35(3), pp. 1441–1464, 2019.
https://doi.org/10.1193/032218EQS064M
[21] Atkinson, G. M., Finn, W. D. L., Charlwood, R. G. "Simple Computation of Liquefaction Probability for Seismic Hazard Application", Earthquake Spectra, 1(1), pp. 107–123, 1984.
https://doi.org/10.1193/1.1585259
[22] Bommer, J. J., Crowley, H. "The Purpose and Definition of the Minimum Magnitude Limit in PSHA Calculations", Seismological Research Letters, 88(4), pp. 1097–1106, 2017.
https://doi.org/10.1785/0220170015

![Fig. 8 Liquefaction hazard curves computed for different depths for Site-2 using the CPT-based procedure of Boulanger and Idriss [11]](https://thumb-eu.123doks.com/thumbv2/9dokorg/774645.34988/7.892.470.824.163.399/liquefaction-hazard-curves-computed-different-procedure-boulanger-idriss.webp)
