CHANGE OF COMPOSITION AND DIVERSITY OF SPECIES AND GRASSLAND MANAGEMENT BETWEEN DIFFERENT GRAZING
INTENSITY IN PANNONIAN DRY AND WET GRASSLANDS
KISS,T.1*–LÉVAI,P.1–FERENCZ,Á.1–SZENTES,SZ.2–HUFNAGEL,L.3–NAGY,A.2– BALOGH,Á.2–PINTÉR,O.2–SALÁTA,D.2–HÁZI,J.2–TÓTH,A.2–WICHMANN,B.2–
PENKSZA,K.2
1Dept. of Floriculture Landscape Architecture, Fac. of Horticulture, College of Kecskemét H–6000 Kecskemét, Erdei F. tér 1-3.
(phone: +36-76-517-613, fax: +36-76-517-601)
2Szent István University, Department of Natural Conservation and Landscape Ecology H–2103 Gödöllő, Páter Károly u. 1.
(phone: +36-28-410-200; fax: +36-28-410-804)
3Corvinus University of Budapest, Department of Mathematics and Informatics H-1118 Budapest, Villányi út 29-43
(phone: +36-1-294-9875)
*Corresponding author e-mail: kiss.timea@kfk.kefo.hu
(Received 10th July 2011; accepted 14th September 2011)
Abstract. Investigations were carried out in wet and dry pasture. Coenological recordings were taken in three zones. The first zone (“A”) located 0-50 m near the stable, second zone (“B”) located 50-150 m from the stable, while the third zone (“C”) located farther than 150 m. We have carried out analyses of ecological and environmental factors and life form types. Based on our results for both dry and wet grasslands, quadrates of “A” zone were well isolated from the rest of the zones. Overgrazing, which involves considerable trampling, vanishes differences among vegetations, thereby promotes weed and disturbance tolerant rich vegetation. The lowest species number and diversity could be found here. Due to the nitrogen enrichment due to the constant presence of livestock, drier and less heat demanding habitat developed in the “A” zones, according to the environmental indicators. Because of the change in management, conservation and diversity values of “C” zone increased, however, according to nature protection values it underperformed compared to “B” zone. According to the sample area, wet grasslands from the sandy areas of Kiskunság, preserve nature protection values and grass composition better moving away from stables, due to less grazing pressure. Drier backgrounds tolerate stronger grazing pressure.
Keywords: indicator value, ecological values, grassland maintain, nature conservation Kiskunság
Introduction
Characteristic vegetation types have evolved in Pannon biogeographic region situated in the Great Hungarian Plain’s area. Human activity is responsible for the preservation of many of these habitats and associations. At the diverse sandy region in Danube - Tisza region large extent mosaic like grasslands can be found parallel with the appearance of saline soil and these are adjusted to geomorphology. More than 9% of the territory of Hungary (approximately 1.0042 million hectares) belongs to grassland cultivation (Kárpáti and Takács, 2008) which comprises 6.5% of the country's agricultural land. The size of grassland area follows a steady downward trend, which can be explained by the decrease of the number of livestock. In addition, different types
of grass represent the largest part of nature sanctuaries, so grasslands not only have major role in grassland management but also are important in preserving the natural vegetation. In the Pannonian region one third of the protected plant and animal species are grassland related, besides a number of vulnerable associations are also presented there. The appropriate conservationist handling is essential, since both their economic utilization and diversity preservation are common tasks.
The significant proportion of dry and wet grasslands can only be preserved with the adequate maintenance. The appropriate handling options are the extensive husbanding forms – mainly grazing and mowing – in addition, a reasonable and well thought-out load application is very important (Catorci et al., 2006, 2007a, 2007b, 2009, 2011;
Stampfli and Zeiter, 1999; Ilmarinen, 2009; Willems, 1983; Török et al., 2009, 2010;
Tóth et al., 2003; Bakker et al., 1996; Noble and Gitay, 1996; Roberts, 1996; Campbell et al., 1999; Kleyer, 1999; Pausas, 1999).
As part of grassland management, in connection to grazing, examining over-grazing has an essential importance. A number of articles deal with over-grazing, however, their approach to the subject is quite diverse.
Regulation in the UK takes the vegetation into consideration that over-grazing can be observed in case of areas where livestock is presented in such numbers that it effects vegetation growth, quality or species composition significantly and negatively (Statutory Instrument, 1996). According Wilson and MacLoad (1991), considering the livestock factor, areas are over-grazed if because of herbivores grazing the vegetation changes and the amount of animal products reduces. Overgrazing has different meanings in the aspects of farmers and botanists. Over-grazing, as a concept – in terms of grassland management – indicates the grazing animal carrying capacity, the maximum number of tenable species/varieties per area unit, and the number of livestock kept for a period in order to produce needed product. An optimum stocking rate is the value, which regulate the number of grazing animals at the most economical rate (Cowlishaw, 1969). Over-grazing can be interpreted as an indicator of the actual number of livestock, but its time/interval defining dimension/role is more important (Pratt, 2002). According to Brizuela and Cid (1993) the first signs of over-grazing on the composition of vegetation are the decrease in the proportion of legumes/pulses as well as the increase in the proportion of other dicot species and baring spots.
Lack of grazing also has negative effect on evolved pasture at continental climate, which for instance induces spatial spread of weed and shrub species (Jávor et al., 1999).
In an experiment, carried out by Longhi et al. (1999), the number of species was higher in case of fence enclosed isolated area than areas sheltered by hills. Moreover, the number of species correlated with plant height, which is used as an indicator of grazing intensity. Nevertheless, results indicate that both fenced and grazed areas had the same number of species, but their species composition differed (Paulsamy et al., 1987). As a result, the intensive- and especially over-grazing environment leads a relatively low number of delicious species to decline, while favours the proven less tasty non- proliferation plant species to thrive. According to Fuls (1992), the long-term spot over- grazing leads to significant degradation, which can result in even 90% decrease in coverage.
In the highly degraded plots, plant coverage fell below 1% and the low-level succession and pioneer plant composition were dominant. Anderson and Radford (1994) monitored grazing efficiency for eight years. If the grazing pressure reduced from 0.4 to 5.6-2.3 ha pasture (in both cases one sheep were grazed), the average plant vegetation
coverage increased from 49% to 91.7% in parallel. Communities sensitively respond to the specific grazing pressure similarly to vintage effects (Aiken, 1990). Herbivores are able to positively influence the diversity of grasslands (B. Peco et al., 2006), although some studies prove the existence of opposite processes (Ritchie and Olff, 1998).
Reportedly, grazing of large herbivores has its impact on primary production (Noy-Meir et al., 1989) and spatial heterogeneity (Adler and Lauenroth, 2000; Peco et al., 2006) of associations; influences vegetation structure (Sala, 1988), species composition (Kahmen et al., 2002; Moog et al., 2002) and species diversity (Virágh and Bartha, 1996; Pykälä, 2003; Pykälä et al., 2005). Grazing manners are indicated in vegetation and types of grazing appear in production (Naveh and Whittaker, 1979; Milchunas et al., 1988).
The grazing-induced changes depend on the type of vegetation, such as upon disturbance different species may react differently (Lavoro et al., 1998). Abandonment of grazing – on fields, which well adapted to grazing – has its significant effect on vegetation, in many cases, abandonment could be interpreted as disturbance (Sala et al., 1996). The review of studies on the effect of grazing clearly discloses that grazing as a form of field management has its great importance in maintaining diversity of grassland species and processes of landscape (Luoto et al., 2003).
Our pre-grazing hypothesis during the investigation was that grazing livestock are the most determination state of field. Their presence due to continuous grazing led to degradation of the vegetation thereby significantly transformed species composition this area, which increased the amount of weed species.
Investigations were directed primarily on the changes in vegetation. It was further questioned if changes can be observed, in which direction change the original vegetation, composition of association, dominance relations and dominant species.
Overall, we were looking for answers:
• To what extent can detect the changes in the grazing areas of vegetation in context of space and time?
• Are the species composition of dry and fresh vegetation and dominance relations react similarly to grazing? Is grazing homogenize the grazing areas or mask the differences? The different intensity of grazing how contributes to the preservation of diversity?
• Are there any (if so, where and with what load) parts of the areas where the management, conservation grazing meet the needs?
Materials and methods Sampling fields
The sampling areas were located in the Pannonian biogeographical region between Danube and Tisza rivers (Marosi and Somogyi, 1990). From Kiskunság National Park area two sample areas were selected, one dry and one wet grassland. Dry grassland, which formed on sand located west of Bugac, while the more humid grassland located west of Tatárszentgyörgy (Fig. 1).
Figure 1. Location of examined areas
The Bugac dry sandy grassland pasture (Potentillo arenariae-Festucetum pseudovinae Soó 1938, 1940), located at a higher altitude, is engaged in grazing since 1990. Free grazing was applied until 2000 section making has been applied. Cattles and sheep graze the area and the grassland load is 0.4 ha/livestock.
Sample plot Tatárszentgyörgy is situated lower and can be classified into the Deschampsenion caespitosae association class (Borhidi, 2003) with marshes associations (Agrostio-Deschampsenion caespitosae Ujvárosi, 1947). Salinity can be observed in some places as well as wet meadow vegetation fragments (Molinio- Salicetum rosmarinifoliae Magyar ex Soó, 1933). The area is only grazed by cattle, while the grassland load is similar to the previous one: 0.4 ha/livestock.
Data collection
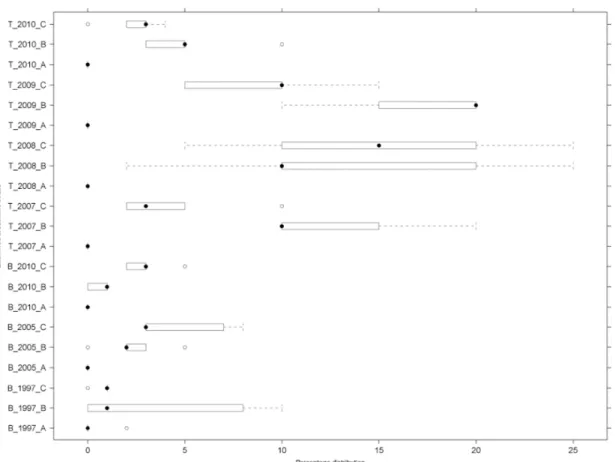
The plant cover records were prepared in June of 2007, 2008, 2009 and 2010 in case of Tatárszentgyörgy, while in June of 1997, 2005 and 2010 in case of Bugac. For recording the Braun-Blanquet (1964) method was followed, in which 2x2 m quadrates were used; whereby the percentage of coverage was rendered to each species. However, coverage values of each level were recorded separately, thus in some cases more than 100% total coverage occurred in some places. Names of species follow the nomenclature of Simon (2000). To monitor changes in grazing pressure, three plant sections were established based on distance from the cattle-pen (Fig. 2):
• Zone A: 0-50 m (the greatest degree of disturbance and trampling can be observed here)
• Zone B: 50-150 m (moderate disturbance prevails)
• Zone C: farther than 150 m (interference is negligible)
Figure 2. Location of sampling area zones A: 0-50 m, B: 50-150 m, C: 150 m-
The following abbreviations were used in case of tables and graphs: if only some of the “A”, “B” or “C” zones were compared of the areas, then numbers of years were not used. In case if five average year’s records were examined, both town, zone and year were indicated (e.g.: BA97, where “B” represents the settlement (Bugac), “A”
represents the distance (0-50m from the stable) while “97” represents the year 1997). If the plant covers for each recording are indicated, then numbers from 1 to 5 is indicated after the year.
In all three zones 5-5 quadrates were recorded.
Data processing
The entire table was used to calculate diversity and species richness determination during processing of coenological data. Species that were rare with coverage value less than 1% were omitted from classification and ordination analyses, since then only the diagnostic species were studied. For compilations in the first table only diagnostic species were used. Clustering was based on Borhidi (1995) social types and Simon (2000) nature conservation categories.
From bioindicator values relative water demand (WB), relative nitrogen requirement (NB) and relative temperature requirement (TB) were evaluated based on the data (Borhidi, 1995). Social behavior assessment was carried out according to Borhidi (1995), while distribution of categories of conservation was based on Simon (2000). Life forms based on Simon (2000) were implemented by Pignatti (2005) categories.
During statistical analyses normally distributed models were set up, in which the number of species and individuals were included (cover value in case of plants) as dependent variables. As explanatory variables SHDI values and transect position values were applied indicating marginal or internal position of transects. Farmer and field effects were taken into account as random factors.
Statistical methods
Two way clustering is a graphical way of displaying measured values by using colours that represent numerical values. Lower values tend towards green, while higher values tend towards red tones. Re-arranged rows and columns of the table grouped together represent similarity of dendrograms on the two axes. For the clusters Euclidian distance measure were applied as ordinary distance between two points.
For each area, total coverage, species richness and the Shannon-diversity (Pielou, 1975) was calculated. The effects of different grazing intensities were tested using repeated – measure analyses of variance (ANOVA). For post-hoc test the Tukey Honestly Significant Difference (HSD) with corrections (adjusted p-values for the multiple tests) was used. Data were analyzed by the R-statistical program (R Development Core Team, 2009).
After calculating the Shannon-diversities for each recording, the average of areas were taken and compared in both areas beside the increasing disturbance. Beyond calculating average diversity values additional information can be obtained from drawing diversity profiles to each type. This was carried out by Rényi-diversity (Tóthmérész, 1995).
Results
Species composition, diversity and vegetation analysis
Distribution of species by area and type of treatment is shown in Table 1. Three weed species were reported only in “A” record. Among species general in all areas – both in “A”, “B” and “C” zones – only one characteristic vegetation species were presented: Achillea asplenifolia (Simon, 2000). This species is considered a disturbance tolerant species according Borhidi (1995). From species occurring in lands regardless of land category, 10 species were weeds. In addition, only disturbance tolerant species were presented with high rate: 47%.
Among species that only occur either in Bugac or in Tatárszentgyörgy, the affiliation rate was reversed. The amount of weeds reduced or completely disappeared, like in case of Tatárszentgyörgy. In case of Bugac, only one weed species occurred, Carduus nutans. Among disturbance tolerant species we recorded only two species in Bugac, while no such was recorded in Tatárszentgyörgy. In Bugac, pioneer species also occurred in recordings (e.g., Bromus squarrosus, Anthemis ruthenica).
Species that occurred in both areas were presented in a significant proportion (20- 25%) (Table 1), however, their incidence was lower than that of typical species in some areas. Latter includes natural grassland species and taxons from disturbed areas. From the common species, natural grasslands elements (K, E, C, G) showed higher coverage values in case of Tatárszentgyörgy.
Table 1. Distribution of coenological recording species in Bugac and in Tatárszentgyörgy (GY: weeds, RC: ruderal competitors, K: competitors, DT: disturbance tolerants, C: competitors, G: generalists, TP = NP: natural pioneers)
Species of
A zones BA ± SD BB ± SD BC ± SD TA ± SD TB ± SD TC ± SD GY (RC)
Amaranthus
retroflexus 1 ±1.00 0,1 ±0.25 0 ±0.00 0.4 ±0.67 0 ±0.00 0 ±0.00 Poa humilis 0.3 ±0.68 0 ±0.00 0 ±0.00 4.5 ±2.32 0 ±0.00 0 ±0.00
Polygonum
aviculare 0.9 ±1.33 0 ±0.00 0 ±0.00 3.9 ±2.17 0 ±0.00 0 ±0.00 Veronica
arvensis 0.3 ±0.70 0 ±0.00 0 ±0.00 0.1 ±0.22 0 ±0.00 0 ±0.00 Species of A, B
and C zones BA ± SD BB ± SD BC ± SD TA ± SD TB ± SD TC ± SD K (DT)
Achillea
asplenifolia 0.07 ±0.25 2.3 ±2.56 1.33 ±1.67 0 ±0.00 2.1 ±1.02 1.5 ±1.46 GY (RC)
Agropyron
repens 2.2 ±2.70 2.9 ±2.01 6.4 ±1.67 0 ±0.00 0.35 ±0.67 0.9 ±1.66 Ambrosia
artemisiifolia 0.8 ±1.14 0.1 ±0.25 0 ±0.00 0.45 ±0.88 0 ±0.00 0 ±0.00 Capsella bursa-
pastoris 0.87 ±0.74 0 ±0.00 0.13 ±0.51 0.4 ±0.88 0 ±0.00 0 ±0.00 Conyza
canadensis 1.13 ±0.99 0 ±0.00 0.07 ±0.25 0.35 ±0.67 0 ±0.00 0 ±0.00 Eryngium
campestre 0.93 ±1.53 1.7 ±3.34 0.2 ±0.77 4.35 ±2.88 0 ±0.00 0 ±0.00 Euphorbia
cyparissias 0 ±0.00 0.1 ±0.51 0.8 ±2.14 0.4 ±0.99 0 ±0.00 0 ±0.00 Medicago
lupulina 1.27 ±1.43 2.6 ±1.59 1.87 ±2.06 0 ±0.00 0.65 ±0.75 0 ±0.00 Siline alba subsp.
longolia 0.67 ±1.67 0 ±0.05 0.33 ±1.67 0.65 ±0.88 0 ±0.00 0 ±0.00 Ononis spinosa 0.13 ±0.35 4.5 ±3.70 4.33 ±3.59 1.2 ±1.23 2 ±1.29 2.1 ±1.80
Taraxacum
officinale 0.93 ±1.09 0.8 ±0.86 0.27 ±0.59 0.2 ±0.89 0.25 ±0.63 0 ±0.00 TZ (DT)
Achillea collina 2.8 ±3.72 5.7 ±3.11 2.93 ±1.94 2.05 ±2.01 2.3 ±0.92 0.6 ±0.10 Bromus mollis 2.87 ±3.13 0.9 ±1.22 0.2 ±0.41 3.2 ±2.56 0 ±0.00 0 ±0.00 Bromus tectorum 0.87 ±1.18 0 ±0.00 1.07 ±1.83 0.1 ±0.44 0 ±0.00 0 ±0.00
Centaurea
pannonica 0.13 ±0.35 0.3 ±0.49 0.13 ±0.52 0.4 ±0.82 4.7 ±3.13 2.6 ±2.28 Cynodon
dactylon 27 ±10.91 6.5 ±5.43 5.2 ±2.85 45 ±18.06 4.95 ±3.39 2.8 ±1.40 Festuca
pseudovina 1.13 ±1.06 13 ±6.81 4.5 ±3.48 0 ±0.00 0.3 ±0.73 1.9 ±1.65 Lolium perenne 9.2 ±10.15 5.7 ±12.56 1.13 ±0.74 6.7 ±6.11 0 ±0.00 0 ±0.00
Plantago
lanceolata 2.2 ±1.56 3.9 ±2.81 2.07 ±1.09 0.9 ±1.02 0.45 ±0.82 0.9 ±0.71 Poa angustifolia 0.93 ±1.27 2.9 ±1.03 8.27 ±4.74 6 ±5.11 0.65 ±1.18 3.7 ±2.36 Trifolium repens 1.2 ±2.62 4.4 ±2.35 1.27 ±1.03 1.85 ±2.34 0.15 ±0.67 0 ±0.00
TZ, GY (DT)
Potentilla reptans 0.1 ±0.35 0.3 ±0.70 1.7 ±1.58 0 ±0.00 0.9 ±0.58 2 ±0.51 Trifolium
pratense 0.3 ±0.70 1.5 ±1.50 1.3 ±1.62 0.3 ±0.78 0.2 ±0.48 0 ±0.44
Table 1. cont.
Species only in
Bugac BA ± SD BB ± SD BC ± SD TA ± SD TB ± SD TC ± SD K, E (C, G)
Astragalus cicer 0.1 ±0.51 1.7 ±1.75 0.1 ±0.35 Astragalus
onobrychis 0 ±0.00 0 ±0.00 0.5 ±0.83 Carex stenophylla 1.5 ±3.87 1.6 ±1.68 0.7 ±0.96 Coronilla varia 0 ±0.00 0.3 ±1.29 0.73 ±1.33
Potentilla
arenaria 0 ±0.00 1.7 ±0.00 0.8 ±0.00 Salvia pratensis 0 ±0.00 0.3 ±1.29 1.2 ±2.83
Thymus
pannonicus 0 ±0.00 1.5 ±3.99 0 ±0.00 TP, NP Bromus
squarrosus 0 ±0.00 0 ±0.00 1.1 ±3.13 Trifolium
campestre 0.67 1.11 2.6 ±2.13 0.67 ±0.97 TZ (DT) Medicago falcata 0.3 ±0.59 1.3 ±1.43 0 ±0.00
Veronica
prostrata 0 ±0.00 0.4 ±0.50 0.5 ±0.51 K, TP (NP, G) Anthemis
ruthenica 0.2 ±0.41 0.6 ±0.63 0.3 ±0.59 Medicago minima 0.5 ±0.83 1.3 ±1.22 0.6 ±0.50 Poa bulbosa 0 ±0.00 0.9 ±1.53 0.7 ±0.70
Potentilla
argentea 0 ±0.00 0.2 ±0.77 0.7 ±0.97 Veronica
chamaedrys 0 ±0.00 0.7 ±0.97 0.9 ±0.63 TP, NP Arenaria
serpyllifolia 1.4 ±1.68 1.1 ±1.50 0.3 ±0.70 GY (RC) Carduus nutans 0.2 ±0.77 0.5 ±1.35 1.1 ±1.22 Species only in
Tatárszentgyörgy BA ± SD BB ± SD BC ± SD TA ± SD TB ± SD TC ± SD K, E (C, G)
Carex distans 0 ±0.00 2 ±1.93 2 ±2.02
Carex flacca 0 ±0.00 1.9 ±1.59 4 ±3.62
Carex panicea 0 ±0.00 0.4 ±0.87 0 ±0.00
Centaurium
erythraea 0 ±0.00 0.7 ±0.67 0 ±0.67
Crataegus
monogyna 0 ±0.00 0.2 ±0.69 1 ±0.68
Genista tinctoria 0 ±0.00 0.1 ±0.44 1 ±0.82
Linum austriacum 0 ±0.00 0 ±0.00 0 ±0.52
Lotus tenuis 0 ±0.00 1.5 ±0.68 1 ±0.44
Mentha aquatica 0 ±0.00 0.6 ±0.88 0 ±0.87
Molinia coerulea 0 ±0.00 0.4 ±0.88 1 ±2.44
Odontites rubra 0 ±0.00 1 ±0.56 0.8 ±0.61
Plantago maritima 0 ±0.00 1.5 ±1.35 2 ±1.29
K (S) Polygala
amarella 0 ±0.00 0.8 ±0.71 1 ±0.71
Table 1. cont
Common species in Bugac and in Tatárszentgyörgy
of B and C zones
BA ± SD BB ± SD BC ± SD TA ± SD TB ± SD TC ± SD
K, E (C, G) Agrostis
stolonifera 0 ±0.00 0.5 ±1.55 0 ±0.00 0 ±0.00 8.2 ±4.79 7 ±5.59 Botriochloa
ischaemum 0 ±0.00 0.3 ±1.29 0 ±0.00 0 ±0.00 0 ±0.00 1 ±1.14 Chrysopogon
gryllus 0 ±0.00 0.9 ±1.84 0 ±0.00 0 ±0.00 0 ±0.00 2 ±2.94 Deschampsia
cespitosa 0 ±0.00 0.4 ±1.54 1.3 ±2.02 0 ±0.00 7.3 ±4.72 10 ±11.60 Galium verum 0 ±0.00 2.6 ±2.52 7.3 ±4.70 0 ±0.00 2.5 ±0.94 2 ±1.06 Serratula tinctoria 0 ±0.00 0.4 ±1.54 2.9 ±2.79 0 ±0.00 6.8 ±3.17 4 ±1.98
Tetragonolobus
maritimus 0 ±0.00 0.4 ±0.73 0.4 ±0.82 0 ±0.00 1.8 ±1.15 2 ±1.68 GY (TC)
Inula britannica 0 ±0.00 0.1 ±0.35 0 ±0.00 0 ±0.00 0.6 ±0.82 0 ±0.73 Ranunculus acris 0 ±0.00 0.1 ±0.25 0 ±0.00 0 ±0.00 1.1 ±0.97 0 ±0.30
Senecio
erucifolius 0 ±0.00 0 ±0.00 0.3 0.72 0 ±0.00 1.2 ±0.95 1 ±0.59 Trifolium
fragiferum 0.3 0.07 0 ±0.00 0 ±0.00 0 ±0.00 1.6 ±1.57 0 ±0.00 TP (NP)
Cerastium
semidecandrum 0 0 1.5 ±1.88 0 ±0.00 0 ±0.00 0 ±1.46
TZ, GY (DT) Bolboschoenus
maritimus 0 ±0.00 0.5 ±1.18 0 ±0.00 0 ±0.00 0.6 ±1.27 1 ±1.46 Dactylis
glomerata 0 ±0.00 2.4 ±2.47 3.3 ±2.46 0.3 ±0.80 1.5 ±1.19 4 ±3.34 Festuca
arundinacea 0 ±0.00 2.3 ±3.08 2.9 ±2.26 0 ±0.00 12 ±6.86 8 ±6.66 Leontodon
hispidus 0 ±0.00 0 ±0.00 0.1 ±0.35 0 ±0.00 0.8 ±0.76 0 ±0.67
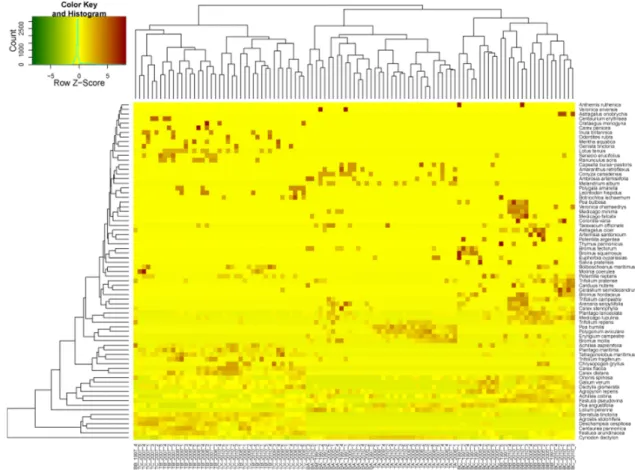
Recordings of both sample areas is shown with application of diagnostic species on Fig. 3. Near to the stable, the “A” coenological recordings were well distinguished.
Records from Tatárszentgyörgy are unitary. From those, “C” areas in 2007 stand apart and and as a single group lodge into “A” zone. In case of Bugac, recordings from “B”
(in 1997) wedge into the values of “A”, the closest quadrates to the stables.
Figure 3. Two-way clustering results of coenological records of Tatárszentgyörgy and Bugac according to diagnostic species
From the two-way ANOVA analysis of coenological records from Bugac (Fig. 4), values from “A” plots were not separated from each other. These recordings are mixed with recordings from “B” from 1997. Sample plots of “B” and “C” overlap as well.
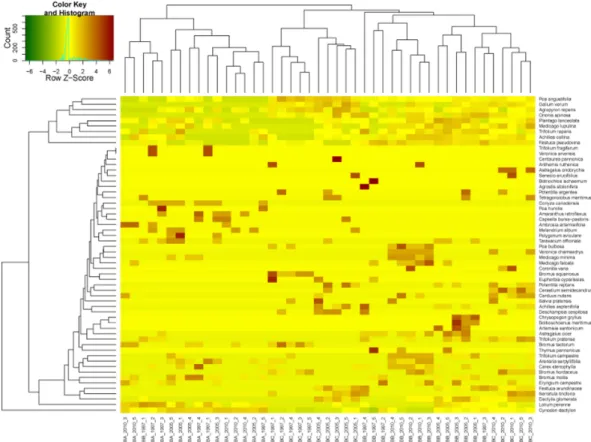
In case of Tatárszentgyörgy, the two-way clustering (Fig. 5) firmly separated plots of
“A” zone. In addition, recordings from “B” zone also appeared in a block. Coenological recordings of “C” zone became divided, while recordings from 2007 formed an intact group enclosed between “A” and “B” zones.
Figure 4. Two-way clustering results of coenological recording according diagnostic species in case of Bugac
Figure 5. Two-way clustering results of coenological recording according diagnostic species in case of Tatárszentgyörgy
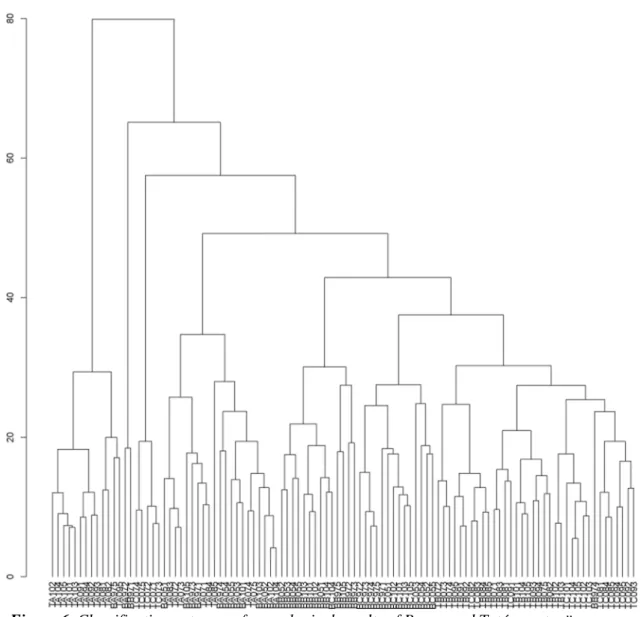
Classification assessment of coenological recordings from Tatárszentgyörgy and Bugac are shown in Fig. 6. According to the results from the classification, most recordings from the “A” zone separated even at 0.8 differential level, while other recordings from “A” zone also separated, at high levels. Around 0.42 differential level, two major groups could be distinguished. From those, the small set contained primarly
“B” recordings from Bugac, while the larger group contained “B” and “C” quadrates from Bugac and Tatárszentgyörgy.
Figure 6. Classification outcome of coenological results of Bugac and Tatárszentgyörgy areas
Fig. 7. shows classification evaluation of coenological recordings from Bugac.
Recordings in case of field “A” separated at 0.6 differential level. “B” recordings from 1997 were enclosed into “A”, just like in the previous section. At 0.3 different level, recording of “B” from 2005 and 2010 are sorted into a common group. Quadrates of
“C” zones are concentrated into one group.
Figure 7. Classification of coenological results from Bugac
Fig. 8. shows classification evaluation of coenological recordings from Tatárszentgyörgy. Dendogram at 0.8 differential level separated two distinct groups.
Group “A” zone formed an integrated block, recordings from group “B” zone were found in the middle block. “C” zone formed two large groups. Recordings from 2007 separate into a single block.
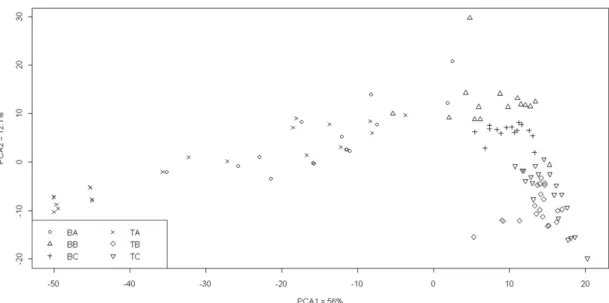
PCA analysis of recordings from Tatárszentgyörgy can be seen in Fig. 9. Results confirm the classification results. Recordings of “A” field formed a long-shot data set, distinct from quadrates of “B” and “C”. In case of Bugac, squares from “B” zone were the closest to “A” areas. This included three “C” recordings, one quadrate from 2009 and two from 2008. The remaining “C” zone was organized sharply into two groups.
Recordings from 2007 were uniformly and completely separated. Recordings of “B”
and “C” zones from Tatárszentgyörgy and Bugac separated.
Figure 8. Classification of coenological results from Tatárszentgyörgy
Figure 9. PCA-ordination of coenological data from Bugac and Tatárszentgyörgy according to the average coverage of quadrates
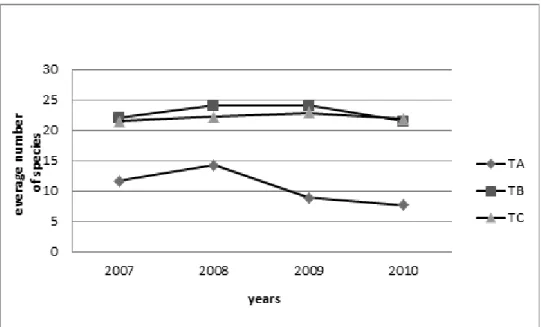
Evolution of number of species can be seen in Table 2-3. and Fig. 10-11. The maximum total number of species occurred in case of Bugac “B”, while Bugac “C”
zone also had a greater number of species then Tatárszentgyörgy “C”. Annual breakdown of the total number of species showed a continuous decline in case of Bugac, while increment could be observed in case of “C” zone. The evolution of average number of species in case of quadrates indicated another trend. Number of species in case of “C” zone was balanced, while in case of “B” zone lower values were typical due to the average number of species, despite the highest number of species can be found here. Values increased during examination.
Table 2. Whole species set of coenological recordings from Bugac in the examined years and number of species from “B” and “C” zones by year.
1997-2010 1997 2005 2010
Bugac A 35
Bugac B 50 38 36 31
Bugac C 47 37 41 38
Figure 10. Coenological results of average number of species in the examined period in case of Bugac
Table 3. Whole species set of coenological recordings from Tatárszentgyörgy in the examined years and number of species from "B" and "C"zones by year.
2007-2010 2007 2008 2009 2010
Tatárszentgyörgy A 23
Tatárszentgyörgy B 39 28 32 30 30
Tatárszentgyörgy C 38 28 27 32 38
Figure 11. Coenological results of average number of species in the examined period in case of Tatárszentgyörgy
According to the Shannon diversity the following was determined:
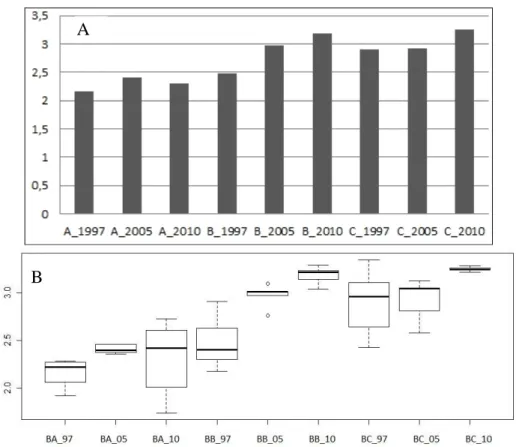
• Every examined year, in zone “A” zone nearest the stable, the diversity was smaller then in fields farther from stable (total year average: 2.291). This value was higher in case of “B” and “C” zone (2.881 and 3.025 respectively). It could be noticed that in all three regions (“A”, “B” and “C” zones) the lowest diversity was in 1997, while diversity in 2005 and 2010 was higher (Fig. 12).
• In Bugac, the diversity did not change significantly in case of “A” zone, it was 2.15, 2.41 and 2.30, respectively. Value of diversity increased moving away from the stable, both in case of “B” zone – it was 2.48, 2.97 and 3.18, and in case of “C” zone – it was 2.89, 2.92 and 3.25.
• Similar conclusions were reached by examining the evolution of the number of species. The smallest number of species was measured in case of “A” field, where high degree of disturbance was exposed. In case of “B” and “C” area, the number of species was higher and increased with time.
• Diversity values of recordings from Tatárszentgyörgy clearly indicate the “A”
zone had the lowest (1.62), while areas located farther from the stable (“B” and
”C” zones) had higher diversity values (2.93 and 2.80) during the examined years (Fig. 13).
• Interestingly in case of “A” zone, a relatively high diversity (2.03 and 2.10) was observed in the first two years (2007 and 2008), which values sharply decreased by 2009 and 2010 (1.32 and 1.03). In the “B” zone, diversity was almost constant during the examined 4 years, while in case of “C” zone it was initially moderate, then in the following 3 years it was high.
Figure 12. Diversity values of sample areas (“A”,”B” and “C” zones) of Bugac A: Shannon-diversity average values, B: results of one-way ANOVA
Figure 13. Diversity values of sample areas (“A”,”B” and “C” zones) of Tatárszentgyörgy A: Shannon-diversity average values, B: results of one-way ANOVA
A
B
A
B
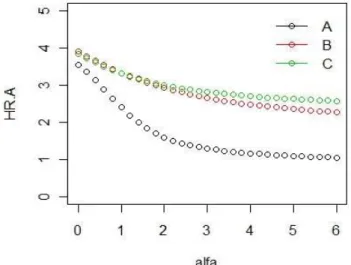
Using Rényi-diversity profile, three distinct types of disturbance clearly separated in case of Bugac. The most disturbed area is “A” zone that also has the lowest diversity values. The curve of fields “B” and “C” zones initially changed together with the same diversity, then later divided at alpha values and diversity of “C” zone – previously less disturbed area – became the highest. In this study, measurements from each year were combined and only the differences between sites and fields were evaluated (Fig. 14-15).
Figure 14. Rényi-diversity profile of Bugac. A - mostly disturbed, B - moderately disturbed, C - the farthest plot from stable, near natural part
Figure 15. Rényi-diversity profile of Tatárszentgyörgy. A - mostly disturbed, B - moderately disturbed, C - the farthest plot from stable, near natural part
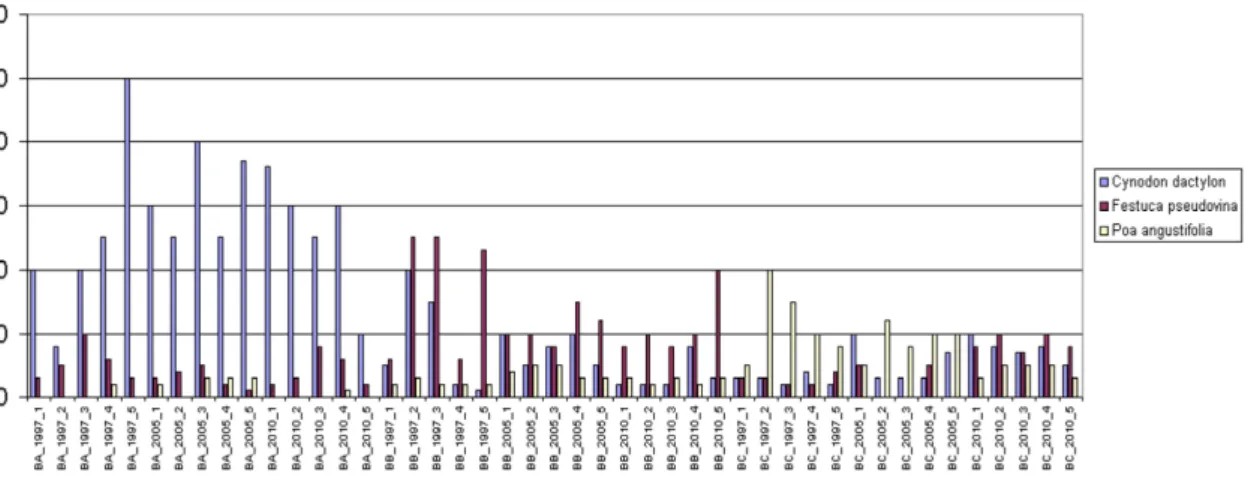
In case of Bugac dry grassland, among important and dominant grasses Cynodon dactylon, Festuca pseudovina and Poa angustifolia occurred, as indicated in Fig. 16.
Cynodon dactylon was found all along, however it reached its maximum in the over- grazed field “A”. Among recordings from field “B” zone in 1997, it was also prevalent in recordings 2 and 3, where its coverage was nearly 20%. Festuca pseudovina occurred
in “B” zone with large coverage values, however, it was common everywhere. The most significant occurrence of Poa angustifolia was in quadrates of field “C” zone in 1997, however, it dropped to 10% by 2005.
Figure 16. Occurrence of dominant grass species in percentages at the examined fields in Bugac (“A”,”B” and “C” zones)
In recordings from Tatárszentgyörgy Cynodon dactylon was also the dominant grass in case of “A” zone. Lolium perenne was also presented at a large proportion (Fig. 17) in case of “A” zone. In Bugac, it also had higher coverage values in “B” zone from 1997.
Figure 17. Occurrence of Lolium perenne in percentages at the examined fields
Figure 18. Occurrence of Festuca arundinacea in percentage at the examined fields
Figure 19. Occurrence of Achillea collina in percentages at the examined fields
The highest coverage values for Festuca arundinacea were measured in case of Tatárszentgyörgy “B” zone. In Bugac, it was only presented in the “B” quadrates in 1997 (Fig. 18). Coverage values for the typical dry grassland species Achillea collina clearly showed high prevalence in Bugac (Fig. 19).
Analysis of ecological and environmental factors
Based on relative values of Borhidi the followings were concluded:
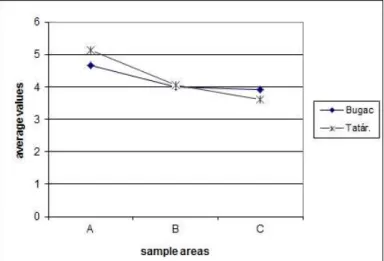
Averages of nitrogen demand (NB) of species reduced moving away from the stable in case of the drier area of Bugac, while nitrogen-loving species multiplied better when located closer to the stable, fertilized and trampled area (Fig. 20). Based on 5-quadrates’
species list, the average nitrogen need showed a decreasing trend moving away from the stable (4.66, 4.00 and 3.91).
Figure 20. Average of relative nitrogen demand in fields of Bugac and Tatárszentgyörgy
Based on the averages of relative water demand (WB) of species, the wettest fields were in the “B” region quadrates in both cases. It is well defined, that areas around the stable had the same values but moving away from it clearly showed that dry habitat species in case of Bugac, while wet habitat species in case of Tatárszentgyörgy became dominant (Fig. 21).
Figure 21. Average of relative water demand in fields of Bugac and Tatárszentgyörgy
Average values of heat demand (TB) clearly indicated that Bugac area was warmer and drier (Fig. 22).
Figure 22. Average of relative heat demand in fields of Bugac and Tatárszentgyörgy
Significant changes can be observed in the distribution of life forms (Fig. 23) for each quadrates of area category. In the “A” sample areas, both in proportion and in the number of species the one-year stems emerging species (T scap) were significant; their amount was the largest in both areas (9 and 8 species). In addition, repent perennial species (H rept) had a large proportion as well. The amount of perennial grass species (H caesp) increased moving away from the stable and together with the amount of perennial emerging-driven (H space wrap) species, they possessed the largest species number. At the “B” zone in Tatárszentgyörgy, the volume of perennial creeping species (H rept) was also significant (13 species).
0 5 10 15 20 25 30 35 40 45 50
BA BB BC TA TB TC
T scap T ros T rept T ces P caesp He H scap H ros H rept H caesp H bienn Ch scap Ch rept
Figure 23. Distribution of life forms in Bugac and Tatárszentgyörgy fields
Analysis based on conservation value categories
Assessment based on social behavior types of Borhidi the natural disturbance tolerants (DT) and ruderal competitor (RC) species had the largest proportion near the animal husbandry sites (“A” zone) (Fig. 24-26). In the same fields, natural pioneers (NP), agressive competitors (AC), competitors (C) and weeds (W) proportion had not changed significantly, however, presence of generalists (G) decreased in the examined three years.
0,0%
20,0%
40,0%
60,0%
80,0%
DT R C NP A C C G W S
1997 (0-50m) 2005 (0-50m) 2010 (0-50m)
Figure 24. The social behaviour type values between 1997 and 2010 in Bugac (0-50 m)
0,0%
20,0%
40,0%
60,0%
80,0%
DT R C NP A C C G W S
1997 (50-150 m) 2005 (50-150 m) 2010 (50-150 m)
Figure 25. The social behaviour type values between 1997 and 2010 in Bugac (50-150 m)
B u g ac 150 m- (S B T )
0,0%
20,0%
40,0%
60,0%
80,0%
DT R C NP A C C G W S
1997 (150 m-) 2005 (150 m-) 2010 (150 m-)
Figure 26. The social behaviour type values between 1997 and 2010 in Bugac (150 m -)
The presence of ruderal competitors (RC) was lower in the following region categories (“B” zone), however, DT had an unchanged proportion. Competitors (C), generalists (G) and specialists (S) were presented in greater species numbers.
Distribution of the third field category ("C" zone) was nearly identical, except that weeds (W) appeared again, which were not presented in 50-150 m distance from the stable (“B” zone).
Assessment based on natural protection categories of Simon, disturbance tolerant species (TZ) were presented in 50% in the 0-50 m distance category, however their presence increased to 70% in 2010 (Fig. 27-29).
0,0%
20,0%
40,0%
60,0%
80,0%
TZ K G Y TP E Z V
1997 (0-50m) 2005 (0-50m) 2010 (0-50m)
Figure 27. The nature protection value categories between 1997, 2005 and 2010 in Bugac (0-50 m)
0,0%
20,0%
40,0%
60,0%
80,0%
TZ K G Y TP E Z V
1997 (50-150 m) 2005 (50-150 m) 2010 (50-150 m)
Figure 28. The nature protection value categories between 1997 and 2010 in Bugac (50-150 m)
0,0%
20,0%
40,0%
60,0%
80,0%
TZ K G Y TP E Z V
1997 (150 m-) 2005 (150 m-) 2010 (150 m-)
Figure 29. The nature protection value categories between 1997 and 2010 in Bugac (150 m -)
Proportion of weeds was initially around 40%, then their presence decreased. Species that suggested natural conditions were presented in minimal quantities near the stable in all three examined years. TZ species attended in middle field category ("B" zone) in the largest quanity.
Proportion of W species evolved around 20%, together with dominant species (E), accompanying species (K) and natural pioneers (TP). In the farthest category (“C”
zone), the proportion of species referring to natural conditions was the largest, however, protected species (V) were not presented in Bugac either year.
According to Borhidi values, in the category “A” zone of Tatárszentgyörgy, DT and RC species were presented in the largest proportion (Fig. 30-32). While proportion of the former decreased, the latter increased during the examined years. Presence of weeds was low in the same place.
0,0%
20,0%
40,0%
60,0%
80,0%
100,0%
DT RC NP AC C G W S Su
2007 (0-50m) 2008 (0-50m) 2009 (0-50m) 2010 (0-50m)
Figure 30. Social behaviour type values between 2007 and 2010 in Tatárszentgyörgy (0-50 m)
(SBT)
0,0%
10,0%
20,0%
30,0%
40,0%
DT RC NP AC C G W S Su
2007 (50-150 m) 2008 (50-150 m) 2009 (50-150 m) 2010 (50-150 m)
(SBT)
0,0%
10,0%
20,0%
30,0%
40,0%
DT RC NP AC C G W S Su
2007 (50-150 m) 2008 (50-150 m) 2009 (50-150 m) 2010 (50-150 m)
Figure 31. Social behaviour type values between 2007 and 2010 in Tatárszentgyörgy (50 -150 m)
0,0%
10,0%
20,0%
30,0%
40,0%
50,0%
60,0%
70,0%
DT RC NP AC C G W S Su
2007 (150 m-) 2008 (150 m-) 2009 (150 m-) 2010 (150 m-)
Figure 32. Social behaviour type values between 2007 and 2010 in Tatárszentgyörgy (150 m -)
In case of “B” zone, DT species were presented in a large proportion, however, instead of stress tolerant RC, the presence of G, S and C species was common. Both the proportion of C and G decreased until 2009, then increased in 2010.
Recordings from “C” zone indicate that quantities based on social behaviour types developed similarly to the “B” zone. The proportion of C exceed the volume of DT in 2007, however, this condition was not characteristic for measurements of other years (Figure 25-27). Determinative species were C, G and S species.
0,0%
10,0%
20,0%
30,0%
40,0%
50,0%
60,0%
70,0%
80,0%
90,0%
TZ K GY TP E Z V
2007 (0-50m) 2008 (0-50m) 2009 (0-50m) 2010 (0-50m)
Figure 33. The nature protection value categories in Tatárszentgyörgy (0-50 m)
(TVK)
0,0%
10,0%
20,0%
30,0%
40,0%
50,0%
TZ K GY TP E Z V
2007 (50-150 m) 2008 (50-150 m) 2009 (50-150 m) 2010 (50-150 m)
(TVK)
0,0%
10,0%
20,0%
30,0%
40,0%
50,0%
TZ K GY TP E Z V
2007 (50-150 m) 2008 (50-150 m) 2009 (50-150 m) 2010 (50-150 m)
Figure 34. The nature protection value categories in Tatárszentgyörgy (50-150 m)
0,0%
10,0%
20,0%
30,0%
40,0%
50,0%
60,0%
TZ K GY TP E Z V
2007 (150 m-) 2008 (150 m-) 2009 (150 m-) 2010 (150 m-)
Figure 35. The nature protection value categories in Tatárszentgyörgy (150 m -)
Classification of natural protection categories developed similarly to social behavior characterization (Fig. 33-35). In the “A” zone, TZ species occurred in the largest quantities. Proportion of weeds was nerly 30%, however, their ratio decreased below 9% by 2010. Associate (K) and dominant (E) species appeared in the examined period, which refers to the natural state.
The volume of those was more significant in case of “B” region. The proportion of TZ species were 30%, smaller then the proportion in the “A” zone, while weeds showed lower shares. TZ species were presented in the largest proportion in 2008, while K species in 2007. Weeds and disturbance tolerant species appeared in smaller ratio.
Dominant species reached 30% by 2010.
Discussion
Based on species composition and vegetation composition
Stable close “A” zones were rich in weed species, which occurred because of strong over-grazing and significant trampling (Wilson and MacLoad, 1991). From graminea species, only Poa humilis appeared on this kind of areas. This race – and similarly on other Pannonian over-grazed areas (Szentes et al., 2007, 2009a, 2009b; Penksza et al., 2009) – is an indicator of over-grazing, however, a characteristic species of ruderal fields as well (Penksza and Böcker, 1999/2000). General occurring species in the coenological recordings – one fourth of diagnostic species – were weeds or disturbance tolerant species, which clearly implies interference of the fields (Simon, 1988).
However, specific and natural species of the arid grassland of Bugac, sandy grassland and wet ground of Tatárszentgyörgy are presented, and their presence is dominant in number of species and coverage. Besides commonly occurring species, ratio of both weeds and disturbance tolerant species were small. Grazing did not modify race composition significantly – against the preliminary hipothesis – as composition of vegetation did not change dominantly and irreversibly. Several publications confirmed that grazing has its positive effects on both species composition and the number of species (Noy-Meir et al., 1989; Fernández-Alès et al., 1993; Hadar et al., 1999; Tóth et al., 2003; Fischer and Wipf, 2002; Catorci et al., 2009, 2011).
Recordings from Bugac sample area are seemingly contradictory, since a number of species continuously decreased during the examined time in case of ”B” zone. The reason could be that there was a change in grazing type (from free to switch grazing) in 2001. Previously, higher species number could occur, because of higher ratio of weeds.
Free grazing was applied until 2000, and until that time the natural vegetation declined and the volume of weeds increased due to greater trampling and over-grazing. This was confirmed by several authors (Szentes et al., 2007, 2009a, 2009b; Penksza et al., 2009).
The total number of species was high, however, the average number of species and species number of quadrates were low. This resulted from that each quadrates were greatly different; the stability of vegetation was weak, and the ratio of smaller constancy species was high in the examined area (Whittaker, 1965, 1975; Adler and Lauenroth, 2000; Peco et al., 2006). Higher species number occurred because of the arid character of the area in case of Bugac, since these values were usually smaller in wetter regions of Great Hungarian Plain (Borhidi, 2003; Herczeg et al., 2006; Kiss et al., 2006; Penksza et al., 2009). In case of Bugac, the species number was low in “C” zone – practically it was an abandoned area in 1997. This confirmed the results of several other publications, in which a decrease of species number was reported in case of abandoned fields (Smith
and Rushton, 1994). According to several publications, appropriate grazing favors species enrichment (Huston, 1994; Proulx and Mazumder, 1998; Pykälä et al., 2005).
According to Losvik (1999), species enrichment is attenuated by the discontinuation of grazing and mowing. This was confirmed by Smith and Rushton (1994) too, since according to them, plant species richness and species diversity is lower in ungrazed areas than in grazed areas. Our study confirms this as well.
The volume of grasses increased during grazing (McNaughton and Chapin, 1985).
This was easily tracked down in different zones, however, a remarkable variance was measured in case of dominant species. Coverage of disturbance tolerant Cynodon dactylon was notable in the “A” zone, while the also disturbance tolerant Festuca pseudovina was notable in case of "B" zone in both of the areas. Other disturbance tolerant species, Festuca arundinacea and Molinia coerulea, specific to wet areas, showed high coverage values in Tatárszentgyörgy. These appeared in higher rate in the
“B” zone of Tatárszentgyörgy, as an effect of grazing pressure. It is also demonstrating that grazing increases quantity of grasses (McNaughton and Chapin, 1985; Catorci et al., 2011).
Based on diversity values
Diversity values increased away from the stable and this was specific in both cases (“B” and “C” zones). This indicated that with moderation of disturbance might natural regeneration processes come into view and succession complexity of association increase (Tóthmérész, 1995; Virágh and Bartha, 1996; Barbaro et al., 2001; Pykälä et al., 2005). Similar conclusion could be reached by examining the developement of species numbers. In case of major disturbance (“A” zone), stochastic processes come into view, sortedness becomes smaller and the evolution of species number becomes less predictable, however, measured data scattered heavily (Tóthmérész, 1995; Luoto et al., 2003; Házi et al., 2011). Change in species number shows positive correlation with time in the other two farther zones so it is increasing monotonically in time, similarly to our expectations. Although the number is not a completely reliable criterion of the association, comparing the observed diversities of the two metrics shows a complementary and reliabile increase (Virágh and Bartha, 1996; Luoto et al., 2003;
Pykälä et al., 2005; Házi et al., 2011).
Diversity profiles of Rényi showed similar tendencies in both cases thus confirmed that grazing exhibits similar effects in both wet and dry Pannonian grasslands. These values were higher in case of drier areas, which confirmed that due to intensive grazing, drier areas preserve species richness, thereby more appropriate for grazing. In the “A”
zone, the low management pressure led to an increase in diversity and this is consistent with literature data (Bakker, 1989; Tóthmérész, 1995; Nösberger et al., 1998;
Kampmann et al., 2007).
Based on ecology and environmental factors
According to the relative ecology values, species occurring in the “A” zone were high nitrogen demanding species, which is caused by trampling and manuring by livestock (Penksza et al., 2009a, 2009b). In both “B” and “C” zones, grazing intensities were smaller – smaller level of trampling and manuring – thus it resulted in the appearance of smaller nitrogen demanding species (Penksza et al., 2009a, 2009b).
According to the relative water need (WB), “B” zone was the wettest in both of the
sample areas. In the “B” zone of Tatárszentgyörgy, species from wet areas dominated, represented by the high water demand Carex species (Borhidi, 1995; Simon, 2000).
According to relative heat demand of species (TB), Bugac area had dry grassland vegetation features, since each zones consisted of species that are typical in warmer climate areas. The largest difference was in the case of “B” zone that contained species from wetter (Tatárszentgyörgy) areas, which were species of cooler areas (Carex ssp., Mentha aquatica, Molinia coerulea).
According to life form distributions, there are significant differences between quadrates of area categories. Besides annuals (T scap), creeping perennials (H rept) were significant both in number of species and percentage. These proliferated because of intensive grazing (Gatti et al., 2007; Catorci et al., 2011). In “A” zone, the annual and rosulate form species there was no significantly higher coverage value compared to the other two zones. This is conflicting previous studies (Kahmen and Poschlod, 2008;
Catorci et al., 2011). The amount of annual grassland species (H caesp) showed similarity with previous studies (Gatti et al., 2007; Sebastià et al., 2008), since their amount increased moving away from the yard in grazing exposed zones. Perennial reptan (H rept) species amount was significant in “A” zone of Tatárszentgyörgy as well, which showed the effects of intensive grazing (Gatti et al., 2007; Sebastià et al., 2008).
Evaluation based on nature protection value categories
In the conservation evaluation, “A” zones showed richness in weed and disturbance tolerant species, similarly to stable close areas of Pannonian grasslands (Penksza et al., 2009a, 2009b). In drier grasslands (Bugac), from the aspect of natural protection criteria, stronger grazing led to a more valuable vegetation in the “B” zone. Nature protection and diversity values increased in “C” zones as well, however, these values were below the values of “B” zones. Its reason could be the change in management, since free grazing was converted to switch grazing, thereby the grazing pressure became uneven in both “B” and “C” zones. According to the data, preservative grass composition developement can occur father from yard with smaller grazing pressure.
Conclusions
In the examined dry (Bugac) and wet (Tatárszentgyörgy) vegetations, species composition totally changed in “A” zones due to intensive trampling and grazing and degraded into a characterless areas. The other two zones of vegetation were not homogenised due to grazing. Specific species of arid and wet areas remained and preserved their significant coverage. Diagnostic species showed that vegetation of the two different areas reacted to grazing in a different way. While the Bugac area was capable of tolerating higher pressure independently from the distance, until in “B” zone of Tatárszentgyörgy a significant change could be observed in the volume of disturbance indicator species because of grazing.
Environmental background well expressed by relative ecological. Based on this, the ratio of degradation indicator species was high as far as 50 m from the stable in both examined places. However, in case of farther areas – more than 50 m from the stable –, the ratio of species referring to natural conditions was great. In recordings close to the yard (0-50 m), only weeds (W) and disturbance tolerant (DT) species were presented.
50-150 m distance from the yard, natural vegetation forming generalist and competitors
remained, and according to this, this particular distance is suitable enough to sustaine grass composition for long-term.
With the decrease of grazing intensity, the examined fields would fit to natural protection claims. Compliance for natural protection claims can be realised in “B” zone in case of dry grassland – and “C” zone – in case of wet grassland. Grazing, as environmental protection treatment, has an important role in preservation of biodiversity, however, can-not be applied generally and universally for wet and dry grasslands or for fields close together. In conclusion, a rather careful planning and accuracy is necessary. According to the result of this study, grazing – besides mowing – can become an indispensable method of environmental protection and restoration ecology (van Wieren, 1991, Wallis De Vries, 1995, Bakker and Londo, 1998; Cosyns and Hoffmann, 2004; Kramberger and Kaligarič, 2008).
Acknowledgements. This paper is partly based on our work carried out during the EU funded project
“Indicators for biodiversity in organic and low-input farming systems” (BIOBIO FP7-2009-227161).
Further details are available at www.biobio-indicator.org. This work was supported by the Bolyai János Research Scholarship of MTA Doctoral Council, „ALÖKI” Applied Ecological Research and Forensic Institute Ltd., and the TÁMOP 4.2.1/B-09/1/KMR-2010-0005 project.
REFERENCES
[1] Adler, P.B., Lauenroth, W.K. (2000): Livestock exclusion increases the spatial heterogeneity of vegetation in Colorado shortgrass steppe. – Applied Vegetation Science 3: 213-222.
[2] Aiken, G.E. (1990): Plant and animal responses to a complex grass-legume mixture under different grazing intensities. – Dissertation Abstracts International 51(3): 1045.
[3] Anderson, P., Radford, E. (1994): Changes in vegetation following reduction in grazing pressure on the National Trust’s Kinder Estate, Peak District, Derbyshire, England. – Biological Conservation 69: 55-63.
[4] Bakker, J.P. (1989): Nature Management by Grazing and Cutting. – Kluwer Academic Publishers, Dordrecht
[5] Bakker, J.P., Olff, H., Willems, J.H., Zobel, M. (1996): Why do we need permanent plots in the study of long-term vegetation dynamics? – J. Veg. Sci. 7: 147-156.
[6] Bakker, J.P., Londo, G. (1998): Grazing for conservation management in historical perspective. – In: Wallis De Vries, M.F., Bakker, J.P., van Wieren, S. E. (eds.) Grazing and conservation management. pp. 23-54. Dordrecht: Kluwer Academic Publishers.
[7] Bakker, J.P., Olff, H., Willems, J.H., Zobel, M. (1996): Why do we need permanent plots in the study of long-term vegetation dynamics? – J. Veg. Sci. 7: 147-156.
[8] Barbaro, T., Dutoit, T., Cozic, P. (2001): A six-year restoration of biodiversity by shrub- clearing and grazing in calcerous grasslands of the French Prealps. – Biodiversity and Conservation 10: 119-135.
[9] Borhidi, A. (1995): Social behaviour types, the naturalness and relative ecological indicator values of the higher plants in the Hungarian flora. – Acta Botanica Academiae Scientiarum Hungaricae 39: 97-181.
[10] Borhidi, A. (2003): Magyarország növénytárulásai. – Akadémiai Kiadó, Budapest [11] Braun-Blanquet, J. (1964): Pflanzensoziologie – 3. Aufl. Wien, Springer-Verlag
[12] Brizuela, M.A., Cid, M.S. (1993): Initial signs of overgrazing in a heterogeneous pasture under continuous grazing by sheep. – Revista Argentina de Produccion Animal. 13: 61- 70.