DOI: 10.1556/204.2019.41.1.4
SURVIVAL, GROWTH, AND PERFORMANCE OF HUNGARIAN INTERNATIONAL NEW VENTURES
MIKLÓS STOCKER
Department of Business Studies, Corvinus University of Budapest, Hungary Email: miklos.stocker@uni-corvinus.hu
There is a growing debate in the literature about International New Ventures (INV). Survival of INVs – along with their growth and fi nancial performance – seems to be an interesting phenom- enon, but it has only been tackled in a small sample of studies. This study examines Hungarian INVs and some of their key characteristics in the years 2009–2014. The Hungarian Corporate Tax Database was used to analyse the entire population of Hungarian companies during that period. The database consists of 385,723 companies in 2009 and 422,500 companies in 2014, and comprises the whole Hungarian private sector. Of these companies, 6,547 can be identifi ed as INVs in the pe- riod under analysis. In this paper, the survival, growth, and business performance characteristics of Hungarian INVs are examined. Hungarian INVs recorded an exceptionally high survival rate; after fi ve business years, 70% of the INVs remained in business, but nearly half of them withdrew to the home market, which means that only 35% of the Hungarian INVs became Sustainable International New Ventures (SINVs). Hungarian SINVs employed on average about 25 employees, registered extremely high (around 75%) export intensity, had steadily growing earnings and equity (43.6%
and 56.3% mean CAGR), showed a stable return on equity of about 10% after their fi rst year in existence, and created added value of approximately 37,000 EUR per employee.
Keywords: International New Ventures, survival, growth, fi nancial performance, Hungarian companies.
JEL-codes: M130, M160, F230
1. INTRODUCTION
Among newly founded companies, failure rates are usually high, but the probabil- ity of survival is higher for those companies that can enter foreign markets soon after their inception. Companies that internationalize early can contribute signifi- cantly more to their domestic economy because they have higher growth rates, profitability, and survival rates than companies that follow the staged models of internationalization after similar inception. International New Ventures (INVs), therefore, are very important to national economies, as these companies can fuel innovation and growth in addition to contributing to an increased GDP. Not all International New Ventures are destined for success; therefore, the examination of INVs can be crucial in understanding the characteristics and discovering the indicators which can differentiate them, in order to identify and facilitate those enterprises which can become the Sustainable INVs that will contribute the most to their national economy.
Survival of INVs (along with their growth and financial performance) seems to be an interesting phenomenon, but it has been tackled only in a small sample of studies. This study examines Hungarian INVs and their key characteristics and financial performance in the years 2009–2014. The Hungarian Corporate Tax Database was used to analyse the whole population of Hungarian companies in that five-year period. The database consists of 385,723 companies from 2009 and 422,500 companies from 2014, and comprises the entire Hungarian private sec- tor. Of these companies, 6,547 could be identified as International New Ventures.
This paper examines the characteristics and business performance of INVs, dif- ferentiating between those that are Sustainable (SINV), Withdrawn (WINV) and Terminated (TINV).
The relevant literature will be reviewed to provide an overview of the INV concept and to focus on identified research gaps. After the research gaps, the data and methods of the research will be introduced, which will be followed by the empirical findings of the research with all explorative tables and distributions in the results section. In the discussion section, the different types of Hungarian INVs will be compared to each other, which will be followed by the conclusions of the study and further research possibilities.
2. LITERATURE REVIEW
Although several authors have written on the internationalization of young firms, INVs came into the spotlight of international research after the seminal article of Oviatt and McDougall (1994). According to their definition, an INV is “a busi-
ness organization that, from inception, seeks to derive significant competitive advantage from the use of resources and the sale of outputs in multiple countries”
(Oviatt – McDougall 1994: 49).
Such companies internationalize very soon after they come into existence and therefore do not follow the usual process of internationalization of multinational enterprises (MNE), e.g. according to the stage theory of Johanson and Vahlne (1977; 2009). The basic idea behind the formulation of INVs is that resourceful entrepreneurs with international experience or vision try to combine international market opportunities with the efficient application of resources.
These companies pursue a proactive international strategy, and, because of their age and financial constraints, they cannot focus on entry modes with foreign direct investment. Instead, they join networks or alliances and focus on opportu- nities and value added (Oviatt – McDougall 1994). “The genesis of INVs’ com- petitive advantages appears to lie in their founders’ cognitions that allow them to quickly spot opportunities in international markets and develop new ways to exploit them” (Zahra 2005: 22).
Therefore, most of the competitive advantage of INVs comes from their explo- ration and exploitation of opportunities in the external environment. Zahra (2005) realizes, however, that an INV can also gain a competitive advantage from its organizational form.
In fact, INVs can be born exactly because an MNE is slow to answer an in- ternal opportunity to reconfigure its processes to better serve its internal and/or external clients, and therefore some of its managers leave the company to create an INV that serves the given need with improved processes.
Flexibility and quickness can be the most important advantages that INVs can muster; however, scarcity of resources and relative anonymity are their most im- portant barriers to overcome.
Studies in the 80s and 90s considered the increasing ease of international trade to be due to improvements in communication and transportation, and these enablers of globalization are even more pronounced today. These enablers are important for exploring opportunities, but, to exploit these opportunities well, managers should build on their existing international experience. Therefore, as both of these types of enablers became more and more abundant in the 2010s, theoretically the number of INVs should have increased significantly.
Although Oviatt and McDougall’s (1994) different types of INVs have re- ceived more attention in the literature, their argument about the necessary and sufficient elements for sustainable INVs is also very important. With advanced information technology and a large body of data from the 2010s, it is possible to calculate the different categories in this model.
Figure 1 shows that those INVs which have access to, or control over unique resources are able to become Sustainable INVs (SINV). INVs are important to both the national economy and the global economy, but SINVs are even more important.
According to the framework of Oviatt and McDougall (1994), SINVs utilize both tangible and intangible resources to create value in more than one country.
As resource scarcity is one of their constraints, INVs often do not own necessary resources, but join networks or use other forms of control besides ownership. It is also assumed that INVs tend to be found in greater numbers in those industries where unique knowledge is a dominant characteristic.
First step on the path to becoming sustainable is basic survival. Therefore, re- search on survival of International New Ventures is relevant. Zahra (2005) identi- fies a research gap both in the survival of the different types of INVs as well as in the survival of INVs relative to other companies, whether old or new.
Survival issues are critical to INVs, because they face three liabilities: new- ness, smallness, and foreignness. Their newness might bring into question their credibility and viability, and if inexperience is a factor, then there might be prob- lems in gaining access to certain markets and networks. Smallness is often ac- companied by a lack of both resources and established processes, and therefore organizational issues can steal time from primary value-creating activities. For- eignness can lead to difficulties in market entry and acceptance by consumers.
These liabilities, in various combinations, can doom the survival of INVs (Zahra 2005).
Figure 1. Necessary and sufficient elements for sustainable international new ventures Source: Oviatt – McDougall (1994: 54).
EconomicTransactions
Element1:
Internalization ofSome Transactions
EconomicTransactions Organizations
EconomicTransactions Organizations Element2:
Alternative Governance Structures
NewVentures
…
…
EconomicTransactions Organizations NewVentures International NewVentures Element3:
Foreign Location Advantage
Element4:
Unique Resources
EconomicTransactions Organizations NewVentures Int.NewVentures
Sustainable International NewVentures
Mudambi and Zahra (2007) suggest that survival, not profitability, is the im- portant question in INV research, and based on the research of others (Caves 1998; Klepper 2002; Zimmerman – Zeitz 2002), they state that the probability of failure is highest in a firm’s early years, and then usually declines as the company ages.
Based on 275 British companies from the 1990s, Mudambi and Zahra (2007) found that 18% of the companies in their sample were INVs, about 71% of them survived in the period under analysis (1991–96), 47% of them competed in high- tech industries, the average growth rate of industries in the sample was 5.3%, and about 10% of the companies’ sales came from exports. Units created by estab- lished firms have significantly higher chances of survival than INVs, but if the INV explicitly incorporates its strategic choices into its business model, then the survival probability will be similar to that of the former.
Based on a new study of venture survival in the manufacturing sector, Puig et al. (2014) found that INVs’ survival rates are higher than those of domestic new ventures, which is moderated by the efficiency of activity and location. Age, however, was not a decisive factor. In the traditional manufacturing sector, new ventures operating in international markets have higher survival rates than their purely domestic counterparts; hence internationalization has a positive impact on the survival of new ventures.
Deng et al. (2014) examined a large sample of Chinese manufacturing firms with data from the years 1998–2008 (altogether 170,396 exporters) and found that innovation has a negative effect on exporter survival, especially when an exporter has high outstanding receivables, does not have foreign ownership, or has weak profitability. But if an exporter is highly profitable, then innovation still promotes survival in the export market.
Mudambi and Zahra (2007) identified the research gap in surviving INVs’
growth, profitability, and other indicators of financial performance, and Zahra (2005) pointed to the lack of research on the evolution of INVs. “[T]he learn- ing advantages that INVs have relative to others (Autio et al., 2000; Zahra et al., 2000; Zahra, 2005; Sapienza et al., 2006) might magnify surviving INVs’ profit- ability and other indicators of financial performance” (Mudambi – Zahra 2007:
348).
The country of origin of INVs can be also a topic for research, as it can in- fluence the resource base of the founders and their financial and political sup- port, not to mention the cultural issues of the home country. Mudambi and Zahra (2007) also suggest that country-related variables can influence the international entry mode of new ventures, and the cultural distance (foreignness) of the coun- tries where the INV conducts business can reduce its probability of survival.
On the other hand, governmental support for entering foreign markets, like subsidized financing via state influenced export-import banks, or offering market knowledge through consultants or incubators, can have a strong positive impact on survival, and entering countries with significantly higher purchasing power can lead to higher profitability, which also has a positive influence on chance of survival.
Gerschewski and Xiao (2015) examined 310 firms from New Zealand and Aus- tralia to assess INVs’ performance. Financial performance (economic, account- ing and market outcome-based performance indicators), operational performance (product-market and process outcome-based indicators), and overall organisa- tional effectiveness (reputation, survival, and perceived overall performance) and their effects were studied for INVs and non-INVs. According to the results, INVs had on average 23.4 employees, compared to 28.5 for non-INVs. Export intensity three years after the establishment of the INVs was 71.6%, with only 5.9% for non-INVs. These INVs were operating in the service sector (38.8%), manufac- turing (27.2%), and other sectors (34% in e.g. agriculture, fishing, and forestry).
Gerschewski and Xiao (2015) also found that the greatest difference between INVs and non-INVs is that INVs are much more focused on international per- formance. In addition, INVs put much more emphasis on financial performance over other performance domains than do non-INVs.
Industry can also influence performance of INVs, as Zahra (2005) identified a research gap in this regard, and Gerschewski and Xiao (2015)suggested that industry does matter in terms of international performance measurement.
3. DATA AND METHODS
In this paper, the basic characteristics of Hungarian INVs are examined, and their survival and growth rates are analysed. The whole Hungarian private sector was analysed by using the complete Hungarian Tax Database from the Hungarian Tax Authority over six years (2009–2014). This database includes basic financial statements and some additional tax data for all companies that employ double- entry accounting. However, since INVs are the focus, the period taken for analy- sis is only five years, as we considered only those companies which were born in 2010 or later and registered exports in their first year of existence (see Table 1).
Therefore, INVs will be operationalized as those companies that registered ex- port revenues in their first year of business. Companies that did not register ex- port sales but made outward FDI in the year of their inception were excluded from this research, but this left out only a tiny fraction of the companies.
As exploratory research to understand the characteristics of Hungarian INVs, the data of their whole population will be shown with respect to their survival, their growth, and their financial performance from 2010–2014.
INVs follow three very distinctive patterns, according to their survival charac- teristics. Those INVs which were still serving foreign markets in their fifth year of existence (at the end of the period under analysis) will be called Sustainable International New Ventures (SINVs). Those companies which ceased to exist during the period of analysis will be designated as Terminated International New Ventures (TINVs), and a third group will be Withdrawn International New Ven- tures (WINVs), those surviving companies that withdrew into the home market.
One-way ANOVA tests were conducted to analyse the significance of the dif- ferences between these groups of INVs, which serve as factors for different de- pendent variables. Scheffe tests were conducted to analyze post-hoc tests of mul- tiple comparisons. All tests were done with IBM SPSS Statistics 25.0.
4. RESULTS
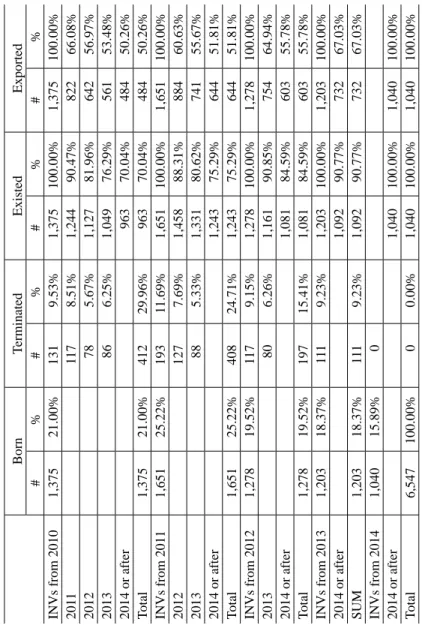
According to the survival rates of INVs, it is interesting that not only exits, but de-internationalization and withdrawal to the home market is an empirical phe- nomenon, as can be seen in Table 2.
Approximately 90% of INVs survive their first year of existence, and of the whole population of Hungarian INVs, around 80% survive the second year, 75%
the third year, and 70% the fourth year. And these numbers do not vary much regardless of their year of inception of the INV. Of the INVs founded in 2010, 70% still existed in 2014, but only 50% of them registered export sales. The 70%
survival rate after five years is better than expected, but 50% of the remaining companies had withdrawn to the home market after five years, which is very interesting. This means that after five years, only 35% of new INVs remained
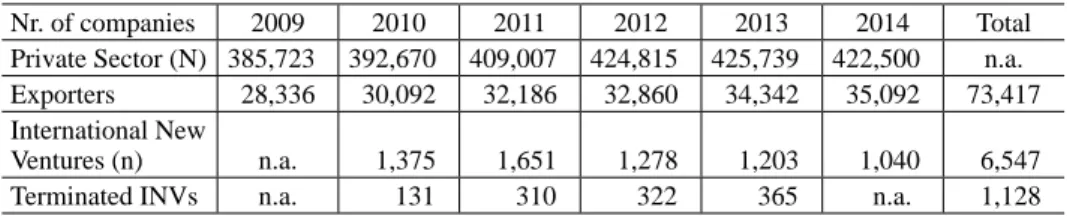
Table 1. Population of Hungarian firms in the private sector, International New Ventures, and Terminated INVs
Nr. of companies 2009 2010 2011 2012 2013 2014 Total
Private Sector (N) 385,723 392,670 409,007 424,815 425,739 422,500 n.a.
Exporters 28,336 30,092 32,186 32,860 34,342 35,092 73,417 International New
Ventures (n) n.a. 1,375 1,651 1,278 1,203 1,040 6,547
Terminated INVs n.a. 131 310 322 365 n.a. 1,128
Source: author’s calculations.
Table 2. Birth, termination, and withdrawal to home market of Hungarian INVs BornTerminatedExistedExported #%#%#%#% INVs from 20101,37521.00%1319.53%1,375100.00%1,375100.00% 2011 1178.51%1,24490.47%82266.08% 2012 785.67%1,12781.96%64256.97% 2013 866.25%1,04976.29%56153.48% 2014 or after96370.04%48450.26% Total1,37521.00%41229.96%96370.04%48450.26% INVs from 20111,65125.22%19311.69%1,651100.00%1,651100.00% 2012 1277.69%1,45888.31%88460.63% 2013 885.33%1,33180.62%74155.67% 2014 or after1,24375.29%64451.81% Total1,65125.22%40824.71%1,24375.29%64451.81% INVs from 20121,27819.52%1179.15%1,278100.00%1,278100.00% 2013 806.26%1,16190.85%75464.94% 2014 or after1,08184.59%60355.78% Total1,27819.52%19715.41%1,08184.59%60355.78% INVs from 20131,20318.37%1119.23%1,203100.00%1,203100.00% 2014 or after1,09290.77%73267.03% SUM1,20318.37%1119.23%1,09290.77%73267.03% INVs from 20141,04015.89%0 2014 or after1,040100.00%1,040100.00% Total6,547100.00%00.00%1,040100.00%1,040100.00% Source: author’s calculations.
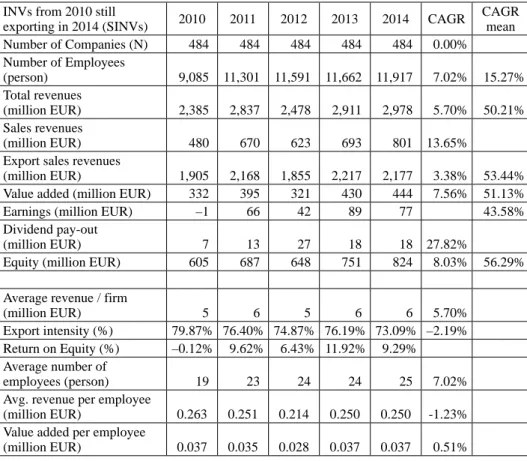
international. Altogether, 484 companies of the 1,375 INVs that were established in Hungary in 2010 could be classified as SINVs, and their business performance and growth rates are shown in Table 3.
These companies employed 9,000 persons in 2010 and 11,900 in 2014, which is a 7% annual growth rate in the total number of employees, but the mean com- pounded annual growth rate of these companies was 50.21%. The difference arises because the smaller companies grew much faster than the larger ones, and
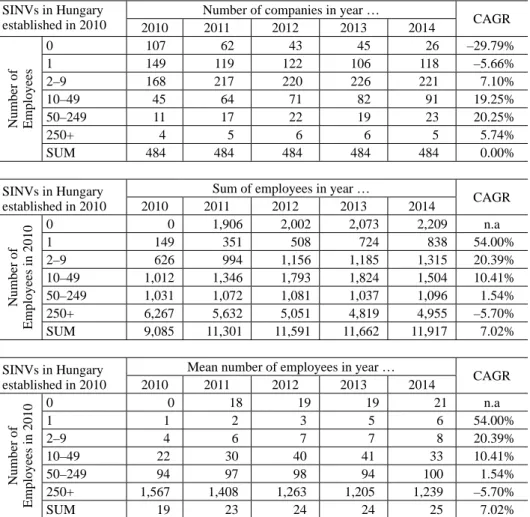
CAGR cannot be calculated for companies that started with zero employees. The number of companies and number of employees according to EU company size definitions can be seen in Table 4.
Micro, small, and medium Hungarian SINVs founded in 2010 grew steadily in the period under analysis. The number of companies which were without em- ployees diminished rapidly in the same period, and the number of companies with only one employee also decreased, but mainly because of growth; many were
“promoted” to other categories. The number of companies employing 2–9 em- ployees increased with a 7.1% CAGR (168 to 221), but the number of small and medium enterprises increased significantly, with 19.25% and 20.25% CAGRs, respectively (they more than doubled their numbers, from 45 small enterprises to 91, and from 11 medium enterprises to 23). The number of large companies increased until 2013, but then decreased in 2014 (from four to six, then to five).
Table 3. Business performance of Hungarian Sustainable International New Ventures INVs from 2010 still
exporting in 2014 (SINVs) 2010 2011 2012 2013 2014 CAGR CAGR mean
Number of Companies (N) 484 484 484 484 484 0.00%
Number of Employees
(person) 9,085 11,301 11,591 11,662 11,917 7.02% 15.27%
Total revenues
(million EUR) 2,385 2,837 2,478 2,911 2,978 5.70% 50.21%
Sales revenues
(million EUR) 480 670 623 693 801 13.65%
Export sales revenues
(million EUR) 1,905 2,168 1,855 2,217 2,177 3.38% 53.44%
Value added (million EUR) 332 395 321 430 444 7.56% 51.13%
Earnings (million EUR) –1 66 42 89 77 43.58%
Dividend pay-out
(million EUR) 7 13 27 18 18 27.82%
Equity (million EUR) 605 687 648 751 824 8.03% 56.29%
Average revenue / firm
(million EUR) 5 6 5 6 6 5.70%
Export intensity (%) 79.87% 76.40% 74.87% 76.19% 73.09% –2.19%
Return on Equity (%) –0.12% 9.62% 6.43% 11.92% 9.29%
Average number of
employees (person) 19 23 24 24 25 7.02%
Avg. revenue per employee
(million EUR) 0.263 0.251 0.214 0.250 0.250 -1.23%
Value added per employee
(million EUR) 0.037 0.035 0.028 0.037 0.037 0.51%
Source: author’s calculations.
Of those companies founded in 2010, companies employing only one person saw their average number of employees increase to six. Likewise, companies originally employing 2–9 persons usually doubled their number of employees, and small enterprises increased by an average of 50%. Medium-sized Hungarian SINVs established in 2010 did not increase their number of employees signifi- cantly, and large enterprises decreased their number of employees by 20% from 2010 to 2014. The most interesting category consisted of 107 companies that had no employees in 2010 but had 2,209 employees in 2014. Hungarian SINVs which were established in 2010 employed an average of 19 employees in 2010, which increased to 25 in 2014.
Table 4. Number of SINVs and number of employees by company size SINVs in Hungary
established in 2010
Number of companies in year …
2010 2011 2012 2013 2014 CAGR
Number of Employees
0 107 62 43 45 26 –29.79%
1 149 119 122 106 118 –5.66%
2–9 168 217 220 226 221 7.10%
10–49 45 64 71 82 91 19.25%
50–249 11 17 22 19 23 20.25%
250+ 4 5 6 6 5 5.74%
SUM 484 484 484 484 484 0.00%
SINVs in Hungary established in 2010
Sum of employees in year …
2010 2011 2012 2013 2014 CAGR
Number of Employees in 2010
0 0 1,906 2,002 2,073 2,209 n.a
1 149 351 508 724 838 54.00%
2–9 626 994 1,156 1,185 1,315 20.39%
10–49 1,012 1,346 1,793 1,824 1,504 10.41%
50–249 1,031 1,072 1,081 1,037 1,096 1.54%
250+ 6,267 5,632 5,051 4,819 4,955 –5.70%
SUM 9,085 11,301 11,591 11,662 11,917 7.02%
SINVs in Hungary established in 2010
Mean number of employees in year …
2010 2011 2012 2013 2014 CAGR
Number of Employees in 2010
0 0 18 19 19 21 n.a
1 1 2 3 5 6 54.00%
2–9 4 6 7 7 8 20.39%
10–49 22 30 40 41 33 10.41%
50–249 94 97 98 94 100 1.54%
250+ 1,567 1,408 1,263 1,205 1,239 –5.70%
SUM 19 23 24 24 25 7.02%
Source: author’s calculations.
Total revenues of the 484 Hungarian SINVs increased by 5% compounded annually, but the mean CAGR was more than 50%. Export sales increased with only a 3.4% CAGR, but the mean CAGR was more than 53%. From these growth rates, it can be seen that the smaller companies grew significantly their sales rev- enues and export sales, but all SINVs together produced only 25% total revenue growth. These growth measurements were calculated in Euros (EUR), but as the Hungarian Forint (HUF) inflated more than 12% in the period of analysis, total revenues in HUF grew by 40%.
It is interesting to note that sales growth in the home market was much higher (14% compounded annual growth rate) than export sales growth (3.4%), which is connected with the small basis of revenues coming from the home market, but the increase of export revenues were less in absolute terms as well (increases of 271 million EUR in export sales and 321 million EUR in domestic sales revenues).
Hungarian SINVs established in 2010 had extremely high export intensities.
In the year of their inception, the weighted export intensity was 79.9%, with a mean export intensity of 50.2%, which later decreased to 73% and 47.3%, re- spectively.
The value added of Hungarian SINVs grew with a 7.6% weighted annual growth rate, with 51.1% mean CAGR, however, value added/employee meas- urements remained the same: 37,000 EUR per annum, with some slight fluctua- tions.
Taken altogether, Hungarian SINVs established in 2010 registered losses in their first year of business, but their total earnings turned positive in 2011 and in- creased significantly year by year with a 43.6% mean CAGR in earnings. The eq- uity of SINVs was altogether 605 million EUR in their first year, which increased to 824 million EUR (8% weighted CAGR) with a 56.3% mean CAGR in equity.
As earnings and equity rose together, the return on equity stabilized at 9–11%.
From the number of employees, export revenues, sales revenues, and value added indicators, it can be concluded that Hungarian SINVs have been success- ful, rapidly growing young companies with some room for improvements in ef- ficiency.
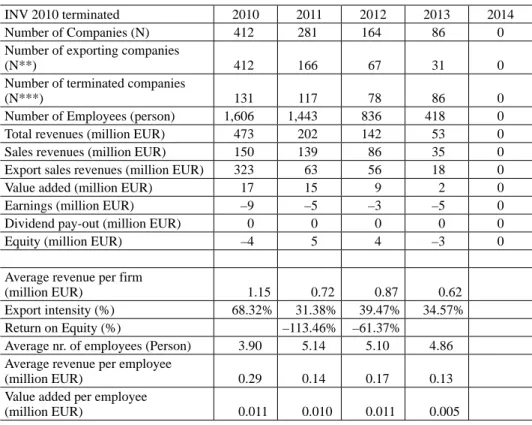
The business performance of those Hungarian INVs which terminated in the period of analysis can be seen in Table 5. A significant number of Hungarian INVs went out of business in each year. The average number of employees of these TINVs was very low, 3.9 to 5.1 persons per company. The value added per employee indicator is also very low, at around 100 thousand EUR per person.
Taken together, the TINVs registered losses in every year, which turned the weighted equity of these companies to negative in 2013. Negative earnings with negative equity is the common road to bankruptcy. Altogether, 412 INVs went out of business before their fifth year of existence.
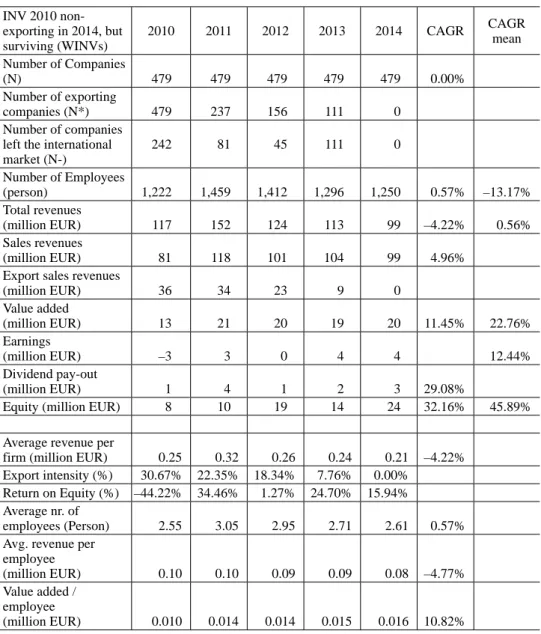
The business performance of those Hungarian INVs which withdrew to the Hungarian market (WINVs) in the period of analysis can be seen in Table 6.
There were 479 companies which started as INVs in 2010 but subsequently left the international market. Of these, 242 registered their last export sales in 2010, 81 and 41 registered their last export sales in 2011 and 2012, respectively, and 111 companies exported for four years, but their last exports occurred in 2013.
Taken together, the WINVs employed on average 2.5 to 3 persons per compa- ny in the period under analysis. Their export sales revenue shrank steadily, from 36 million EUR to zero, but their domestic sales revenue only increased with a 5% compounded annual growth rate, with a significant increase after their first year of existence and a steady decrease from 2011 on. The average revenue per employee decreased steadily, with a –4.8% CAGR.
The export intensity of Hungarian WINVs established in 2010 was 30% in the year of their founding, decreasing steadily to 22.4% in 2011, 18.3% in 2012, and
Table 5. Business performance of Hungarian International New Ventures which terminated by 2014
INV 2010 terminated 2010 2011 2012 2013 2014
Number of Companies (N) 412 281 164 86 0
Number of exporting companies
(N**) 412 166 67 31 0
Number of terminated companies
(N***) 131 117 78 86 0
Number of Employees (person) 1,606 1,443 836 418 0
Total revenues (million EUR) 473 202 142 53 0
Sales revenues (million EUR) 150 139 86 35 0
Export sales revenues (million EUR) 323 63 56 18 0
Value added (million EUR) 17 15 9 2 0
Earnings (million EUR) –9 –5 –3 –5 0
Dividend pay-out (million EUR) 0 0 0 0 0
Equity (million EUR) –4 5 4 –3 0
Average revenue per firm
(million EUR) 1.15 0.72 0.87 0.62
Export intensity (%) 68.32% 31.38% 39.47% 34.57%
Return on Equity (%) –113.46% –61.37%
Average nr. of employees (Person) 3.90 5.14 5.10 4.86 Average revenue per employee
(million EUR) 0.29 0.14 0.17 0.13
Value added per employee
(million EUR) 0.011 0.010 0.011 0.005
Source: author’s calculations.
7.8% in 2013, before all these companies completely withdrew into the Hungarian market. Their mean export intensity also decreased from 46% to 41% between 2010 and 2013. The value added and value added per employee of WINVs in- creased, with more than 11.5% and 10.8% CAGR, respectively.
Table 6. Business performance of Hungarian International New Ventures which withdrew to the Hungarian market by 2014
INV 2010 non- exporting in 2014, but surviving (WINVs)
2010 2011 2012 2013 2014 CAGR CAGR
mean Number of Companies
(N) 479 479 479 479 479 0.00%
Number of exporting
companies (N*) 479 237 156 111 0
Number of companies left the international market (N-)
242 81 45 111 0
Number of Employees
(person) 1,222 1,459 1,412 1,296 1,250 0.57% –13.17%
Total revenues
(million EUR) 117 152 124 113 99 –4.22% 0.56%
Sales revenues
(million EUR) 81 118 101 104 99 4.96%
Export sales revenues
(million EUR) 36 34 23 9 0
Value added
(million EUR) 13 21 20 19 20 11.45% 22.76%
Earnings
(million EUR) –3 3 0 4 4 12.44%
Dividend pay-out
(million EUR) 1 4 1 2 3 29.08%
Equity (million EUR) 8 10 19 14 24 32.16% 45.89%
Average revenue per
firm (million EUR) 0.25 0.32 0.26 0.24 0.21 –4.22%
Export intensity (%) 30.67% 22.35% 18.34% 7.76% 0.00%
Return on Equity (%) –44.22% 34.46% 1.27% 24.70% 15.94%
Average nr. of
employees (Person) 2.55 3.05 2.95 2.71 2.61 0.57%
Avg. revenue per employee
(million EUR) 0.10 0.10 0.09 0.09 0.08 –4.77%
Value added / employee
(million EUR) 0.010 0.014 0.014 0.015 0.016 10.82%
Source: author’s calculations.
The earnings of WINVs were negative in 2010, and only became slightly posi- tive from 2011–2014. Dividends payed out were also very low (between 1 and 4 million EUR). However, the equity of WINVs increased significantly in the period of analysis, as WINV companies managed to triple their equity from 8 million EUR in 2010 to 24 million EUR in 2014, an average of 50,000 EUR per company, with a 32.2% weighted CAGR and a 45.9% mean CAGR. Return on equity of the Hungarian WINVs established in 2010 fluctuated, but remained positive after their first year of operation (34.5% in 2011, 1.3% in 2012, 24.7%
in 2013, 16% in 2014).
According to these measurements, those Hungarian INVs which were estab- lished in 2010 and survived until 2014 but could not remain in the export market in the period of analysis, were very small companies with an average of 2.5–3 employees, selling mostly to the domestic market, with fluctuating profitability.
These companies increased their efficiency significantly, as their value added per employee increased steadily, with a 10.8% compounded annual growth rate, to 16,000 EUR per year.
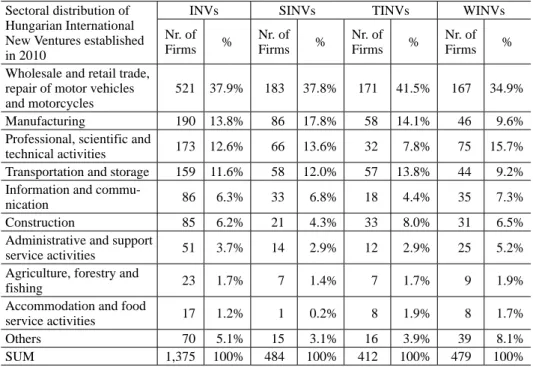
The sectoral distribution of Hungarian INVs established in 2010 can be seen in Table 7.
Table 7. Sectoral distribution of Hungarian International New Ventures established in 2010 Sectoral distribution of
Hungarian International New Ventures established in 2010
INVs SINVs TINVs WINVs
Nr. of
Firms % Nr. of
Firms % Nr. of
Firms % Nr. of
Firms %
Wholesale and retail trade, repair of motor vehicles and motorcycles
521 37.9% 183 37.8% 171 41.5% 167 34.9%
Manufacturing 190 13.8% 86 17.8% 58 14.1% 46 9.6%
Professional, scientific and
technical activities 173 12.6% 66 13.6% 32 7.8% 75 15.7%
Transportation and storage 159 11.6% 58 12.0% 57 13.8% 44 9.2%
Information and commu-
nication 86 6.3% 33 6.8% 18 4.4% 35 7.3%
Construction 85 6.2% 21 4.3% 33 8.0% 31 6.5%
Administrative and support
service activities 51 3.7% 14 2.9% 12 2.9% 25 5.2%
Agriculture, forestry and
fishing 23 1.7% 7 1.4% 7 1.7% 9 1.9%
Accommodation and food
service activities 17 1.2% 1 0.2% 8 1.9% 8 1.7%
Others 70 5.1% 15 3.1% 16 3.9% 39 8.1%
SUM 1,375 100% 484 100% 412 100% 479 100%
Source: author’s calculations.
The largest category of Hungarian INVs established in 2010 was the Whole- sale and retail trade, repair of motor vehicles and motorcycles sector, with more than third of the total number. More than 10% of the companies were operat- ing in Manufacturing (13.8%); Professional, scientific, and technical activities (12.6%); and Transportation and storage (11.6%).
This is a significant difference according to sectoral distribution (F = 8.977, p = 0.000), but a Scheffe test shows that the difference is only significant between Withdrawn INVs and the other two groups (p = 0.000 for SINVs versus WINVs, and p = 0.017 for TINVs versus WINVs), which can be interpreted as Sustainable INVs and Terminated INVs were established in similar sectors, but Withdrawn INVs which survived were established in different sectors.
The largest categories for SINVs were the Wholesale and retail trade, repair of motor vehicles and motorcycles sector, Manufacturing, and Transportation and storage. In the Professional, scientific, and technical activities and Information and communication sectors, significantly more companies withdrew to the do- mestic market than became terminated after leaving the international market. And in the Construction sector, most of the Hungarian INVs established in 2010 were terminated.
5. DISCUSSION
Out of 1,375 INVs established in 2010 in Hungary, 484 can be designated as Sustainable INVs, as they not only remained international but grew in several important capacities. In all, 412 companies (TINVs) ceased to exist in the five- year period under analysis, and 479 companies (WINVs) survived but withdrew into the home market.
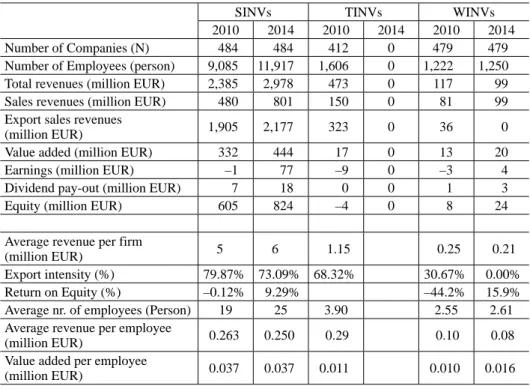
There are extreme differences between successful INVs and those that just barely remain in business or cease to exist (see Table 8). There is a significant dif- ference according to the number of employees in the different clusters (ANOVA test results: F = 3.685, p = 0.025). SINVs started with 19 employees on average, but WINVs only started with 2.5, and TINVs with 3.9 persons. SINVs increased their employees by six persons on average, (with more than 2,800 employees among the 484 companies), but WINVs could not increase their number of em- ployees significantly, and of course TINVs had to let go all their 1.606 average employees.
In total revenues, the mean compounded annual growth rate of SINVs in 2010–
2014 was an astonishing 50.21%, whereas the WINVs could only register 0.56%
mean CAGR (the difference is significant: F = 106.5, p = 0.000). In weighted CAGR of total revenues, the SINVs registered 5.7%, whereas WINVs suffered at
–4.22%. This means larger INVs grew at a much slower rate than smaller ones, and SINVs had a significantly higher growth rate than WINVs.
These relative growth rates are also true for value added, earnings, and equity.
According to value added per employee, SINVs created around 2.5 to 3 times greater value added per employee than WINVs and TINVs, and the mean com- pounded annual growth rate of value added was 51.13% for SINVs, but only 22.76% for WINVs. In 2010, value added per employee of SINVs was signifi- cantly different than that of the other two groups of companies (F = 8.362, p = 0.000), although the difference between the value added per employee of TINVs and WINVs was not significant (Scheffe test, p = 0.851). In 2014, value added per employee of SINVs was significantly higher than that of WINVs (F = 8.879, p = 0.003). Withdrawn INVs increased their value added per employee by cutting their export sales and became profitable.
Export intensities of SINVs and WINVs were also very different. SINVs had around 75% export intensity (but with a –2% CAGR), but WINVs started with
Table 8. Comparison of business performance indicators by clusters of Hungarian INVs established in 2010
SINVs TINVs WINVs
2010 2014 2010 2014 2010 2014
Number of Companies (N) 484 484 412 0 479 479
Number of Employees (person) 9,085 11,917 1,606 0 1,222 1,250
Total revenues (million EUR) 2,385 2,978 473 0 117 99
Sales revenues (million EUR) 480 801 150 0 81 99
Export sales revenues
(million EUR) 1,905 2,177 323 0 36 0
Value added (million EUR) 332 444 17 0 13 20
Earnings (million EUR) –1 77 –9 0 –3 4
Dividend pay-out (million EUR) 7 18 0 0 1 3
Equity (million EUR) 605 824 –4 0 8 24
Average revenue per firm
(million EUR) 5 6 1.15 0.25 0.21
Export intensity (%) 79.87% 73.09% 68.32% 30.67% 0.00%
Return on Equity (%) –0.12% 9.29% –44.2% 15.9%
Average nr. of employees (Person) 19 25 3.90 2.55 2.61
Average revenue per employee
(million EUR) 0.263 0.250 0.29 0.10 0.08
Value added per employee
(million EUR) 0.037 0.037 0.011 0.010 0.016
Source: author’s calculations.
only a 30% export intensity, which rapidly shrank. The export intensities of TINVs are very interesting, as they registered an aggregate 68% export intensity in their first year of existence, which immediately fell to 31% in the next year, and then they went out of business step by step. Regarding return on equity, it is interesting to note that it fluctuated wildly for SINVs and WINVs alike, but TINVs could never register a positive ROE.
These sales revenue, export revenue, and export intensity measurements show that, while Hungarian SINVs were established for foreign market opportunities, as they accumulated experience they could increase their presence in the home market as well. These companies could grow significantly in their number of employees.
6. CONCLUSIONS
From 2010 to 2014, there were 6,547 companies established in Hungary which could be identified as International New Ventures. Hungarian INVs have had exceptionally good survival rates; approximately 90% survived the first year, 80–85% survived the second year, around 75% survived the third year, and more than 70% survived their fourth year of existence.
Hungarian INVs can be categorized into three groups, Sustainable (35% of INVs established in 2010), Terminated (30%), and Withdrawn (35%). Hungarian SINVs employed around 25 employees on average, registered extremely high export intensity (around 75%), had steadily growing earnings and equity (43.6%
and 56.3% mean CAGR), and stabilized their return on equity at around 10% after their first year of existence, and they created added value of around 37 thousand EUR per employee. The mean compounded annual growth rate of Hungarian SINVs was 53.4% for export revenues, 50% for sales revenues, and 15.3% for number of employees. The number of employees of micro SINVs grew rapidly, with a 54% compounded annual grow rate (from 775 to 4,362). Small SINVs in- creased their number of employees by a 10% CAGR; medium SINVs had a stable number of employees; and large SINVs decreased with a –5.7% annual growth rate, laying off 1,312 employees altogether.
For further research, the different groups of INVs can be investigated further by means of qualitative case interviews and surveys to gain a deeper understand- ing of the driving factors of their performance.
REFERENCES
Autio, E. – Sapienza, H. J. – Almeida, J. G. (2000): Effects of Age at Entry, Knowledge Intensity, and Imitability on International Growth. Academy of Management Journal 43(5): 909–924.
Caves, R. E. (1998): Industrial Organization and New Findings on the Turnover and Mobility of Firms. Journal of Economic Literature 36(4): 1947–1982.
Deng, Z. – Guo, H. – Zhang, W. – Wang, C. (2014): Innovation and Survival of Exporters: A Con- tingency Perspective. International Business Review 23(2): 396–406.
Gerschewski, S. – Xiao, S. S. (2015): Beyond Financial Indicators: An Assessment of the Meas- urement of Performance for International New Ventures. International Business Review 24(4):
615–629.
Johanson, J. – Vahlne, J. E. (1977): The Internationalization Process of the Firm – A Model of Knowledge Development and Increasing Foreign Market Commitments. Journal of Interna- tional Business Studies 8(1): 23–32.
Johanson, J. – Vahlne, J. E. (2009): The Uppsala Internationalization Process Model Revisited:
From Liability of Foreignness to Liability of Outsidership. Journal of International Business Studies 40(9): 1411–1431.
Klepper, S. (2002): Firm Survival and the Evolution of Oligopoly. RAND Journal of Economics 33(1): 37–61.
Mudambi, R. – Zahra, S. A. (2007): The Survival of International New Ventures. Journal of Inter- national Business Studies 38(2): 333–352.
Oviatt, B. M. – McDougall, P. P. (1994): Toward a Theory of International New Ventures. Journal of International Business Studies 25(1): 45–64.
Puig, F. – González-Loureiro, M. – Ghauri, P. N. (2014): Internationalisation for Survival: The Case of New Ventures. Management International Review 54(5): 653–673.
Sapienza, H. – Autio, E. – George, G. – Zahra, S. (2006): The Effect of Early Internationalization on Firm Profi tability and Growth. Academy of Management Review 31(4): 914–933.
Zahra, S. – Ireland, D. R. – Hitt, M. (2000): International Expansion by New Venture Firms: Inter- national Diversity, Mode of Market Entry, Technological Learning and Performance. Academy of Management Journal 43(5): 925–950.
Zahra, S. A. (2005): A Theory of International New Ventures: A Decade of Research. Journal of International Business Studies 36(1): 20–28.
Zimmerman, M. – Zeitz, G. (2002): Beyond Survival: Achieving New Venture Growth by Building Legitimacy. Academy of Management Review 27(3): 414–431.
Open Access. This is an open-access article distributed under the terms of the Creative Commons Attribution 4.0 International License (https://creativecommons . org/licenses/by/4.0), which permits unrestricted use, distribution, and reproduction in any medium, provided the original author and source are credited, a link to the CC License is provided, and changes – if any – are indicated. (SID_1)