Improving Barcode Detection with Combination of Simple Detectors
P´eter Bodn´ar and L´aszl´o G. Ny´ul
Department of Image Processing and Computer Graphics University of Szeged
Arp´ad t´er 2., H-6720 Szeged, Hungary´ Email:{bodnaar, nyul}@inf.u-szeged.hu
Abstract—Barcode detection is required in a wide range of real-life applications. Imaging conditions and techniques vary considerably and each application has its own requirements for detection speed and accuracy. In our earlier works we built barcode detectors using morphological operations and uniform partitioning with several approaches and showed their behaviour on a set of test images. In this work, we examine ensemble efficiency of those simple detectors using various aggregation methods. Using a combination of several simple features localization performance improves significantly.
Keywords-barcode detection; computer vision; clustering;
feature extraction; morphological filters; distance transfor- mation; Hough transformation
I. INTRODUCTION
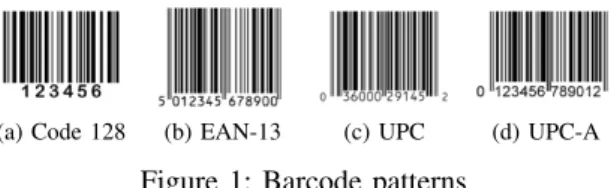
Barcodes are 1D codes that consist of a well-defined group of parallel lines aiming easy automatic identification of carried data with endpoint devices such as PoS termi- nals, smartphones, or computers. Barcode decoding is fast and most barcode standards provide redundant information for error correction purposes. 2D codes are also referred to as barcodes, but in this paper we restrict ourselves only to codes like those showed in Fig. 1. Our proposed method can be extended to detect 2D barcodes as well using minor modifications to the features, however, we compare them with the state of the art only on 1D barcodes due to the lack of widely accepted 2D barcode databases.
(a) Code 128 (b) EAN-13 (c) UPC (d) UPC-A
Figure 1: Barcode patterns
Barcode localization methods have two main objectives, speed and accuracy. On smartphones, fast detection of barcodes is desirable, but accuracy is not so critical since the user can easily reposition the camera and repeat the scan. Accuracy is critical for industrial environment (e.g. postal services), where false negatives cause loss of profit. Speed is also a secondary desired property in those applications. We define two objectives for the localization task. On one hand, we need to detect image parts that contain possible barcodes and maximize the recall, thus no codes will be missed by the detector. On the other hand, we have to give a bounding rectangle with a reasonably
tight fitting that can be forwarded to the detectors. The localization step is the difficult part of general barcode usage and once localization is completed, decoding the barcode is relatively straightforward.
For 1D barcodes, the basic approach for localization is scanning only one, or just a couple of lines of the whole image. This is common for hand-held PoS laser scanners or smartphone applications. Scanned lines form an 1D intensity profile, and barcode-detector algorithms [1]–[3]
work on these profiles to find an ideal binary function that represents the original encoded data. The main idea is to find peak locations in blurry barcode models, then thresholding the intensity profile adaptively to produce binary values.
Valley tracing (or bar tracing) [1] is a method for finding barcodes in blurry, low resolution images, mostly on live smartphone camera frames. It consists of three steps. At first, we find starter points on the pictures, then follow the
“valleys”, and finally, recognize the ends of the valleys (bars).
Algorithms with morphology [4]–[9] use the combina- tion of basic morphological operations like erosion and dilation. White blobs on these images show the possible barcode locations. Further processing, like segmentation and filtering of small blobs are required on these difference images. It can be used on both 1D and 2D barcodes.
Our work also involves morphology for efficient barcode localization.
Methods based on wavelet transformation [10] look at images for barcode-like appearance by a cascaded set of weak classifiers. Each classifier working in the wavelet domain narrows down the possible set of barcodes, decreasing the number of false positives while trying to keep the best possible accuracy.
Variants of Hough transformation [11] detect barcodes by working on the edge map of the image. The two most common methods are standard and probabilistic Hough transformation. Both transform edge points into Hough space first, and make decisions about line locations. We are also experimenting with the idea of probabilistic Hough transformation extended with decisions about the features at higher levels of hierarchy.
Other methods use various types of image filtering, like Kalman or Gabor-filters [12].
II. PROPOSEDBARCODELOCALIZATIONAPPROACHES
In this section we introduce several different approaches for barcode localization. In most cases we examine the im- age in small, disjoint tiles, and make local measurements.
We use distance transformation [13] and contrast variance for these measurements. Code parts, like other textures, have well-traceable features. One of them is neighbour similarity, which means, code parts in close proximity share similar local statistics with a well-chosen tile size.
Thanks to the repeating patterns in the codes we can detect codes by observing how many code-like image parts (tiles) can be found. Lastly, we have to mention compactness of code parts, which influences the final decision about code localization. We also consider contrast information of the tiles and examine the number of clusters at pixel level.
With probabilistic Hough transformation, single lines of barcodes can be detected for further processing. Clustering those lines helps to decide whether a line is part of a barcode.
The idea of Local Clustering [4] can also be applied at pixel level. We use this measure based on the number and shape of pixel clusters.
Lastly, processing the barcode as a whole with morpho- logical operations also leads to high accuracy and forms a considerable base of more complex barcode localization algorithms. We used MIN–MAX [4] as one of the detec- tors.
The results of these detectors can be aggregated in many ways, like majority voting, using the maximum value of all, or weighted voting. Each approach is appropriate for different goals. Majority voting can be applied with good results when the single detectors have relatively low precision with a moderate or high recall rate. We can classify pixels with higher certainty that way, while keeping false positives at low rate. Using the maximum value of the feature images produced by the individual detectors is good for maximizing the recall e.g. detecting all possible ROIs, but it dramatically decreases precision when the single detectors are weak on that property.
However, we can use that approach in industrial setups, where detecting all barcode locations is crucial. We can also experiment with weighted sum of the feature images.
Since we want to maximize recall in that case, too, we examined the separate recall values of each simple detector based on only one feature, then used that value as their weight for the ensemble decision. Our detectors are based on Hough transformation, distance transformation, contrast measuring, local clustering, and MIN–MAX. The proposed method is summarized at Algorithm 1.
A. Preprocessing
Digital images acquired from a camera often need preprocessing because of device flaws or environmental difficulties. In images having low contrast, intensity levels should be normalized. We also use unsharp masking, which is the weighted addition of the original image pixel intensities to the negated pixel values of the Gaussian- blurred version of the image. The blurring Gaussian filter
is adjusted to not to destroy the narrowest line of the barcode, which parameter can be estimated by the specific endpoint application. Since some features need to be extracted from binary images, thresholding is necessary. A simple threshold is sufficient on images with even lighting, otherwise adaptive threshold [14] is required.
Image resolution does not have to be high, barcodes having the narrowest line of two pixels is sufficient (3 × 3px median filters can be applied to eliminate salt-and-pepper noise). Higher resolution yields to better results, but also increases computation time. The least time-consuming solution for downsampling such images is the nearest neighbour interpolation, which is also a good choice because it preserves strong edges. However, at least 3 px minimum line width is desired for accurate code detection.
B. Line Detection using Hough Transformation
This method applies general image processing methods like Canny edge detection [15] and Probabilistic Hough transform [16], as barcodes consist of roughly equally long, parallel lines in a small area. It gives a probabilis- tic estimation for detecting straight lines with the help of a subset of the edge points of the original image, outperforming the standard Hough transform [17]. For preprocessing, we use a blur filter since smooth images are desired for the Canny edge detector. Since all barcodes in the test suite have at least 50 px bar height, we set the minimum line length to 40 px in the Hough transformation to give a reasonable margin.
After we obtain a list of lines with their center point, length, and orientation, we can group them to decide whether they constitute a barcode or not. We define the minimum number of lines, the proximity needed for the lines to be in the same group, and the tolerance for length and orientation from the means within the group. Since our barcodes consist of at least 25 parallel lines, we defined the minimum number of lines as 20 px (again, to give a reasonable tolerance). In the final step, group centers are returned, and the image can be cropped for decoding with known barcode decoding implementations (Fig. 2).
C. Uniform Partitioning with Distance Transformation Most barcodes, like regular textures, can be easily identified by observing only small parts of them. These barcode parts together form the desired barcode region with known height and width. The first part of the method is partitioning the image into square tiles and look at each tile for barcode-like appearance. Each tile is assigned a value that indicates the grade of the presence of this feature. Globally, a matrix is formed from these values.
Texture parts have similar local statistics in their neigh- bourhood, so searching this matrix for compact areas of similar values defines image ROIs representing barcodes with high possibility.
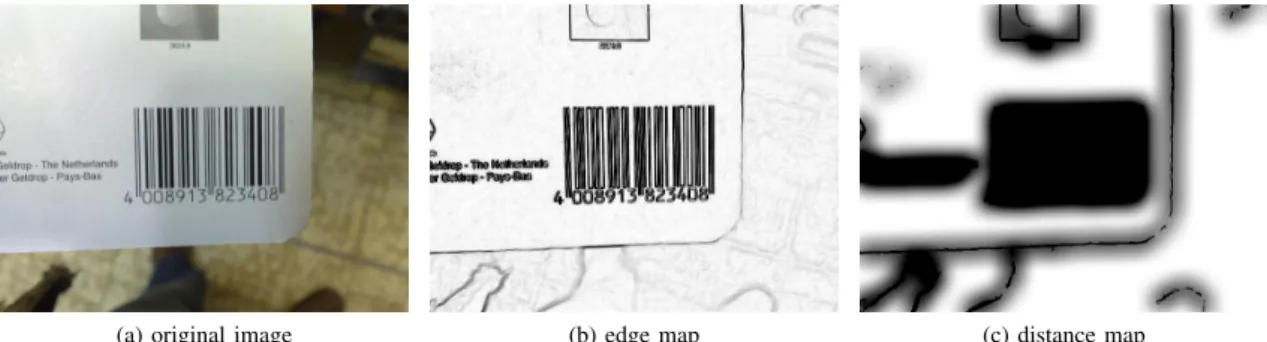
The assigned value showing barcode-like appearance is based on distance transformation of the edge map (Fig. 3).
We apply the Canny edge detector for providing the point
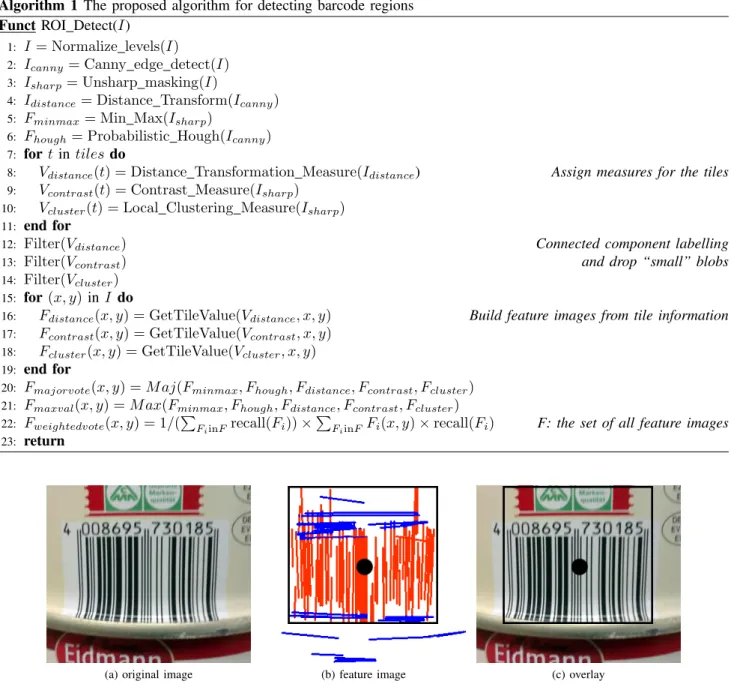
Algorithm 1 The proposed algorithm for detecting barcode regions Funct ROI Detect(I)
1: I= Normalize levels(I)
2: Icanny= Canny edge detect(I)
3: Isharp= Unsharp masking(I)
4: Idistance= Distance Transform(Icanny)
5: Fminmax= Min Max(Isharp)
6: Fhough= Probabilistic Hough(Icanny)
7: fort intilesdo
8: Vdistance(t) = Distance Transformation Measure(Idistance) Assign measures for the tiles
9: Vcontrast(t) = Contrast Measure(Isharp)
10: Vcluster(t) = Local Clustering Measure(Isharp)
11: end for
12: Filter(Vdistance) Connected component labelling
13: Filter(Vcontrast) and drop “small” blobs
14: Filter(Vcluster)
15: for(x, y)inI do
16: Fdistance(x, y) = GetTileValue(Vdistance, x, y) Build feature images from tile information
17: Fcontrast(x, y) = GetTileValue(Vcontrast, x, y)
18: Fcluster(x, y) = GetTileValue(Vcluster, x, y)
19: end for
20: Fmajorvote(x, y) =M aj(Fminmax, Fhough, Fdistance, Fcontrast, Fcluster)
21: Fmaxval(x, y) =M ax(Fminmax, Fhough, Fdistance, Fcontrast, Fcluster)
22: Fweightedvote(x, y) = 1/(P
FiinFrecall(Fi))×P
FiinFFi(x, y)×recall(Fi) F: the set of all feature images
23: return
(a) original image (b) feature image (c) overlay
Figure 2: Canny edge detector with Probabilistic Hough transform. In (b), detected lines that are part of a barcode-like cluster are shown in red while the other detected lines are shown in blue. (c) shows the detected bounding box and centroid of the code region overlaid onto the original image.
set to the transformation. Edge map of Section II-B can be re-used here. For each tile of the distance map, means and standard deviations are calculated. For 1D codes, distance values spread between half of the minimum and half of the maximum line width.
After evaluating all tiles locally, we look for clusters in the feature matrix. Experiments show that the mean of dis- tance values spread around half of the average line width.
We applied a threshold for the values to classify whether or not an area contains a barcode segment. Letting a 25 % tolerance for these idealistic values, detection accuracy becomes satisfactory. For end-user applications we have to take noise, scratches and reflections into consideration.
For images containing heavy noise, distance means drop
considerably. Barcodes suffering from scratches, dust, handwriting or reflections, change the distance means significantly according to the dark or bright intensity values of the flaw. Tolerance should be set according to amounts of these distracting properties and exact values can also be measured via trial and error. Tolerance value is a compromise between accuracy and the rate of false positive detections, so it should be set with respect to the final application.
The resulting binary matrix can be further analized via Connected Component Labelling. Finally, small com- ponents are dropped, and momentums of the remaining components are returned. A component is considered small if it contains less thanN tiles (Eq. (1)), wherehis
(a) original image (b) edge map (c) distance map
Figure 3: Canny edge map (b) and distance map (c) of a real-life example image (a). Barcodes have compact dark areas.
Note: the values in the distance map are scaled for visualization.
Figure 4: Detection accuracy with respect to the tile size.
X-axis: proportion of tile size to barcode height; Y-axis:
detection accuracy (both expressed in percent).
barcode height,wis barcode width, andsis the tile size.
N= max
4,|h−s| × |w−s|
s2
(1) Since the smallest barcode in our set has a 60 px height, 30×30px or greater tile sizes have poor recognition capa- bility. However, very small tile sizes also lead to greater error for computing the center of the codes, because of the characters appearing below the code with code pieces nearby also have a barcode-like property (plain text is not affected). Also, choosing the tile size below two times the width of the widest barcode line leads to poor accuracy, since only two clusters can be detected on the tile, and that does not characterize a barcode part well. The best tiling size appears to be about1/3 of the barcode height (Fig. 4). Since all examined codes consist of the same pattern (parallel lines), we looked for the optimal tile size for all types of codes together.
It is possible to run this method with disjunct or overlap- ping tiles, but overlapping does not improve the method’s accuracy, only increases computation time. Offsetting the tiles has no significant effect, since it just produces some blocks to be more and others to be less “barcode-like” at the barcode’s opposite sides.
This method gives a noticeable amount of false positives (Fig. 5), since text can also satisfy well the condition of having similar distance averages than a barcode. However, it can be used as a weak “classifier” of image areas, and its output is a good starting point for more accurate methods. The protocol to test optimal parameters is highly experimental, however, in end-user applications, we can approximate expected element size or bar width of the
Figure 6: Two pairs of scan-lines sweeping through the image. The one on the left gives significant difference in contrast variance along perpendicular directions. In this example, the barcode is fully recognized by the first pair of scan-lines.
barcode. The amount and characteristics of illumination is also limited in most cases, especially in industrial environment. Expected code dimensions can also be mea- sured from acquired image dimensions and distance of the scenario to the camera.
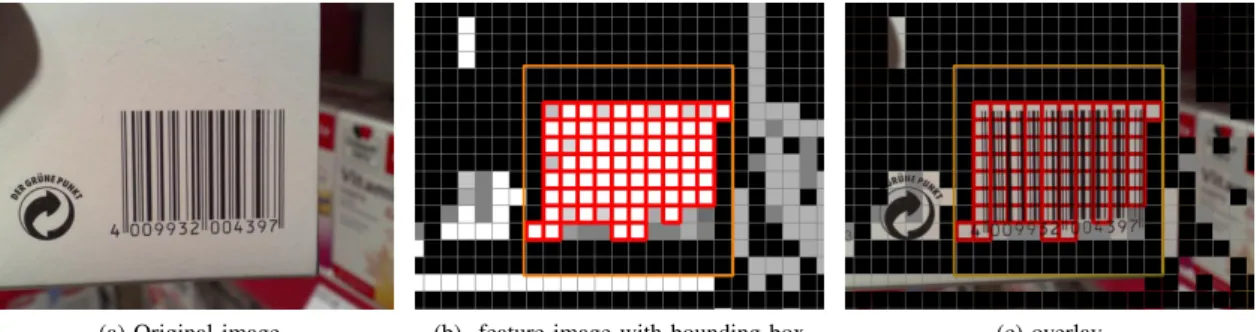
D. Contrast Measuring with Uniform Partitioning Using the idea of image tiling, we also can look for contrast information. One-dimensional barcodes usually have high variance in contrast at one specific direction, while having low variance perpencidularly to that. The discussed rules of tiling and forming the final decision also apply to the approach of contrast measuring, only the value of each tile is assigned differently.
Each tile is checked locally for barcode-like appearance with a modified version of the scan-line analysis. We used 2 pairs of perpendicular scan-lines, one pair at 0◦ and 90◦ and the other at 45◦ and 135◦ (Fig. 6). A measure is derived from contrast variance along the scan-lines (Eq. (2)), e.g. a horizontally aligned barcode has a lot of contrast changes when scanned with a horizontal scan- line, but has few or none with a vertical (Fig. 6). With the 2 pairs of scan-lines, barcode pieces of any orientation can be safely recognized. The final measure assigned to a tile is the maximum of the two values. This measure gives 1 if parallel lines are present in an image tile, and 0 if a tile contains homogeneous area or noise.
Ci= |Vi1−Vi2|
max(Vi1, Vi2) (2)
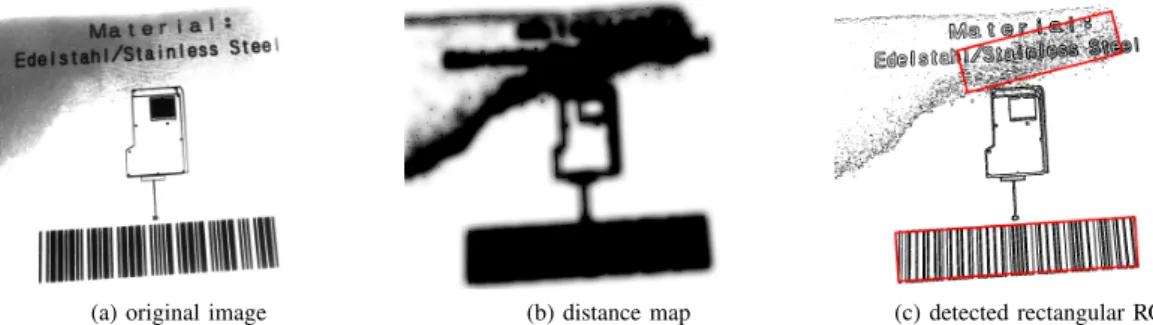
(a) original image (b) distance map (c) detected rectangular ROIs
Figure 5: Real-life example of a product case with uneven illumination. Original image (a), distance transformation (b), and the detected rectangular ROIs based on the distance map (c)
whereVij is the contrast variance along a scan-line j in a scan-line pair i.
The rest of the method is the same as it is present at Section II-C.
III. EVALUATION
The discussed methods were tested on a fair amount of images (see III-A), and accuracy was compared to known barcode detection techniques, like the one based on bottom-hat filter [8], and another using morphological gradient [1].
Parameters should be fine-tuned for a specific appli- cation, however, there are reasonable default values for each one. It is possible to give minimum and maximum expected values of barcode dimensions, line width and length. Other parameters come from imperfections of the camera and the scene, like blurring and noise. Those circumstances decide the amount of overshoot we have to apply at unsharp masking and threshold values. A typical setup contains the following parameters: 80 % of the min- imal expected line length for Hough transformation, and 80 % for the number of lines as a threshold for grouping by alignment and proximity. Optimal tile size is about 1/3 of expected average barcode height (Fig. 4). Threshold for the matrix of Contrast Measuring can be 0.5–0.75. Kernel size for MIN–MAX is the width of the thickest expected barcode line [4]. Parameters can be further refined with trial and error, or known optimization techniques.
A. Test Suite
Since we have not found many official barcode detection test image databases, we made about 100 images of gro- cery product barcodes with a Nokia N95 smartphone cam- era. We downsampled those images to 640×480 px with bilinear interpolation. Minor reflections, blur, scratches and distortions were present in these images. We also found one barcode image database for comparative assess- ment, which was created by Tekin and Coughlan1. Ground truth to those images had been made manually, without marking the quiet zones and the digits that belong to the code.
1http://www.ski.org/Rehab/Coughlan lab/Barcode
There are several barcode detection software and frame- works on the market, like the DTK Barcode Reader SDK2, BC Tester3, and Barcode Recognition SDK of DataSymbol4, however, they do not indicate the applied theory behind their detection mechanism.
B. Implementation and Test Environment
We implemented the method in C++, with the help of the OpenCV library. C++ provides convenient OOP ap- proach and fast code execution, whileOpenCVhas all the functions needed for image processing and manipulation.
Evaluation is performed on a computer with Intel Core 2 Duo 3.00GHz CPU.
C. Accuracy and Detection Speed
For comparing the effectiveness of the proposed meth- ods, we used the most common measures like precision, recall, accuracy and F-measure. The values are based on the Jaccard index
J(G, D) = P
x,y(G(x, y)∧(D(x, y)) P
x,y(G(x, y)∨(D(x, y)) (3) whereGandD give binary 0–1 values based on the pixel intensity of the ground truth and the binarized detector output images respectively.
The average performance indicators of the detectors are shown in Table I.
Distance transformation is better to be used as a weak
“classifier” instead of on its own. It produces the highest amount of false positives, however, it comes with high recall. It is more like an exclusion filter for image parts rather than a detector.
The Probabilistic Hough method is a robust choice to localize barcodes, because it can be parametrized to minimum line length and maximum gap between line segments. It also handles well noise to a certain level, but it is quite sensitive to distortions.
Thanks to the nature of the Distance Transformation and Local Clustering methods, they are reliable on images with
2http://www.dtksoft.com/
3http://www.bctester.de/
4http://www.datasymbol.com/
(a) Original image (b) feature image with bounding box (c) overlay
Figure 7: Contrast measuring on a real-life example.
Table I: Average detection performance of the proposed methods
Algorithm Precision Recall Accuracy F-measure Runtime
Tuinstra 57.08 % 85.29 % 84.19 % 48.39 % 160 ms
Juett et al. 34.26 % 94.08 % 72.76 % 36.13 % 230 ms Hough trans. 64.83 % 85.07 % 84.22 % 58.76 % 230 ms Distance trans. 20.00 % 95.85 % 54.52 % 23.54 % 190 ms Local clustering 81.68 % 72.34 % 89.22 % 62.12 % 120 ms
MIN–MAX 26.39% 97.59 % 54.45 % 29.62 % 460 ms
Contrast measuring 51.17 % 88.02 % 82.58 % 49.07 % 140 ms Majority voting 53.15% 85.70% 85.25% 48.44% 680 ms Maximum of features 21.25% 96.45% 61.84% 24.51% 680 ms Weighted voting 37.45% 91.97% 78.11% 37.35% 680 ms
minor distortions, unlike the Hough transformation, which detects barcodes based on line angles.
The least sensitive method is MIN–MAX. Because of the morphological approach, it handles well noise, blur and distortions up to a relatively high level. However, the convolutions used in the steps of the algorithm make it relatively slow.
Partitioning the image, assigning a measure to parti- tions, and looking for homogeneous areas in the feature image is a general approach to detect patterns. With differ- ent features, like contrast variance, histogram information or distance information, it can be used well as a barcode locator method.
Using the ensemble of detectors increase different per- formance values of the single detectors based on the aggre- gation method. With majority voting, we can increase the precision by losing important ROIs. Using the maximum values of all feature images gives good recall, but it decreases the precision. Weighted voting, based on the separate recall values gives good recall rate while keeping precision relatively high. Since the only difference is in how we compute the values of the final feature image, those algorithms share the same running time.
IV. CONCLUDINGREMARKS
We have presented several approaches to detect bar- codes in raster images using the idea of various features.
We studied their behaviour on a set of images showing different barcode types. We experimented with ensemble performance of simple detectors and showed its efficiency for localization.
In industrial setups parallel execution may also be possible for further improve detection speed. Furthermore,
the data of the proposed algorithm, like the edge map can be re-used as the input for other discussed classifiers.
Our future work includes involving efficient detectors using more complex features to maximize recall for indus- trial setups, where missing valid barcodes is unacceptable.
We are working on fast solutions for barcode localization that can be embedded in camera software.
V. ACKNOWLEDGEMENTS
This publication is supported by the European Union and co-funded by the European Social Fund. Project title: “Broadening the knowledge base and supporting the long term professional sustainability of the Research University Centre of Excellence at the University of Szeged by ensuring the rising generation of excellent scientists.” Project number: T ´AMOP-4.2.2/B-10/1-2010- 0012. The work of the second author is supported by the J´anos Bolyai Research Scholarship of the Hungarian Academy of Sciences.
REFERENCES
[1] T. R. Tuinstra, “Reading barcodes from digital imagery,”
Ph.D. dissertation, Cedarville University, 2006.
[2] E. Joseph and T. Pavlidis, “Bar code waveform recognition using peak locations,”Pattern Analysis and Machine Intel- ligence, IEEE Transactions on, vol. 16, no. 6, pp. 630–640, 1994.
[3] R. Adelmann, “Toolkit for bar code recognition and resolv- ing on camera,” in Phones – Jump Starting the Internet of Things. In: Informatik 2006 workshop on Mobile and Embedded Interactive Systems, 2006.
[4] P. Bodn´ar and L. G. Ny´ul, “Efficient barcode detection with texture analysis,” in Signal Processing, Pattern Recogni- tion, and Applications, Proceedings of the Ninth IASTED International Conference on, 2012, pp. 51–57.
[5] ——, “Barcode detection with uniform partitioning and morphological operations,” inConference of PhD Students in Computer Science, Proceedings of Conference, 2012, pp.
4–5.
[6] D.-T. Lin, M.-C. Lin, and K.-Y. Huang, “Real-time automatic recognition of omnidirectional multiple barcodes and dsp implementation,”Machine Vision and Applications, vol. 22, pp. 409–419, 2011, 10.1007/s00138-010-0299-3.
[Online]. Available: http://dx.doi.org/10.1007/s00138-010- 0299-3
[7] D.-T. Lin and C.-L. Lin, “Multi-symbology and multiple 1d/2d barcodes extraction framework,” in Advances in Multimedia Modeling, ser. Lecture Notes in Computer Science, K.-T. Lee, W.-H. Tsai, H.-Y. Liao, T. Chen, J.-W.
Hsieh, and C.-C. Tseng, Eds. Springer Berlin / Heidelberg, 2011, vol. 6524, pp. 401–410, 10.1007/978-3-642-17829- 0-38. [Online]. Available: http://dx.doi.org/10.1007/978-3- 642-17829-0-38
[8] X. Q. James Juett, “Barcode localization using bottom- hat filter,”NSF Research Experience for Undergraduates, 2005.
[9] M. Katona and L. G. Ny´ul, “A novel method for accurate and efficient barcode detection with morphological opera- tions,” inThe 8th International Conference on Signal Image Technology (SITIS 2012), 2012, accepted for publication.
[10] R. Oktem, “Bar code localization in wavelet domain by using binary morphology,” inSignal Processing and Com- munications Applications Conference, 2004. Proceedings of the IEEE 12th, april 2004, pp. 499–501.
[11] D. Ballard, “Generalizing the hough transform to detect arbitrary shapes,” Pattern Recognition, vol. 13, no. 2, pp. 111–122, 1981. [Online]. Available:
http://www.sciencedirect.com/science/article/pii/0031320381900091 [12] A. Jain and Y. Chen, “Bar code localization using texture
analysis,” in Document Analysis and Recognition, 1993., Proceedings of the Second International Conference on, 1993, pp. 41–44.
[13] P. F. Felzenszwalb and D. P. Huttenlocher, “Distance transforms of sampled functions,” Cornell Computing and Information Science, Tech. Rep., 2004.
[14] S. Wu and A. Amin, “Automatic thresholding of gray- level using multistage approach,” in Document Analysis and Recognition, 2003. Proceedings. Seventh International Conference on, 2003, pp. 493–497 vol.1.
[15] J. Canny, “A computational approach to edge detection,”
Pattern Analysis and Machine Intelligence, IEEE Transac- tions on, vol. PAMI-8, no. 6, pp. 679–698, nov. 1986.
[16] N. Kiryati, Y. Eldar, and A. M. Bruckstein, “A probabilistic hough transform,” Pattern Recognition, vol. 24, no. 4, pp. 303–316, 1991. [Online]. Available:
http://www.sciencedirect.com/science/article/pii/003132039190073E
[17] S. M. Youssef and R. M. Salem, “Automated barcode recognition for smart identification and inspection automation,”Expert Systems with Applications, vol. 33, no. 4, pp. 968–977, 2007. [Online]. Available:
http://www.sciencedirect.com/science/article/pii/S095741740600234X