Data analysis applied to diabetic retinopathy screening: performance
evaluation
Bálint Antal
a∗†, Mayo Kayann Guerra Silva Tavares
b†, László Kovács
a†, Balázs Harangi
a, István Lázár
a, Brigitta Nagy
a, György Kovács
a, József Szakács
a,
János Tóth
a, Tünde Pető
c, Adrienne Csutak
b‡, András Hajdu
a∗‡aFaculty of Informatics, University of Debrecen, Hungary
bDepartment of Ophthalmology, Faculty of Medicine, University of Debrecen, Hungary
cCentre for Public Health, Queen’s University Belfast, United Kingdom Submitted June 6, 2018 — Accepted October 17, 2018
Abstract
The number of people with diabetes mellitus (DM) has risen from 108 million in 1980 to 422 million in 2014. Diabetic retinopathy (DR) is one of the most common causes of blindness in the developed world. A pooled analysis of data from between 1980-2008 estimates that 93 million people around the world have DR. In this paper, we present a computer-aided auto- mated image analysis system capable of handling images generated in real-life screening program. In this study, we analyzed 2932 color fundus images taken from 733 patients with DM, of which 454 (15%) images showed signs of DR validated by human graders. The system analyzed all images by detecting
∗Corresponding author. E-mail:antal.balint@inf.unideb.hu,hajdu.andras@inf.unideb.hu Address: Faculty of Informatics, University of Debrecen, H-4002 Debrecen, POB 400, Hungary Phone: +36 52 512900/75124
†B. Antal, M.K.G.S. Tavares, and L. Kovács contributed to this work equally.
‡A. Csutak and A. Hajdu contributed to this work equally.
doi: 10.33039/ami.2018.10.002 http://ami.uni-eszterhazy.hu
3
anatomical components such as the optic disc, macula and vascular system of the retina, then microaneurysms (MAs) and exudates as lesions. Once the presence/absence of the structures was determined, the combination of the results was subsequently used to provide a “DR/No DR” decision using a machine learning approach. The fundus images were graded by a trained and certified expert grader as well and the final diagnosis was compared to the outcome of the computer-based approach. The performances of the MA and exudate detectors used by the system were also evaluated. The area under the ROC curve (AUC) was 0.90 with the best performing setting of the algo- rithm. The evaluation of the proposed approach shows that it performs well against human graders and therefore might have the potential to be used in a clinical setting. There is a need for further evaluation on large scale, real-life clinical setting to explore its clinical utility.
Keywords: diabetic retinopathy, image processing, automatic screening, de- cision support, distributed processing
MSC:68U10, 68M14
1. Introduction
Diabetes Mellitus (DM) is a chronic systemic disease characterized by an eleva- tion of the glucose level on the blood caused by lack of insulin in Type 1 DM and the defective action of insulin in Type 2 DM. The prevalence of DM is rising in every country; globally 422 million people have diabetes [1]. Of these, 175 mil- lion are undiagnosed and over 80% live in low- and middle-income countries [2].
One important strategy for tackling the diabetes burden is to screen for undiag- nosed diabetes. By identifying and treating the disease early, we can minimize the future risk of developing diabetic complications [2], and lessen the burden of DR, nephropathy, peripheral neuropathy, cardiovascular problems, cerebrovascular disease, hypertension and abnormalities of lipoprotein metabolism [3].
DR is the most common complication of DM and it is the leading cause of blindness in people of working-age worldwide. In the UK, where effective systematic screening for DR has been in existence for over 10 years, DR is no longer the leading cause of blindness in the working age group [4]. In most screening programs, DR is detected by trained graders analyzing the color fundus photographs taken for this purpose. The imaging equipment is expensive to buy and maintain, and the resulting images require human grading. This process is both human resource and training heavy and is time-consuming favoring its use in more developed countries.
It is difficult to implement comprehensive DR screening in the developing world, where personnel is not readily available and where priorities are competing for such limited resource. To overcome the aforementioned challenges, automated image analysis would be essential, and solutions are being developed to decrease the economic burden of human grading [5, 6, 7, 8].
While the current automated systems are achieving ever increasing grading accuracy, their implementation is lagging behind due to consideration for scalabil-
ity issues around data processing and computational power needed in large-scale screening programs.
As the main contribution of this paper, we present an approach capable of handling big data required for processing images generated in DR screenings, and we validate this approach by comparing the results to those generated by human expert graders. The approach is designed for processing large amounts of data at once instead of a sequential analysis of images. We will also show that the complete analysis of the fundus images outperforms the systems based on the detection of lesions like MA or exudates alone.
2. Methods
The method described in this paper allows the computer aided DR grading of fun- dus images to be run in a distributed manner on a computer grid. For the analysis itself, we have reused our previously published algorithm [9]. This algorithm relies on the features provided by several image processing methods that perform image quality assessment and pre-screening, anatomical landmark detection (macula, op- tic disc, vascular network) and lesion detection (microaneurysms, exudates), and uses machine learning to classify images.
The implementation was designed to allow scalable processing of the incoming images in order to ensure the efficient analysis of large fundus image sets. We have used the Son of Grid Engine framework to handle, distribute and share the tasks among the available nodes. The algorithms were implemented in MATLAB, Java, C++, Perl, and shell scripts. The testing environment used consisted of 792 CPU cores, 808 GB RAM on 196 COTS computer nodes having various configurations (typically Intel Core 2 Quad processor and 4 GB RAM). Processing a single image took 15-20 minutes; however, 196 images can be analyzed parallel, so all of them can be processed within this time frame. The system is linearly scalable, thus, by adding further nodes the throughput is increased by the number of nodes added.
The system has a self-diagnostic module, which restarts the analysis of each failed image. In practice, it is an efficient failure handling procedure, as comprehensive monitoring of the system would be very resource demanding and failures appear independently from the images (e.g., due to network communication errors, I/O timeouts), therefore after some iterations each image is processed. A flow chart of the proposed system is shown in Figure 1.
To train the system, a training set of 132 images was used, where only a “DR/No DR” assignment was provided. The training elements were selected randomly and the labels were assigned by a trained expert. We used a backward selection strategy and the soft average rule to select the ensemble of classifiers [9].
To measure the performances of the exudate [10] and MA [11] detectors, the 0.5 cut-off point was used for both, making them use the majority voting rule among the ensemble of detectors they use. That is, we considered those MA or exudate candidates as actual lesions, where the majority of the respective lesion detectors agreed on.
Figure 1: Flow chart of the distributed diabetic retinopathy screen- ing system. Fundus images are sent to the grid system, where a scheduler optimally distributes the input to the computer nodes.
As for its clinical setting, the system is able to receive an image set in a bulk upload and can directly return the results in email containing a “DR/No DR”
labeling for each image. However, it is also possible to provide a probability value between 0 and 1 for the stage of DR, which allows the ordering of the images regarding estimated severity. User registration is also supported, so the uploaded datasets and the corresponding screening results can be safely checked via a web browser if the uploader prefers this option. Though our focus is on mass screening, it is also possible to visualize the features (e.g., lesions found) involved in the decision within the system [12].
3. Results
To evaluate the performance of our system we have analyzed 2932 fundus images with a resolution of 3072×2048 pixels and 45◦ FOV taken from 733 patients with DM. Within this dataset, human graders labeled 454 (15%) images as showing signs of DR. In a recent study [13], the detection of referable retinopathy by human graders has been found to have sensitivities between 77 and 100% with specificities between 94% and 100%. We considered the labeling by human graders as ground truth in the evaluation.
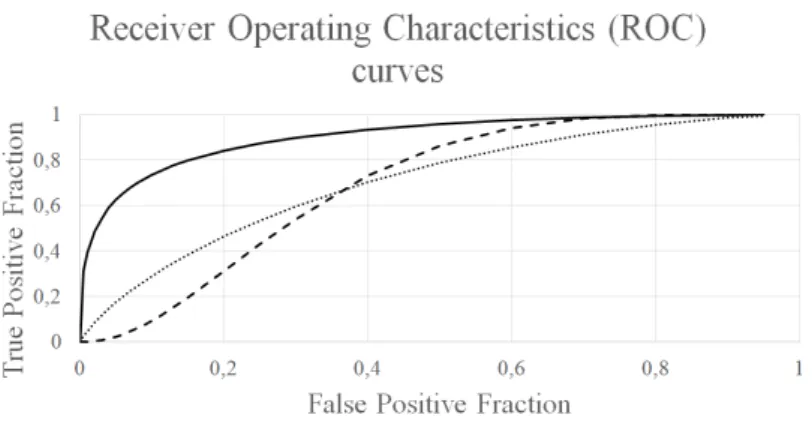
The system has three possible use cases to operate, namely exudate, MA and complex (combined) approach. Accordingly, we have fitted a Receiver Operating Characteristics (ROC) [14] curve of the findings to the proposed complex method, and also on those of the exudate and the MA detection only approaches. The respective fitted areas under the ROC curves (AUC) are 0.90, 0.695, and 0.708 (see Figure 2). We applied Friedman’s rank test [15] and Tukey’s post-hoc test [16]
to compare the results of the three approaches. The analysis showed a significant difference in the means of the three approaches (p<0.0001) and established that
the complex method performed significantly better than the other two.
Figure 2: Receiver Operating Characteristics (ROC) curves of the complex method, the exudate detection only and the microa-
neurysm (MA) detection only approaches.
4. Discussion
The approach presented here has been previously tested on a publicly available dataset, where it was evaluated to have a 0.90 AUC, which is similar to that of other state-of-the-art techniques: Hansen et al. [17] (0.878), Agurto et al. [18]
(0.89), and Abràmoff et al. [19] (0.937). However, these figures are not directly comparable since they were established on datasets having different proportions of patients showing signs of DR [9], and depending on the prevalence of the disease, these results can vary widely. In our current analysis of the screening images, we found very similar AUC to that of the published literature and so that places our algorithm well within the published limits.
The distributed processing method makes it an ideal candidate to use as a back- end for large-scale screening and telemedicine approaches for two reasons: first, the linear scalability of our system provides the constant processing time of a single image for the whole image set with including the same number of processing nodes as the number of images. This approach makes the screening predictable regarding time and computational resources. Second, only a “DR/No DR” assignment for a small training dataset is required to teach the system instead of hand-segmented images or lesion annotations. While the proposed approach performed well in this setting, a better automation is required in the future for adjusting its parameters according to the user requirements regarding e.g., sensitivity/specificity.
Acknowledgements. This work is supported by the EFOP-3.6.2-16-2017-00015 project. The project has been supported by the European Union, co-financed by the European Social Fund. A. Csutak was the recipient of Bolyai and Szodoray Grants.
T. Pető was funded by NIHR BMRC at Moorfields Eye Hospital Foundation Trust and UCL Institute of Ophthalmology.
References
[1] World Health Organization, Diabetes Fact Sheet,
URL:http://www.who.int/mediacentre/factsheets/fs312/en/
[2] International Diabetes Federation, IDF Diabetes Atlas, 8th edition, URL:http://www.diabetesatlas.org
[3] Bunce, C., Wormald, R., Leading causes of certification for blindness and partial sight in England & Wales,BMC Public Health, Vol. 6 (2006), 1–7.
https://doi.org/10.1186/1471-2458-6-58
[4] Graham-Rowe, E., Lorencatto, F., Lawrenson, J.G. et al., Barriers and enablers to diabetic retinopathy screening attendance: protocol for a systematic review,Systematic Reviews, Vol. 5 (2016), 1–9.
https://doi.org/10.1186/s13643-016-0309-2
[5] Bhaskaranand, M., Cuadros, J., Ramachandra, C. et al., EyeArt + Eye- PACS: Automated retinal image analysis for diabetic retinopathy screening in a telemedicine system,Proceedings of the Ophthalmic Medical Image Analysis Second International Workshop (OMIA 2015), Munich, Germany, October 9, 2015, 105–112.
https://doi.org/10.17077/omia.1033
[6] Walton, O.B., Garoon, R.B., Weng, C.Y. et al., Evaluation of automated tel- eretinal screening program for diabetic retinopathy,JAMA Ophthalmology, Vol. 134 (2016), 204–209.
https://doi.org/10.1001/jamaophthalmol.2015.5083
[7] Scotland, G.S., McNamee, P., Fleming, A.D. et al., Costs and consequences of automated algorithms versus manual grading for the detection of referable diabetic retinopathy,British Journal of Ophthalmology, Vol. 94 (2010), 712–719.
https://doi.org/10.1136/bjo.2008.151126
[8] Mansberger, S.L., Sheppler, C., Barker, G. et al., Long-term comparative effectiveness of telemedicine in providing diabetic retinopathy screening examina- tions: a randomized clinical trial,JAMA Ophthalmology, Vol. 133 (2015), 518–525.
https://doi.org/10.1001/jamaophthalmol.2015.1
[9] Antal, B., Hajdu, A., An ensemble-based system for automatic screening of dia- betic retinopathy,Knowledge-Based Systems, Vol. 60 (2014), 20–27.
https://doi.org/10.1016/j.knosys.2013.12.023
[10] Nagy, B., Antal, B., Harangi, B., Hajdu, A., Ensemble-based exudate de- tection in color fundus images, 7th International Symposium on Image and Signal Processing and Analysis (ISPA 2011), Dubrovnik, Croatia, September 4–6, 2011, 700–703.
[11] Antal, B., Hajdu, A., An ensemble-based system for microaneurysm detection and diabetic retinopathy grading, IEEE Transactions on Biomedical Engineering, Vol. 59 (2012), 1720–1726.
https://doi.org/10.1109/tbme.2012.2193126
[12] Tóth, J., Kovács, L., Harangi, B. et al., An online benchmark system for image processing algorithms, 5th IEEE International Conference on Cognitive In- focommunications (CogInfoCom 2014), Vietri sul Mare, Italy, November 5–7, 2014, 377–382.
https://doi.org/10.1109/coginfocom.2014.7020482
[13] Tufail, A., Kapetanakis, V.V., Salas-Vega S. et al., An observational study to assess if automated diabetic retinopathy image assessment software can replace one or more steps of manual imaging grading and to determine their cost-effectiveness, Health Technology Assessment, Vol. 20 (2016), 1-72.
https://doi.org/10.3310/hta20920
[14] Hanley, J.A., McNeil, B.J., The meaning and use of the area under a receiver operating characteristic (ROC) curve,Radiology, Vol. 143 (1982), 29–36.
https://doi.org/10.1148/radiology.143.1.7063747
[15] Friedman, M., The use of ranks to avoid the assumption of normality implicit in the analysis of variance,Journal of the American Statistical Association, Vol. 32 (1937), 675–701.
https://doi.org/10.2307/2279372
[16] Tukey, J.W., Comparing individual means in the analysis of variance,Biometrics, Vol. 5 (1949), 99–114.
https://doi.org/10.2307/3001913
[17] Hansen, M.B., Abràmoff, M.D., Folk J.C. et al., Results of automated retinal image analysis for detection of diabetic retinopathy from the Nakuru Study, Kenya, PLoS ONE, Vol. 10 (2015), 1–9.
https://doi.org/10.1371/journal.pone.0139148
[18] Agurto, C., Barriga, E.S., Murray, V. et al., Automatic detection of diabetic retinopathy and age-related macular degeneration in digital fundus images, Inves- tigative Ophthalmology & Visual Science, Vol. 52 (2011), 5862–5871.
https://doi.org/10.1167/iovs.10-7075
[19] Abràmoff, M.D., Folk, J.C., Han, D.P. et al., Automated analysis of retinal images for detection of referable diabetic retinopathy,JAMA Ophthalmology, Vol. 131 (2013), 351–357.
https://doi.org/10.1001/jamaophthalmol.2013.1743