Polarometric Titrations
B Y
JAROSLAV HEYROVSKY University of Prague, Czechoslovakia
CONTENTS
Page
1. History 2 2. Theory 3 3. Apparatus 7
3.1. Capillary 7 3.2. Polarograph 8 3.3. Galvanometer and Shunt 9
3.4. Electrolyte Vessels 10 4. Techniques of Investigating Solutions 14
5. Sensitivity and Accuracy of the Method 20 6. Tables of Depolarization Potentials 21
7. Applications 23 Lithium 24 Sodium and Potassium 24
Sodium in Ceramic Material in the Presence of High Aluminum Content 24
Sodium in Magnesium 24 Sodium in Aluminum or its Salts 24
Alkaline Earths 25 Magnesium and Beryllium 25
Aluminum 25 Aluminum in Magnesium 26
Aluminum in Steel 26 Manganese 27 Manganese in Aluminum Alloys 27
Manganese in Zinc 27 Manganese in Steel 28
Iron 29 Nickel and Cobalt 30
Nickel in Steel and in Nickel Ore 31
Chromium in Steel 31 Vanadium in Steel 32 Vanadium in Steel and Other Ferro-Alloys 32
Molybdenum 33 Tungsten in Steel 33
Zinc 33 Zinc in the Presence of Nickel 33
1
2 J A R O S L A V H E Y R O V S K Y
Page
Zinc and Chromium 33 Zinc in Aluminum Alloys Containing Copper 34
Cadmium, Zinc, Lead and Copper in Crude Zinc Ore 35 Cadmium, Lead and Copper in Zinc or Zinc Salts 35
Lead 36 Lead in Bronzes 36
Lead in Copper, Brass and in Zinc Alloys 37 Simultaneous Determination of Traces of Lead and Cadmium 38
Tin 38 Thallium.... 39
Antimony in Hard Lead 39
Bismuth 39 Copper 39 Copper and Nickel in Steel 39
Analysis of Brass 40 Copper in Aluminum Alloys 40
Uranium 41 Determination of Low-Melting Alloys 41
Copper, Lead, and Zinc in Flotation Processes 41
8. Polarometric (Amperometric) Titrations 42 Titration of Lead and of Barium 44
Titration of Zinc 45 Titration of Nickel, Cobalt and Copper 45
Titrations of Cadmium and Iron 45
Titration of Potassium 46 Titration of Calcium and of Aluminum 47
Titration of Molybdenum 47 Titration of Bismuth 47
References 48
1. H I S T O R Y
T h e polarographic method applied to technical analysis uses a u t o matically recorded current-voltage curves, obtained in electrolysis with a slowly dropping mercury electrode. F r o m the shape of t h e ensuing curves constituents in t h e solution are determined qualitatively a n d quantitatively even in large dilutions and in a small volume with economy of time and material.
I n its simplest form t h e m e t h o d uses G. L i p p m a n n ' s capillary elec
trometer as applied to the s t u d y of t h e surface-tension of polarized mercury. A thick-walled glass capillary, of 0.05 t o 0.1 m m . inside diameter a n d 5-10 cm. in length is joined b y rubber tubing to a mercury reservoir Μ (Fig. 1). L i p p m a n n (1876) observed t h e position of t h e mercury meniscus in the capillary, keeping the reservoir a t I ; B. Kuoera (1903) modified this method b y lifting the reservoir t o I I , letting the mercury drop slowly out of t h e capillary and weighing the drops t o determine t h e surface tension. J. Heyrovsky (1922) used this arrange-
m e n t for measurements of current-voltage curves, having introduced a sensitive galvanometer G. His theoretical investigations of electrode reactions a t t h e dropping mercury electrode h a v e disclosed the appli
cability of this arrangement for general analysis.
2. T H E O R Y
T h e role of t h e capillary electrode is similar in its function to t h a t in L i p p m a n n ' s arrangement, i.e., t o act as t h e polarizable electrode during the passage of current, the large mercury pool a t t h e b o t t o m of the electrolytic vessel remaining unpolarized. T h e t e r m " p o l a r i z a b l e "
means t h a t the electrode is capable of counterbalancing t h e external e.m.f. b y reaching a back-potential or "polarization v o l t a g e " xc, while the large electrode maintains its potential πα constant t h r o u g h o u t elec
trolysis. This contrasting behavior is primarily due t o t h e difference in size of the electrodes. T h e current density is high a t t h e dropping mercury electrode, b u t very small a t the b o t t o m electrode, t h e area of which is several h u n d r e d times larger t h a n the surface area of an indi
vidual drop. T h e unpolarizability of the b o t t o m electrode is further enhanced when used as anode. If the electrolyte consists of 1 Ν potas
sium chloride, calomel is produced during electrolysis, which imparts to the anode t h e definite potential of the normal calomel electrode. T h e mercury pool then acts as a s t a n d a r d electrode.
If one branches off a voltage Ε from t h e b a t t e r y Β by slide contact S, and a current i flows through the cell and galvanometer, t h e following relation holds: Ε = πα — Tc + ir, where r is the resistance in the circuit S G C A D .
In polarography the current i rarely exceeds 10~5 a m p . and since r is less t h a n 100 ohms, ir is of the order of millivolts and m a y be neglected.
7τα is the potential of the unpolarizable reference electrode and m a y be taken as zero so t h a t wc = —E. This is t h e condition of the polarizability of the dropping electrode and indicates t h a t t h e applied voltage is equal to the potential of the dropping electrode. (The negative sign means t h a t t h e dropping electrode is used as t h e cathode.)
T o acquire the potential wc, each drop of t h e capillary electrode has to be charged to t h e respective potential b y a charging (or capacity) current ic whose value, however, does not exceed 10~7 a m p . This is neglected in most cases b u t it has t o be taken into account when using high galvanometer sensitivity.
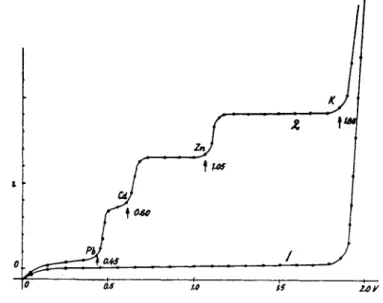
T h e method is best illustrated when the applied voltage Ε is increased by shifting t h e sliding contact S (Fig. 1) from D towards F a n d noting, after each increase of E, the corresponding current i. W h e n using a solution of 1 Ν potassium chloride as electrolyte, t h e graph showing the
4 JAROSLAV HEYROVSKf
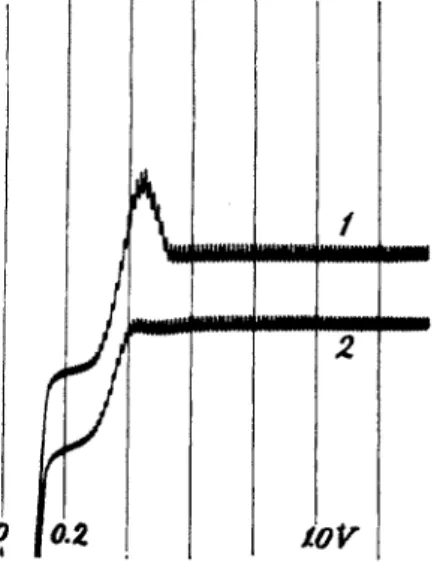
dependence of the current % on t h e applied voltage E, t h e " current voltage curve," has t h e shape of curve 1 (Fig. 2). I t represents t h e charging current, which shows a sudden increase a t Ε = 1.86 volt due t o t h e electrolytic current, b y which t h e potassium ions are electrodeposited on mercury, forming a dilute amalgam. If one adds small a m o u n t s of lead, cadmium, and zinc salts t o the electrolyte, so as t o m a k e the solution 10~4 normal in each component one observes an increase of current a t
FIG. 1. Schematic diagram of a polarographic arrangement.
0.45 volt, another a t 0.60 volt and a third a t 1.05 volt. T h e first increase is due t o the electrodeposition of lead, the second to cadmium a n d t h e third t o zinc. T h e current changes are called " w a v e s " and denote b y their potential t h e nature, and b y their height the q u a n t i t y of t h e ions in solution.
T h e horizontal p a r t s of the curve are due to "diffusion c u r r e n t s , "
where t h e current is limited by the rate of diffusion of the cations to be deposited. T h e magnitude of the diffusion current id is given b y t h e equation of Ilkovic" (18):
id - O.Q27(p)FDhmUWt
where ν is t h e n u m b e r of charges exchanged, D t h e diffusion constant of t h e diffusing ion, F the F a r a d a y equivalent, C the concentration of t h e
reducible constituent, m t h e r a t e of flow of mercury a n d t t h e drop time.
T h u s id increases linearly with C. T h e position a n d shape of t h e " w a v e "
is given b y t h e relationship deduced b y Heyrovsky a n d Ilkovio (13):
Here R a n d Τ are t h e gas constant a n d t e m p e r a t u r e respectively, a n d Κ is a constant specific for t h e electrodeposited ions. This characteristic
FIG. 2. Current-voltage curves for 1 Ν KC1 (1) and P b+ +, C d ,+ + Z n+ + ions in 1 Ν KC1 (2).
value of Κ is obtained from t h e curve a t t h e point, a t which t h e half- wave current is reached, i.e., when i = id/2; then wc = Κ a n d this value is called t h e "half-wave p o t e n t i a l ., , I t is independent of t h e concentration of t h e reducible cation a n d of t h e properties of t h e capillary. W h e n the cation enters into a complex, e.g., plumbous a n d zinc ions in an alkaline solution or cadmium a n d zinc ions in ammoniacal solutions, the half-wave potentials are considerably changed (see Table I ) . N o t only cations are electrodeposited in polarography, b u t m a n y ions are reduced, as, for example, Fe+++ - » F e+ +, C r+ + + -> Cr++ N 03~ -> N H3, Br03~—> Br~, C r 04" - ^ C r+ + + etc., a n d numerous molecular species, both inorganic a n d organic, are reduced, as, for example, oxygen, h y d r o gen peroxide, sulfur dioxide, dicyan, aldehydes, nitro derivatives, unsatu
rated compounds etc. When t h e dropping electrode is m a d e t h e anode, RT, id - i
= - r r l n — - r — VP %
+ K.
ι
ο
6 JAROSLAV H E Y R O V S K f
Half^Wave Potentials {in Volts) of Metal Ion Deposition Referred to the Normal Calomel Electrode
Cation
In neutral or acid solutions
In 1 Ν alkali
In 1 Ν NH4OH
1 Ν NH4C1 In 1 Ν KCN
In 10%
tartarate or citrate
In 0.1 Ν KOH
0.30 Μ triethanol amine
C a+ + - 2 . 2 3 - 2 . 2 3
Li+ - 2 . 3 8 - 2 . 3 8
— —
——
S r+ + - 2 . 1 3 - 2 . 1 3
— — —
—N a+ - 2 . 1 5 - 2 . 1 5
— — — —
K+ - 2 . 1 7 - 2 . 1 7
— — — —
Rb+ - 2 . 0 7 - 2 . 0 7
— —
——
C s+ - 2 . 0 9 - 2 . 0 9
— — — —
N H4 + - 2 . 0 7 - 2 . 1 7
— — — —
Ba++ - 1 . 9 4 - 1 . 9 4
— — — —
Ra++ - 1 . 8 9 - 1 . 8 9
— — — —
A1+++ - 1 . 7 6
— — — — —
M n+ + - 1 . 5 5 - 1 . 7 4 - 1 . 6 9 - 1 . 3 7 - 1 . 7 - 1 . 6 5 C r+ + - 1 . 4 2 - 1 . 9 8 - 1 . 7 4
— — —
Fe++ - 1 . 3 3 - 1 . 5 6 - 1 . 5 2
— — —
H+ - 1 . 6
— — —
- 1 . 6—
C o+ + - 1 . 2 3 - 1 . 4 4 - 1 . 3 2 - 1 . 2
— —
N i+ + - 1 . 0 9
—
- 1 . 1 4 - 1 . 4 2—
- 1 . 4 0Z n+ + - 1 . 0 6 - 1 . 5 3 - 1 . 3 8
—
- 1 . 1 9 - 1 . 4 9I n+ + + - 0 . 6 3 - 1 . 1 3
— — — —
Cd++ - 0 . 6 3 - 0 . 8 0 - 0 . 8 5 - 1 . 1 5 - 0 . 6 8 - 0 . 8 2 S n+ + - 0 . 4 7 - 1 . 2 6
— —
- 0 . 6 8 - 1 . 4 3P b+ + - 0 . 4 6 - 0 . 8 1
—
- 0 . 7 4 - 0 . 5 4 - 0 . 8 8T1+ - 0 . 5 0 - 0 . 5 0 - 0 . 5 2
—
- 0 . 5 2—
S b+ + + - 0 . 2 1 - 1 . 2
—
- 1 . 1 7 - 1 . 0 4—
B i+ ++ - 0 . 0 3 - 0 . 6
— —
- 0 . 7 4 - 0 . 7 8C u+ + - 0 . 0 3 - 0 . 5 2
— —
- 0 . 1 1 - 0 . 5 3Cu+
— —
- 0 . 5 4— — —
Au+
—
- 1 . 3—
- 1 . 5— —
A u+ + +
—
- 0 . 6— — — —
electro-oxidation of cations takes place, for example, C r+ + —> C r+ + +, F e+ +— > F e+ + +, etc., as well as oxidation of m a n y organic compounds, n o t a b l y the redox systems. All substances t h a t undergo electrolysis a t t h e dropping mercury electrode are designated as " depolarizers/' since in their presence the polarization voltage (back e.m.f.) cannot increase until t h e "depolarizer'' is exhausted at the interphase of t h e dropping electrode and thereby gives rise to concentration polarization.
TABLE I
3. A P P A R A T U S
8.1. Capillary
T h e capillary is a n ordinary, thick-walled glass t u b e as used for thermometer stems. W h e n t h e inner bore is narrow, 0.05 m m . or less, the length m u s t n o t exceed 6 cm. otherwise t h e dropping rate is too slow and t h e resistance of t h e capillary too great. T h e wider t h e bore the longer t h e capillary should be t o give a drop time t of a b o u t three seconds. T h e drop time depends on t h e surface tension of mercury a n d
h · r4
on t h e outflow velocity of mercury m. Since m = k—γ-> i.e., directly proportional t o t h e pressure of mercury (height of t h e reservoir) h a n d t o the 4 t h power of t h e radius, a n d inversely t o t h e length I of t h e capillary the surface-tension of mercury is constant a t a n y fixed potential of t h e dropping electrode a n d hence t h e drop-weight m · t is also constant a n d independent of t h e height of t h e mercury reservoir. Since m is pro
portional t o h, t is inversely proportional t o t h e height of t h e reservoir.
F o r example with a 1 Ν potassium chloride electrolyte, place t h e sliding contact S (Fig. 1) on D , so t h a t t h e applied e.m.f. is zero a n d adjust t h e height of t h e mercury level t o obtain t h e required drop time of a b o u t 3 seconds. If t h e inside bore r is approximately 0.1 m m . , a n d t h e length of t h e capillary I is 10 cm., t h e height h is small, i.e., 10 t o 15 cm. If r is 0.07 t o 0.08 mm., h becomes 30-40 cm. a n d t h e length I 7-8 cm. Capil
laries of smaller radius t h a n 0.05 cm. are n o t suitable, as t h e y offer elec
trical resistance of several ohms and, according t o t h e Ilkovic equation, give small diffusion currents.
T h e drawn-out capillary recommended originally h a s t h e a d v a n t a g e t h a t a t its wide end rubber tubing is easily a t t a c h e d a n d little solution adheres a t its narrow tip (approximately 2 m m . wide) when t h e capillary is transferred from one solution into another. T h e disadvantage of such capillaries is their poor reproduciblity a n d fragility.
A standardization of capillaries was introduced b y M a a s , b y using thermometer capillaries of uniform bore. However, for repeated analyses the danger of contaminating t h e solution with small quantities of t h e previous sample exists unless t h e capillary is thin. T h e thin capillary, however, presents difficulties in attaching it t o t h e rubber tube.
T o use t h e advantages of both t h e old a n d new t y p e of capillaries Novak (35) recommends t h e following a d j u s t m e n t : a narrow t h e r m o m e t e r capillary 2 to 3 m m . thick a n d with a n inside bore of 0.08 m m . (or between 0.1 a n d 0.07 mm.) is fused on or attached b y a short rubber t u b e t o a tube 6 m m . wide, 8 t o 10 cm. long a n d 3 m m . inside diameter. T h e narrow capillary is cut off 4 to 5 cm. from t h e t u b e seal. This capillary
8
J A R 0 S L A V H E Y R O V S K Yis preferentially used in the "universal vessel" arrangement (page 10).
T h e advantages of t h e dropping mercury electrode technique a r e : 1. E v e r y drop offers a fresh surface unaffected by the previous history of
the preceding drop a n d surrounded by a fresh layer of solution, so t h a t t h e surface conditions are well defined a n d time effects excluded.
2. T h e large overvoltage of hydrogen on the mercury electrode prevents evolution of hydrogen even in t h e deposition of t h e alkali metals from neutral solutions, so t h a t the s t u d y of p r i m a r y electrode processes m a y be extended to —2.6 volt (using t h e 1 Ν potassium chloride- calomel electrode potential as reference base).
3. T h e changes in the composition of t h e solution are negligibly small owing to the small value of t h e current, so t h a t current-voltage curves m a y be measured repeatedly with identical results.
4. T h e constancy of dropping r a t e leads to reproducible results and permits an exact mathematical t r e a t m e n t of t h e curves.
5. T h e small dimensions of t h e dropping electrode allow very small volumes of solutions (0.01 to 0.005 ml.) t o be analyzed.
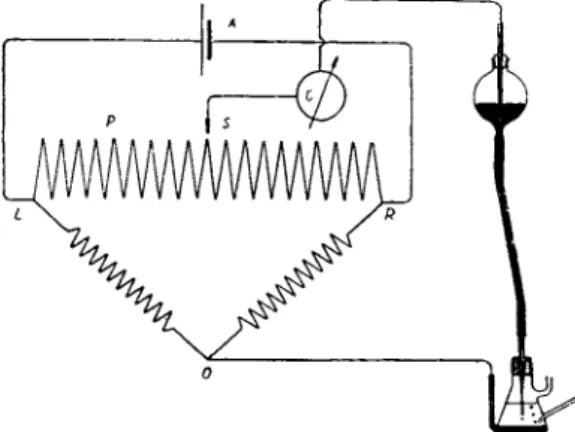
8.2. Polarograph
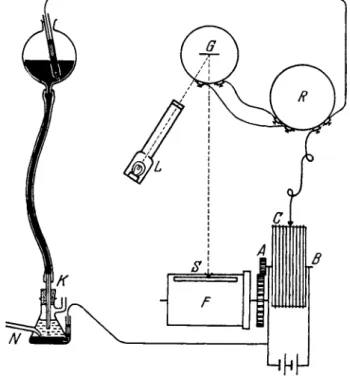
T o shorten the time of obtaining current-voltage curves an a p p a r a t u s has been constructed t h a t automatically registers t h e current-voltage curves a n d produces diagrams called polarograms (14). A diagram of the polarograph is shown in Fig. 3. T h e sliding contact C moves along t h e potentiometer wire A B as t h e wheel is t u r n e d b y clockwork or electric motor. T h e terminals A and Β are connected t o a 2 or 4 volt lead storage b a t t e r y or d r y cell. T h e contact C is connected to the mercury reservoir.
One end of the potentiometer wire A leads t o t h e large mercury electrode a n d to t h e positive pole of t h e d r y cell. As t h e wheel moves, it drives a cylinder F bearing photographic paper surrounded b y a fixed cover with a horizontal slit S. T h e circuit connecting t h e mercury electrodes passes a sensitive mirror galvanometer G. T h e mirror deflection is recorded on the photographic paper b y means of a light beam falling on the horizontal slit S. An Ayrton s h u n t R regulates t h e sensitivity of the galvanometer. As t h e wheel moves, t h e voltage acting on t h e mer
cury electrodes increases and the corresponding current curve is registered on t h e photographic paper, t h e abscissa denoting the voltage a n d t h e ordinate t h e current.
T h e a u t o m a t i c registering of the current-voltage curves represents a substantial improvement in the method since a continuous record reveals much more detail t h a n discontinuous m a n u a l plotting.
Recently various types of polarographs h a v e been developed using a current amplification a n d recording t h e curves b y ink or pencil on tracing paper. These diagrams are called polarograms.
FIG. 3 . Diagram of the polarograph.
3.8. Galvanometer and Shunt
T h e o p t i m u m sensitivity of t h e mirror galvanometer gives a deflection of a b o u t 300 m m . per microamp. or 3 X 10~9 a m p . causes a deflection of 1 m m . This is too high for t h e majority of cases investigated in polar- ography, a n d t h e sensitivity h a s t o be reduced b y means of the A y r t o n shunt. I t is i m p o r t a n t t h a t t h e resistance of the s h u n t and galvanometer are chosen t o keep t h e critical resistance for aperiodic damping constant.
T h e shape of t h e current-voltage curve largely depends on the damping, since it is merely t h e m e a n current during t h e formation of t h e mercury drop which is registered. An equally i m p o r t a n t factor is t h e period of swing of t h e galvanometer mirror. This should be somewhat longer t h a n t h e drop time. T h e best conditions exist when t h e half period of swing, T / 2 , is from 4 - 6 seconds. T h e damping of t h e galvanometer m a y be effected also b y connecting an electrolytic condenser of large capacity (several thousands microfarads) in parallel with t h e terminal of
10 JAROSLAV H E Y R O V S K f
the galvanometer. I n commercial polarographs the damping, period of swing and sensitivity scale are already adjusted.
8.4- Electrolyte Vessels
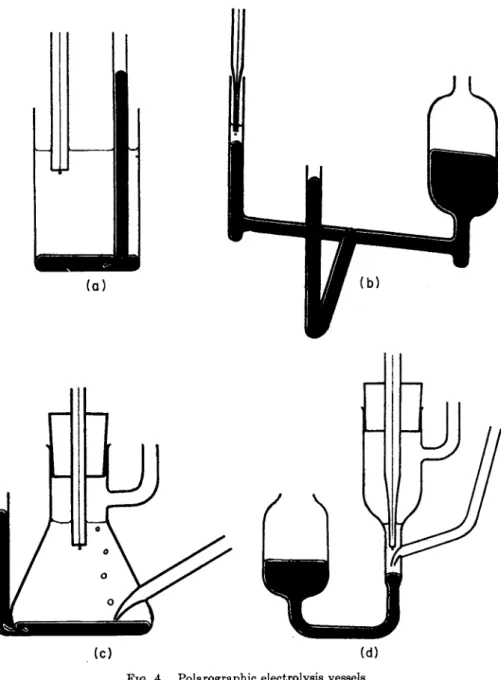
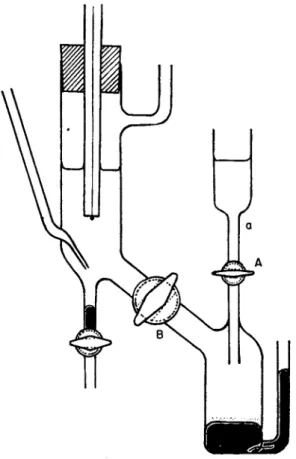
T h e electrolyte vessels have various shapes according t o the volume of liquid available and allow for conditions where atmospheric oxygen m u s t be eliminated or where the mercury pool serving as the reference electrode m u s t be separated from the solution surrounding the dropping mercury electrode. W h e n examining t h e solutions open t o air, ordinary beakers (Fig. 4a) of 5 t o 20 ml. capacity are satisfactory, containing a layer of mercury approximately 3 m m . deep. T h e Solution to be exam
ined is poured in to fill three-fourths of t h e vessel. Small volumes of 0.005 to 0.1 ml. are conveniently investigated in t h e vessel shown in Fig. 4b, for which a finely drawn-out capillary is used as the dropping electrode; the wide a r m of t h e vessel serves to keep the level of mercury constant in the narrow arm. T h e t u b e sealed on a t right-angles to the two arms contains a p l a t i n u m wire a t its lower end a n d makes electrical connection with the larger electrode. T h e vessels shown in c a n d d serve to remove atmospheric oxygen from the electrolyte solution b y bubbling an inert gas (nitrogen, hydrogen, or carbon dioxide) through t h e solution.
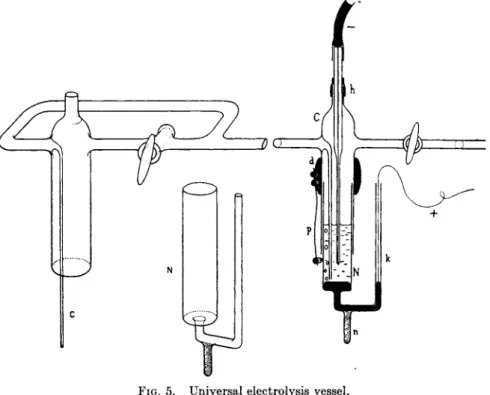
F o r repeated analyses t h e "universal vessel'' of Nov&k (35) is suitable (Fig. 5). I t consists of two p a r t s : t h e outer cylindrical jacket C and t h e inner electrolyte vessel N . T h e cylindrical jacket C is fixed to an iron stand b y a clamp so t h a t its lower edge is 25 to 30 cm. above t h e base of the stand. T h e long t u b e passing into t h e cylinder serves as inlet for an inert gas. T h e gas is passed in from a gas t a n k through a rubber t u b e connected to the horizontal t u b e with t h e stopcock. T h e capillary of the dropping electrode is inserted through the neck of the jacket, so t h a t t h e exit of the capillary reaches almost to the exit of the gas t u b e . T h e capillary is fastened a t the neck by means of a short piece ^Df rubber tubing h.
T h e dimensions of t h e jacket C a r e : inside diameter 18.5 t o 19 mm., thickness of the glass wall 1.5 mm., length of t h e cylinder 9 to 10 cm., length of t h e vertical gas t u b e 7 t o 8 cm.
T h e electrolyte vessel Ν is a glass t u b e 18 m m . in outside diameter fused t o a narrow capillary t u b e of 5 m m . outside a n d 2 m m . inside diameter. A solid rod base-η is sealed on to the narrow tube. T h e wide p a r t is 8 cm. long and the glass walls are 1 m m . thick.
I t is sufficient to provide one jacket cylinder for each polarograph.
A dozen electrolyte vessels should be available.
T h e procedure for a polarographic determination is as follows:
FIG. 4 . Polarographic electrolysis vessels.
12 J A R 0 S L A V H E Y R O V S K f
Place a b o u t three-quarters of a milliliter of mercury into the electrolyte vessel N, taking care to remove all air bubbles from the side t u b e k, then 2 to 10 ml. of t h e solution to be examined are added a n d vessel Ν is pushed into t h e cylinder C. T h e vessel Ν is fixed in position b y spring p. T h e position of the vessel Ν is adjusted t o allow t h e bubbles of inert gas to pass freely into t h e solution. T h e inner t u b e of t h e vessel Ν should fit into t h e cylinder C of t h e jacket to leave a clearance of a b o u t i m m .
FIG. 5. Universal electrolysis vessel.
Oxygen is removed from t h e solution by passing t h e inert gas through the by-pass t u b e into the solution, keeping t h e stopcock closed. During recording of t h e current-voltage curve, the stopcock is opened so t h a t the atmosphere in the jacket above t h e solution is filled with the inert gas, which escapes through t h e space between t h e two cylindrical tubes without disturbing t h e solution. Diffusion of outside air into the solution is prevented.
T h e connection to the anode is m a d e by inserting a stainless steel contact wire into the mercury of the side a r m k. A similar contact is m a d e t o t h e cathode through t h e mercury reservoir. Stainless steel wires are as satisfactory as platinum wire.
After having recorded t h e curve of one solution another vessel, filled with t h e subsequent solution, is inserted into t h e jacket and, after two or three minutes of vigorous bubbling is ready for polarographic examina
tion. F o r a large series of solutions a wooden block should be provided with holes t o support t h e electrolyte vessels on the rod n.
FIG. 6. Electrolysis vessel with a separate unpolarizable reference electrode.
T o obtain anodic a n d cathodic currents a n d t o determine t h e cor
responding half-wave potentials it is necessary to h a v e a reference electrode separate from t h e solution t o be examined. A suitable vessel for such measurements is shown in Fig. 6. T h e mercury pool is placed in t h e side vessel, separated from t h e electrolyte vessel b y a stopcock with wide bore, t o ensure good electric conductivity. A s t a n d a r d elec
trode is chosen to i m p a r t a positive potential t o t h e mercury layer; this is effected b y using a 2 Ν sodium sulfate solution slightly acidified with sulfuric acid with solid mercurous sulfate acting as depolarizer. This
1 4 J A R O S L A V H E Y R O V S K Y
electrode maintains a potential of + 0 . 4 volt compared t o the 1 Ν potas
sium chloride-calomel electrode. T h e sulfate solution is poured in through t u b e a, the t a p s A and Β being open. As soon as the solution rises above t h e t a p B, it is closed and t h e side vessel is filled above t a p A.
This t a p is then closed and any bubbles remaining in the vessel are driven out through t h e main t a p B., When the side t u b e is filled, the main vessel is rinsed with water and the electrolyte poured in. During the recording of curves t a p Β m u s t be opened. Otherwise the large ohmic resistance in t h e t a p would considerably alter t h e current-voltage curves owing to t h e large drop of potential ir.
Continuous anodic-cathodic polarization can be effected also without the introduction of a separate unpolarizable electrode when the arrange
m e n t shown in Fig. 7 is used. This is found in commercial polarographs.
As long as t h e sliding contact moves in t h e left p a r t of t h e bridge, the external e.m.f. imparts a more positive potential to the dropping mercury electrode t h a n t o the mercury pool. When the contact moves to the right side of t h e potentiometer wire, t h e direction of t h e applied voltage is inverted, making the drop'ping electrode more negative t h a n the potential of the mercury layer at the b o t t o m of the electrolytic vessel.
T h e substance to be investigated polarographically has to be present in true solution. T h e procedure of dissolving t h e sample is given in t h e experimental section and is often critical for obtaining well-defined current-voltage curves. T h e solution m u s t be electrically conducting.
A supporting electrolyte in a concentration from 0 . 1 t o 1 Ν should be present. T h e n a t u r e of the electrolyte has an influence on t h e depolariza-
FIG. 7. Scheme for continuous anodic-cathodic polarization.
4 . T E C H N I Q U E S O F I N V E S T I G A T I N G S O L U T I O N S
ο c I 0
50
2 0 3 a ¥ 0.
TV
5 0. e a
(
7 0.
r
8M
00
H /
ο c I 0
50
2 0 3 a ¥ 0.
TV
5 0. e a
(
7 0.
r
2 0.
I
3 a t a Rs a 7V
a
c 1 L ι a
I
2 0. 3 a t a R
s a 7V
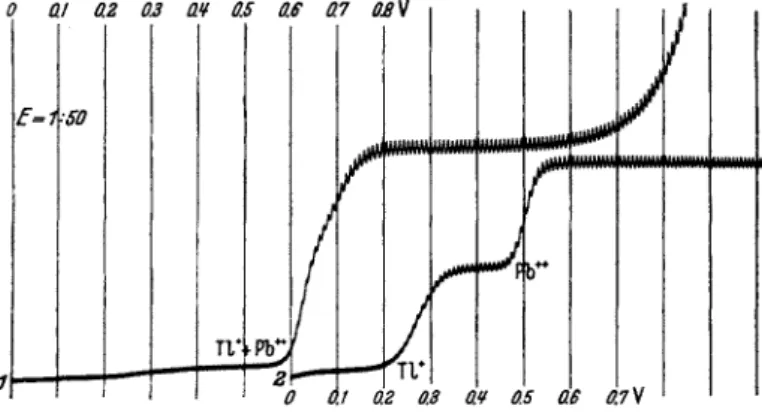
FIG. 8. Resolution of interference. Curve 1 is due to 0.001 Ν P b+ + + 0.001 Ν T l+ in 0.1 Ν H N 03; curve 2 is due to 0.001 Ν P b+ + + + 0.001 Ν T1+ in 0.1 iV NaOH.
Sensitivity of galvanometer, 1:50. Nitrogen atmosphere.
of plumbite ions. T h u s a suitable choice of t h e composition of t h e electrolyte m a y resolve coincidences. Besides alkaline solutions, polarographically suitable complexes are obtained in ammoniacal, cyanide, t a r t a r a t e , or citrate solutions. T h e cyanide complexes are of particular value, when minor constituents, of basic character, e.g. nickel, manganese, cadmium, h a v e to be determined in t h e presence of excess of ions of a noble metal, e.g., copper. I n an excess of cyanide t h e waves of copper, zinc, or iron do n o t a p p e a r a n d t h e minor constituents, which form waves in the cyanide solution, i.e. nickel, manganese, a n d cadmium, are measurable with high sensitivity. Similarly, in the determination of traces of sodium in aluminium an alkaline solution prevents t h e formation of t h e aluminium wave, a n d a wave of sodium m a y be obtained. T h e indifferent electrolyte recommended has to be one of high decomposition voltage, i.e., lithium hydroxide, calcium hydroxide, or a hydroxide of a q u a t e r n a r y amine, N ( C2H6) 4 0 H or N ( C H3)4O H .
Sulfite is often added to ammoniacal and alkaline solutions when the tion potentials of the components t h a t are polarographically active, since the potentials change according t o t h e stability of t h e complexes formed between the depolarizer a n d t h e electrolyte. This effect is illustrated in Fig. 8. Curve 1 is due to 10~4 Ν thallium sulfate in 0.1 Ν nitric acid.
After t h e addition of a n equivalent a m o u n t of plumbous ions t h e waves for lead a n d thallium ions coalesce, because their half-wave potentials practically coincide. Addition of a n excess of alkali produces curve 2 which now shows two distinct w a v e s ; t h e first caused b y thallium ions, which do n o t form complexes with hydroxyl ions, t h e second wave a t a potential more negative b y 0.3 volt due t o lead, which is now in t h e form
16 J A R O S L A V H E Y R O V S K Y
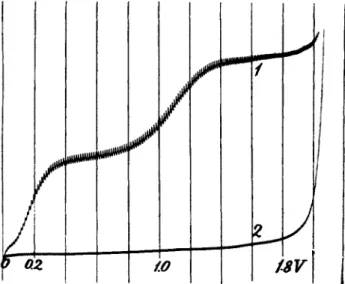
solution is to be freed from oxygen. Atmospheric oxygen, present in all solutions in a concentration of a b o u t 8 mg. per liter, i.e., 0.001 Ν (at ordinary room temperature) produces a double wave, t h e first step of which is due to the reduction 02 —» H202 and the second to the reaction H202— » H20 (Fig. 9). T h e addition of sulfite in a 0.1 Ν concentration (about 1 %) or 30 t o 40 bubbles of sulfur dioxide (55) removes t h e oxygen wave completely (curve 2). Cupric ions accelerate the reaction between oxygen and sulfite, otherwise likely t o be retarded b y a m m o n i a a n d m a n y organic substances. I t is therefore advisable t o add a trace of a cupric salt, if copper is not already in the solution t o be analyzed.
FIG. 9. Curve 1: 0.1 Ν NaOH + 0.02% gelatin, open to the air. Curve 2: the same solution after addition of 2 drops saturated N a2S 03 to 10 ml. Sensitivity, 1:32.
Another substance t o be added t o t h e solution before polarographic examination is gelatine, or a similar colloid, which removes maxima from the current-voltage curves and makes diffusion currents reproducible and well measurable. Figure 10 shows a curve obtained before (1) and after (2) the addition of 0 . 0 2 % gelatine. T h e function of t h e colloid is to d a m p the streaming of electrolyte around the polarized mercury drop, caused by the inhomogenous electric field close to t h e capillary. Such streaming, observable with a microscope, transports t h e depolarizer to the surface of the dropping electrode so quickly t h a t t h e current is often several times larger t h a n under normal conditions of diffusion. T h e charges of the colloids counterbalance t h e inhomogenous electric field a n d stop t h e motion of t h e electrolyte.
T h e solution, freed from air and containing t h e indifferent electrolyte
a n d colloid, is ready for polarographic examination. After adjusting t h e sensitivity of t h e galvanometer t o obtain measurable waves, t h e curve is recorded. F r o m t h e polarogram t h e half-wave potentials h a v e t o be ascertained, if qualitative determinations are required. These are found, if a s t a n d a r d electrode (e.g., t h e s a t u r a t e d potassium chloride- calomel electrode) is used as separate anode. If both electrodes are in t h e same solution a n d vessel, a depolarizer is added (e.g., a trace of thallium sulfate), whose half-wave value is well known (—0.5 volt based on t h e 1 Ν potassium chloride-calomel scale, —0.46 volt based on t h e s a t u r a t e d calomel electrode scale). F r o m this value other half-wave
FIG. 10. Curve 1: 0.002 Ν CuCl2 in 0.1 Ν HC1; curve 2: the same solution con
taining 0.02% gelatin. Nitrogen atmosphere. Sensitivity, 1:64. (Curve 2 shifted below curve 1.)
potentials are determined (Fig. 11). I n routine analysis, however, t h e components are known a n d h a v e t o be determined only quantitatively.
Quantitative determinations are carried out either b y means of a calibration curve or b y t h e m e t h o d of " s t a n d a r d a d d i t i o n ., , T h e prin
ciple of the determination from a calibration curve is shown in Figs. 12 and 13. If a component in a sample, for example, c a d m i u m in zincblende, has t o be determined, known c a d m i u m solutions are m a d e u p with a suitable indifferent electrolyte, i.e., 2 Ν a m m o n i u m hydroxide a n d 2 Ν a m m o n i u m chloride containing 0 . 0 1 % gelatine a n d 0.01 Ν sodium sulfite, a n d t h e curves are recorded (Fig. 13). T h e heights of t h e waves are then plotted on a graph giving t h e dependence of t h e diffusion current on t h e concentration of cadmium (Fig. 12). T h e samples to be analyzed
Ο 0.2 WV
18 J A R O S L A V H E Y R O V S K Y
0 0.1 0.3 O.f 0.5 0.6 0.7 0.9 1.0 /./ t.2 1.3 1,V t.5 Ι.6Ί FIG. 11. Lower curve: 0.1 Ν NH4OH, 0.1 Ν N H4 CI, 0.1 Ν N a2S O80 . 0 1 % gelatin with 0.001 Ν C d+ +, Zn++ M n+ +. Upper curve: the same solution with 0.001 Ν T1+.
Sensitivity, 1:50.
5 «ΙΟ-* 1 0 - 3N . Cd FIG. 12. A calibration curve for Cd in zincblende.
are dissolved in the same solution used for the calibration values and the polarographic curves are recorded under exactly the same conditions, i.e., with t h e same capillary, the same pressure of mercury, the same sensitivity of t h e galvanometer and a t exactly t h e same temperature.
T h e electrolytic cell with the reservoir should be placed in a thermostat.
T o avoid this inconvenience one m a y register the polarographic curves of
several samples on one polarogram and add one curve of a s t a n d a r d solution, taking for granted t h a t the t e m p e r a t u r e of the room and solu
tions h a s not changed b y more t h a n 0.5°C. T h e t e m p e r a t u r e coefficient of t h e diffusion currents is 1.6%. If the s t a n d a r d curve has a wave height near those of the samples, t h e concentration χ of the u n k n o w n is calculated from simple proportionality as χ = — % > where a is t h e weight of t h e component in t h e s t a n d a r d solution, hx t h e height of wave for the solution of the sample, h the height of the wave for t h e s t a n d a r d and w is t h e weight of t h e sample.
T h e assumption t h a t the t e m p e r a t u r e does not change during record
ing is best fulfilled if a s t a n d a r d addition is m a d e a t once to each sample
FIG. 13. A calibration polarogram showing the increase of the wave due to an increasing concentration of C d+ + ions in 0.1 Ν NH4OH, 0.01 Ν NH4C1 in nitrogen atmosphere. Sensitivity, 1:20.
after its curve has been taken. W h e n a ml. of t h e s t a n d a r d solution is added t o ν ml. of the solution a n d t h e polarographic wave is increased from h to h', the unknown concentration χ of t h e sample is given b y
he
χ = ^/ _|_ Q^r _ foy/v' where c denotes the concentration of the s t a n d a r d solution.
Spdlenka (41) uses a more exact procedure by removing two equal volumes from the dissolved sample. One portion is diluted to 100 ml.
with t h e indifferent electrolyte. A known a m o u n t of t h e component to be determined is added to the other portion a n d diluted with the indiffer
ent electrolyte to the same volume as the first portion. T h e second solution gives a higher wave, h, t h a n the first solution, which gives a wave of height hx. T h e concentration χ of the component in the sample
. . 100ahx
is given as χ = (h — hx)w %, where a is the weight of the s t a n d a r d addi-
20 J A R O S L A V H E Y R O V S K Y
tion a n d w t h a t of t h e sample. This m e t h o d has an a d v a n t a g e in t h a t t h e component in b o t h t h e s t a n d a r d a n d the sample solution are mixed with t h e other components, so t h a t possible losses due t o adsorption, which should be almost identical in both solutions are eliminated.
T h e procedure of " q u o t i e n t of two w a v e s " is independent of t e m p e r a t u r e (6). A known q u a n t i t y of a certain depolarizer is added to each solution if another depolarizer is to be determined. I t is assumed t h a t the r a t i o of t h e two waves is independent of t h e temperature, viscosity, rate of flow of mercury, etc. One needs only t o determine t h e calibration curves, giving t h e dependence of t h e ratio of the two waves on the con
centration of the depolarizer to be determined, if t h e concentration of the other depolarizer is k e p t constant. This relation gives practically a straight line.
T h e methods here described offer b u t little a d v a n t a g e for analysis, if only one sample of an u n k n o w n composition is to be examined. T h e y are, however, of great value in series analyses of samples of similar composition.
5. S E N S I T I V I T Y A N D A C C U R A C Y O F T H E M E T H O D
T h e sensitivity of the polarographic method is limited p a r t l y b y t h e oscillations of t h e galvanometer caused b y the dropping of mercury and partly b y the capacity (condenser) current which charges the dropping electrode to the applied potential. T h e latter is of the order of 10~8 to 10~7 a m p . Depolarizers in a 10~4 Ν concentration give a wave cor
responding to 3 X 10~7 amp., i.e., a b o u t 10 cm., if t h e greatest sensitivity of t h e galvanometer is used. A depolarizer in a concentration of 10~6 Ν would give a diffusion current of 3 Χ 10~9 amp., i.e., a wave 1 m m . high indistinguishable from the capacity current.
T h e compensation method of Ilkovio a n d Semerano (19) p a r t l y counterbalances the capacity current, so t h a t it remains almost c o n s t a n t : I n this case one can estimate depolarizer concentrations as low as 5 X ΙΟ"6 N.
Since polarographic measurements m a y be carried out with liquid volumes as small as 0.01 ml., t h e sensitivity is sufficient t o measure a b o u t 5 X 10~9 g. of an unknown depolarizer.
Regarding accuracy, it is advantageous t o have waves in t h e form of easily measurable steps, which is t h e case in the concentration range between 10~4 Ν a n d 10~3 N. T h e height of the wave is measurable to 1 %, which represents the limit of the accuracy of polarographic measure
ments. T o obtain exactly reproducible results, all the physical factors determining the diffusion current h a v e t o be k e p t strictly constant, which requires care particularly in regard to t e m p e r a t u r e changes.
If small quantities of the depolarizer are present, the shape of t h e waves is sometimes indefinite, so t h a t an exact measure of t h e height of wave is impossible. T h e waves become disfigured especially when applying t h e compensation of the capacity current (Fig. 1 4 ) . I n such cases it is recommended the direction of t h e lines before and behind t h e wave be extended a n d an ordinate be drawn a t t h e half-wave potential;
FIG. 1 4 . Evaluation of the height of wave when using compensation of the charging current. 5 · 1 0 ~Δ Ν PbCl2 in 0 . 1 Ν NaOH. Sensitivity, 1 : 5 . Nitrogen atmosphere.
the distance between the points at' which the lines intersect t h e ordinate is regarded as the true height of the wave.
6. T A B L E S O F D E P O L A R I Z A T I O N P O T E N T I A L S
Although polarography is rarely used for qualitative determinations of the components in solution, it is necessary to have a s u m m a r y of t h e half-wave potentials in order to recognize t h e wave ©f the depolarizer and to avoid coincidences, especially when trying t o develop a special method.
T h e values of the half-wave potentials are given on p . 6 for various solutions of different electrolytes. T h e values are also represented in tables I I I a n d IV as "polarographic s p e c t r a " to serve for comparison with real polarograms. When comparing t h e positions of the half-waves, it must be borne in mind t h a t if another diffusion current of value id precedes a curve its half-wave value is shifted towards greater voltage by the drop of potential id * r across the cell, where r is t h e resistance of the cell. As r is usually of the order of 1 0 0 ohms, and id approximately 1 0 ~4 amp., the shift m a y be larger t h a n 1 0 mv. T h e values in the tables are referred to the potential of the normal potassium chloride-calomel
22 J A R O S L A V H E Y R O V S K Y
electrode, whereas the half-wave values obtained from the polarograms are referred t o the potential of the unpolarizable electrode used in the electrolysis. T h e values in the tables are obtained when the value of the potential of t h e unpolarizable electrode is added, t o t h e experimental
TABLE II
Reduction Potentials of Inorganic Substances
Reduction process
Potential
Reduction process In acid In neutral In ammo- niacal
In alka
line Reduction process
Electrolyte, containing monovalent cations, like N a+, K+ N H4 +, H+
02 — H202 + 0 . 0 5 » 0* - 0 . 1 7 » - 0 . 2 0 *
H202- > H20 - 0 . 8 - 1 . 1 - 1 . 1 - 1 . 2
( C N )2- > 2 C N - — - 1 . 1 5 ° — —
S 02 S2O4- - 0 . 3 1 - 1 . 1 3 — —
N O ( H N 02) -» N H , - 0 . 7 6 ° —
—
—NO," N 02" -> N H , — - 1 . 3 · · * — — BrO,~ -> Br- - 0 . 9 7 - 1 . 8 5 - 1 . 7 2 - 1 . 8 5 °
I O , - — T - 0 . 3 0 - 1 . 3 - 1 . 2 - 1 . 2 5
I O r - * 1 0 , - + 0 . 1 5 » - 0 . 4 — —
ReOr -> Re~ - 0 . 4 5 - 1 . 2 0 ° — - 1 . 4 0 °
T J0 j+ + — /Ijv/Uiv - 0 . 1 - 0 . 2 8 , - 1 . 0 8 - 0 . 8 , - 1 . 4 —
EU+++ -» E u+ + - 0 . 7 7 — — —
Yb+++ -> Yb++ - 1 . 4 8 — — —
- 0 . 9 8 — — —
v o , - -+ / v+ +/ v+ + + - 0 . 8 3 — - 1 . 2 3 - 1 . 6 6
Co+++ C o+ + — — - 0 . 4 1 —
Cr+++ - * C r+ + - 0 . 7 8 - 0 . 9 6 - 1 . 4 6 — C r 04" C r+ + + — - 0 . 3 0 , - 1 . 0 0 - 0 . 3 6 - 0 . 8 9
M 0 O 4 - - * M o+ + + - 0 . 3 — — —
w o * - W+ + + - 0 . 4 6 — — —
O s 04- -> O s 02 — — — • - 0 . 4 4
O s 02 -» O s202 — — — - 1 . 2 0
SeO,- Se - 0 . 1 — - 1 . 4 3 —
TeOr -> Te - 0 . 4 8 — - 0 . 6 5 —
α Foot of wave, otherwise half-wave potentials.
»In O.ltfLaCh.
half-wave potentials, e.g., + 0 . 4 volt in the case of sulfuric acid and sulfate solutions, or —0.2 volt in normal alkalies. Only values found from the curves determined in 1 Ν chloride solution coincide with those in t h e tables, b o t h being referred to the same potential, i.e., to t h a t of the 1 Ν potassium chloride-calomel electrode. T h e values found empirically
TABLE III
Anodic Depolarization Potentials
Concentration of Foot of Half-wave
anions 0.001 Ν wave Process potential
Hg + Cl"-> HgCl + 0 .17 F e+ +- * F e+ + + (0.1 Ν K H F2) + 0 .08 Hg + CNS"-> HgCNS + 0 .10 F e+ +- > F e+ + + (NH4OH, - 0 38
NH4CI)
Hg + Br~ -> HgBr + 0 04 M n+ + - , M n+ + + (2 Ν KOH - 0 40 with tartarate)
Hg + 2 0 H - HgO + H20 + 0 00 S n+ +- > S n+ + + + (HC1) - 0 06 Hg + 2 S 03- - H g ( S 03)2 - 0 07 S n+ +- > S n+ + + + (Tartarate or - 0 48
citrate buffer, pH = 7)
H g + I - - * H g I - 0 11 Sn++-> S n ++ + + (0.1 Ν KOH) - 0 61 H g + 2 S203- - - H g ( S20 3 ) - 0 30 Ti+++-> T i ++ + + ( H C 1) - 0 18 Hg + 2 C N - - H g ( C N )2 - 0 42 V++++-* V+ + + + + (1 Ν KOH) - 0 46 Hg + S"-> HgS - 0 70 S b+ + +- » S b+ + + + + (0.5 Ν KOH) - 0 34
A s+ + +- » AB+++++ (0.5 Ν KOH) - 0 25
TABLE IV
Half-Wave Potentials of Some Inorganic Redox Processes
Process Electrolyte
C u+ τ± C u+ + 0.1 Ν N a2S 04 - 0 .06 C u+ τ± C u+ + 1 Ν NH4OH, 1 Ν NH4C1 - 0 .25 C u+ <± C u+ + Citrate buffer p H = 7 - 0 21 C r+ + τ± C r+ + + Saturated with CaCl2 - 0 55 F e+ + <=± F e+ + + 1 Ν sodium oxalate - 0 30 F e+ + ^ F e+ + + Citrate buffer p H = 7 - 0 4°;
F e+ + τ± F e+ + + 1 Ν KOH - 0 9 Saturated with CaCl2 - 0 15
^± »pi++++ 0.1 Ν KCNS* - 0 49
^+++ »p-++++ Citric or acetic acid - 0 48
y++ y+++ 1 Ν H2S 04 - 0 55
7. A P P L I C A T I O N S
T h e chief operation preceding t h e polarographic investigations is t h e p r e p a r a t i o n of t h e sample. As t h e r e is, however, no general rule for dissolving a solid a n d since t h e reagents t h a t h a v e t o be used depend largely on t h e c o m p o n e n t s t o be determined, t h e procedure is in each case a d a p t e d t o t h e species present. I t is c u s t o m a r y in p o l a r o g r a p h y t o use t h e simplest possible operation a n d t o avoid l e n g t h y q u a n t i t a t i v e opera-
when t h e reference electrode is t h e s a t u r a t e d p o t a s s i u m chloride-calomel electrode h a v e t o be m a d e m o r e n e g a t i v e b y 40 m v . t o be referred t o t h e 1 Ν calomel electrode.
24 J A R O S L A V H E Y R O V S K Y
tions such as fusion, filtration, washing of precipitates, centrifuging, etc.
T h e best w a y is t o dissolve t h e weighed sample directly in a measuring flask and t o dilute it t o a known volume with a suitable indifferent elec
trolyte. F o r nobler metals nitric acid or a q u a regia is suitable, for baser metals hydrochloric acid should be used since nitrates a n d nitrites produce u n w a n t e d polarographic effects, especially troublesome when di- or trivalent metallic cations are present in solution.
If a n excess of a nobler constituent or a coinciding depolarizer inter
fere with a particular determination they h a v e t o be chemically removed by precipitation or extraction. I t is significant for t h e polarographic method t h a t t h e interfering substances need n o t be removed entirely for it suffices if t h e y are present in a lower concentration t h a n t h e con
stituent t o be determined.
Lithium h a s t h e most negative half-wave potential of t h e alkali group and its value differs enough from t h e potentials of sodium, potassium, rubidium, caesium, strontium, a n d barium t o give a distinctly separate wave. These ions, however, m u s t n o t be present in concentration of more t h a n 20 times t h a t of lithium. T h e most suitable indifferent electrolyte is 0.1 Ν N ( C H3)4O H or N ( C2H5)4O H . T h e presence of atmospheric oxygen does n o t interfere with t h e determination, although with small a m o u n t s of lithium present, greater sensitivity is obtained in t h e absence of oxygen.
Sodium and potassium cannot be determined separately, as their half-wave potentials almost coincide. T h u s t h e height of t h e wave gives their sum. F o r t h e determination in water 1 drop οϊ 1 Ν phosphoric acid, 1 ml. of 0.5 Ν N( C H3) 4 0 H a n d 1 ml. of distilled water is added t o 1 ml. of t h e sample a n d t h e mixture polarographically investigated in contact with air (31).
Sodium in ceramic material in the presence of high aluminium content:
5 t o 20 mg. of t h e finely powdered substance is dissolved b y heating with 0.3 ml. 1 Ν sulfuric acid a n d 0.5 ml. 4 0 % hydrofluoric acid in a platinum crucible. After evaporation t h e residue is dissolved in 1 drop 1 Ν phosphoric acid a n d 1.0 ml. 0.5 Ν N ( C H3)4O H or N ( C2H6)4O H . After t h e addition of 0.5 ml. water t h e solution is transferred into a small electrolytic vessel a n d polarographed open t o air (Fig. 15).
Sodium in magnesium: A small piece of t h e metal is burned in a [closed vessel, a n d t h e oxide is extracted with s a t u r a t e d lime-water or 0.1 Ν N ( C2H B )4O H. T h e curve of this solution shows a distinct wave of t h e sodium.
Sodium in aluminum or its salts: 15 mg. of t h e metal are dissolved in a few drops of hydrochloric acid a n d t h e solution evaporated almost t o dryness. T w o - t e n t h s of a milliliter of water a n d t h e requisite a m o u n t of
0.5 Ν N ( C2H5) 4 0 H to redissolve t h e a l u m i n u m salt as aluminate are added with 1 ml. water. This solution is pol&rographed open t o air.
If an aluminum salt is to be examined, 0.2 ml. of its 0.5 Ν solution is used a n d enough 0.2 Ν N ( C2H B ) 4 0 H is added to redissolve the pre
cipitate. T h e solution is diluted exactly to 2 or 3 ml. b y adding water and polarographed. Urech and Sulzberger (53) have modified the above method to determine traces of sodium in very pure aluminum. A con
centrated solution of aluminum chloride is precipitated b y passing hydrogen chloride gas through it. T h e remaining liquor is concentrated by evaporation, the residue dissolved by adding dilute hydrochloric acid and the solution is precipitated with a m m o n i u m hydroxide. T h e clear solution is evaporated to dryness, the residue dissolved in 0.2 Ν
FIG. 1 5 . Waves due to 0 . 0 0 1 Ν K + and Na"1" in 0 . 1 Ν N ( C H , )4O H , open to air.
N ( C H3) 4 0 H a n d polarographed. As little as 0 . 0 0 1 % sodium in alumin
ium can be determined in this way.
Alkaline earths: According to K i m u r a (21) t h e three alkaline earths give distinct a n d separate waves in alkaline solution. Zlotowski and Kolthoff (57, 58) have worked out a m e t h o d to determine calcium, strontium, and barium in neutral solutions in a mixture of 50 to 8 0 % ethyl alcohol a n d water, the indifferent electrolyte being 0.2 to 0.3 Ν Ν(02Ηδ)4ΐ. Since calcium tends to form a maximum, t h e solution has to contain some barium ions.
Magnesium and beryllium when depositing in aqueous solutions are accompanied b y evolution of hydrogen, which prevents their polaro- graphic determination.
Aluminum offers difficulties, since it hydrolyzes in solution and the wave due to the deposition of hydrogen ions closely precedes t h a t of aluminium. T h u s t h e p H of t h e solution m u s t be carefully k e p t between 2.6 and 2.7. T h e procedure of H o v k e r (15, 40) considers the presence of iron and effects its reduction to the divalent form b y hydrazine. T h e
26 J A R O S L A V H E Y R O V S K Y
determination is carried out as follows: 5 ml. of the solution of clay, diluted so t h a t 40 ml. would contain a b o u t 20 mg. aluminum, are evapo
rated to dryness in a porcelain dish with 3 ml. concentrated sulfuric acid.
Dilute sulfuric acid is added a n d again evaporated to dryness. After cooling the residue is dissolved in 8 ml. 0.1 Ν sulfuric acid and warmed with 40 ml. water to bring all basic salts into solution. This solution is filtered into a 100 ml. measuring flask and diluted to the mark. T h e p H of this solution lies between 1.70 and 1.80. For polarographic examina
tion 30 ml. of the indifferent electrolyte solution are added to 10 ml. of this solution having the following composition: 1.5 g. lithium oxide, 2.0 g. lithium sulfate, 50 g. tylose, 1.0 g. hydrazine sulfate in 1000 ml. of water. T h e p H of the final solution is between 2.60 and 2.70. T h e curve is recorded with t h e solution open to air and shows the waves due to the reduction of oxygen, deposition of ferrous and hydrogen ion, and of aluminium a t —1.7 volt.
Aluminum in magnesium (7): 0.2 to 0.5 g. of the alloy is dissolved in a slight excess of 2 Ν hydrochloric acid. After cooling bromphenol blue indicator is added and the solution is neutralized first with calcium hydroxide until t h e color changes from yellow to greenish-yellow. Cal
cium hydroxide solution is carefully added until the color is light-green.
This solution is diluted to 1000 ml. and a small portion of it is polaro- graphed in a nitrogen atmosphere.
Aluminum in steel is determined by extracting the iron as ferric chloride with ether. T h e sample (500 mg.) is dissolved in 10 ml. hydro
chloric acid (1:1), oxidized b y hydrogen peroxide a n d finally with potassium chlorate. T h e solution is evaporated to dryness, heated a t 130°C. in an oven to effect the separation of silica. T h e residue is dis
solved in a small a m o u n t of water, more water is added and silica is filtered off. T h e filter paper is thoroughly rinsed with dilute h y d r o chloric acid. T h e filtrate is again condensed to a few milliliters, mixed with 30 ml. hydrochloric acid (1:1), and extracted with ether. When the greenish-yellow coloration disappears, 5 ml. hydrogen peroxide and 5 ml.
hydrochloric acid (1:1) are added and extracted further until no color remains. T h e etherial layer is separated from the aqueous solution in a funnel and the aqueous solution is evaporated to a few milliliters in a beaker and transferred to a 100 ml. measuring flask. T o this solution are added 5 ml. of 5 Ν lithium chloride with methyl orange as indicator, neutralized with lithium hydroxide, 2 ml. of 0.1 Ν hydrochloric acid are added a n d the solution diluted to the m a r k with water. F r o m this solution a small volume is used for the polarographic record, starting from 1 volt of the applied e.m.f. T h e small a m o u n t of iron t h a t remains in the solution does not interfere with t h e wave of aluminum.
Manganese belongs t o t h e polarographically most easily determined elements since its salt solutions are not hydrolyzed a n d produce well developed waves; complexes with a m m o n i u m hydroxide, cyanide, and thiocyanide are also suitable, as well as t h e t a r t a r a t e complex which give an anodic wave. In alkaline solutions t h e manganous ion is readily oxidized to t h e manganic ion, a n d atmospheric oxygen m u s t be carefully eliminated. As sodium sulfite is n o t sufficient, " M e t o l " (monomethyl paramidophenol sulfate) has t o be present t o keep manganese in its divalent form.
Determination in ammoniacal solutions: 5 ml. of a neutral or acid solution, which should contain less t h a n 0.1 t o 0 . 2 % manganese, is freed from oxygen b y carbon dioxide. T h e n 0.5 ml. of a solution containing 0.2 g. " M e t o l " in 100 ml. 1 Ν hydrochloric acid a n d 0.2 g. gelatin is added a n d finally 1 ml. of concentrated a m m o n i u m hydroxide. After allowing 5 minutes for cooling t h e solution is examined, open t o air, starting from 1 volt with t h e manganese wave appearing a t 1.4 volt.
Manganese in aluminum alloys (44): t h e accurately weighed sample (0.5 g.) is placed in a 50 ml. measuring flask a n d dissolved in 8 ml. of hydrochloric acid (1:1) Five to t w e n t y drops of 3 0 % hydrogen peroxide are added a n d t h e mixture is brought to boiling to dissolve traces of copper. T h e n 2 ml. of a s a t u r a t e d sodium sulfite solution a n d 3 ml. of a
" M e t o l " solution (consisting of 0.1 g. " M e t o l , " 2 ml. s a t u r a t e d sodium sulfite and 5 ml. concentrated hydrochloric acid in 100 ml. water) are added to the warm solution a n d well stirred. Fifteen milliliters of a t a r t a r a t e solution (containing 500 g. potassium t a r t a r a t e · 4 Η20 a n d 10 ml.
s a t u r a t e d sodium sulfite in 1000 ml. water) and 10 ml. of a cyanide solu
tion (164 g. potassium cyanide, 200 g. sodium hydroxide, a n d 10 ml.
s a t u r a t e d sodium sulfite in 1000 ml. water) are added, the contents of t h e flask well shaken a n d cooled down quickly to room t e m p e r a t u r e . After addition of 1 ml. of a gelatin solution (0.5 g. gelatin, 3 ml. concentrated hydrochloric acid in 100 ml. water) the solution is diluted to t h e 50 ml. m a r k and well shaken. A small portion of this solution is placed in a small open beaker a n d polarographed from 0 volt to 1.2 volt.
Manganese in zinc is determined (44) in an ammoniacal cyanide solution, t o prevent the formation of the zinc wave. T h e sample is dissolved as described above for t h e a l u m i n u m alloy. After the addition of sodium sulfite and " M e t o l , " 10 ml. of a m m o n i u m hydroxide (500 ml.
s a t u r a t e d a m m o n i u m hydroxide a n d 20 ml. saturated sodium sulfite in 1000 ml. water) are added a n d the solution cooled. Fifteen milliliters of a cyanide solution (326 g. potassium cyanide and 20 g. sodium hydrox
ide in 1000 ml. water) and 5 ml. sodium hydroxide (40 g. sodium hydrox
ide and 5 ml. saturated sodium sulfite in 100 ml. water) are added, t h e