Renevable Energy and Economic Development in the European Union
Jacek Brożyna, Grzegorz Mentel, Beata Szetela
Department of Quantitative Methods, Faculty of Management, Rzeszow, University of Technology
al. Powstańców Warszawy 10, 35-959 Rzeszów, Poland E-mail: {jacek.brozyna, gmentel, beata}@prz.edu.pl
Abstract: In recent years, the world has been facing issues concerning global warming and climate change. Therefore, one of the EU's priorities is limitation of gas emissions and promotion of energy production from renewable sources. On 23 April 2009, taking into account the level of economic development and the sources from which energy is obtained, the EU adopted Directive of the European Parliament and Council No 2009/29, which imposed limits on member states for the production of greenhouse gases. The aim of this research is to investigate whether and to what extent economic development stimulates the production of energy from renewable sources. For this purpose, we analyzed data from 28 EU countries from 2004 to 2014 to determine whether countries characterized by large greenhouse emissions are catching up "green" nations.
Keywords: renewable energy; global warming; climate change; hierarchical cluster analysis
1 Introduction
In recent years, Europe and the rest of the world have faced a huge challenge:
striking a balance between ecology and environmental protection, political and business interests, and meeting the energy needs of individual economies. In Europe, work on energy issues began during the period of the European Coal and Steel Community. In 1968, a document entitled "First orientation for a common energy policy1" was published, whose aim was to lay the groundwork for the creation of a common energy market based on cooperation and protection of the interests of individual countries. The document also emphasized the need for action towards the reduction of energy consumption. The turning point in energy
1 First Orientation for a Common Energy Policy, Communication from the EC to the Council, 18 December 1968
policy for Europe was the 1970s energy crisis in the Middle east, which caused a dramatic spike in oil prices. This had a negative impact on individual economies, and highlighted their enormous dependence on external sources of energy, especially oil. The governments of European countries thus, began to create and adopt national energy programs intended to rationalize and optimize energy consumption, both by households and industry. It was during this period that the concept of an open internal energy market was developed2, which fundamentally addressed the issue of energy production on competitive terms, while taking into account the requirements of environmental protection and energy policy [1]. This, therefore, constituted a breakthrough which, in a certain sense, laid the foundation for the further development of renewable energy. It became clear that the cost of obtaining energy would continue to rise, and would impede the development of individual countries in the long-term. This necessitated investment in technologies and solutions aimed at facilitating the obtainment, distribution, and conservation of energy. The Lisbon Treaty of 1992 significantly increased the importance of energy in the EU, which was considered a common value of all member states.
The new Lisbon Treaty of 2007, in Art. 194 of the Treaty on the Functioning of the European Union (TFEU), identified four main energy policy objectives: to guarantee the functioning of the energy market; to guarantee the supply of energy to EU countries; to promote energy efficiency and development of new and renewable energy sources; and to promote international energy ties 3. The European Union subsequently published a number of documents and directives, such as a Green Paper and White Paper, Directive 96/92/EC on the common principles of the internal energy market, and Directive 98/30/EC on the common principles of internal gas market. All of these documents contributed to the ongoing effort to establish and enforce the principles of operation and liberalization of a common, European energy market that respects the interests of individual nations. The reformation and optimization of the EU energy market has been a tedious and complicated process, in which the short-term interests of individual countries often stand in conflict with the aims and objectives of the community. Moreover, the efficiency with which specific directives have been implemented on the domestic level has been far from satisfactory. The political turmoil in Europe as a result of the economic crisis and the conflict near the Ukrainian border with Russia have led to an intensification of efforts towards the energy security of the EU, a consequence of which was the 2007 adoption o the Energy and Climate Package. Then, in 2009, Directive 2009/29/EC of the European Parliament and of the Council was adopted, which imposed on member states the obligation to reduce production of greenhouse gases, depending on their level of economic development and the sources from which they obtain energy.
2 Draft document on the internal energy market, Internal Energy Market 1988, COM (88) 238
3 http://www.europarl.europa.eu/meetdocs/2009_2014/documents/envi/dv/201/201006/
20100602_envi_study_energy_policy_en.pdf
It is worth noting that since the 1970s, all studies on energy issues emphasize a strong correlation between increased efficiency and reduced costs of obtainment, distribution, and optimal use of energy, as well as economic development. In light of the above, they, therefore emphasize the need to diversify energy sources.
Another key issue is currently the ecology of energy policy due to the negative impact of CO2 emissions on rapidly progressing climate change, as well as the threats related thereto. Hence, the increasing stress on replacing traditional energy sources with renewable energy sources. The aim of this article is therefore to determine if and to what extent economic development stimulates the production of energy from renewable sources. For this purpose, data from 28 EU countries from 2004 to 2014 was analyzed. Using taxonomic methods such as Ward's method, the countries analyzed were clustered according to their exploitation of renewable energy potential. Paper length must be between 12 and 20 pages.
2 Literature Review
There are conflicting views on the impact of renewable energy on economic growth. Formally, an increase in production and total demand is caused by an increase in energy consumption; however, some experts suggest that an increase in energy consumption is not a determinant of economic growth and total demand, but on the contrary a result thereof. The issue is thus not as straightforward as it may seem.
Limited energy resources and regulation by the European Commission over the years have led to increased efforts in the search for renewable energy sources, especially in European countries. Also, important here is the fact that renewable energy is significantly less harmful for the natural environment than non- renewable energy, which has triggered efforts to obtain energy from more environmentally friendly sources. Another determinant is that some countries provide additional tax incentives for investors in the sector, or grants to support projects related to energy production from renewable sources [2].
We must therefore explore the causal link between renewable energy production and the development of individual states on the basis on global research.
Hypotheses concerning the issue are fairly diverse, which may be a consequence of the different data sets used in analyses, the profiles of the counties analyzed, and the application of various econometric methods.
We will consider two aspects of the above mentioned link: the relationship between the use of energy in general and economic growth; and the relationship between renewable energy and economic development. The latter aspect has been addressed by the research of R. Sarl, et al. [4]. They examined the issue in the American market on a monthly basis from 2001-2005 using the ARDL method.
P. Sadorsky [5] conducted a similar study in 18 developing countries from 1994- 2003, using panels of contingency and detailed panels of the modified OLS method. Both the first group or researchers and P. Sadorsky demonstrated the validity of the hypothesis that an increase in energy usage is stimulated by economic growth. They claim that this relationship is nevertheless one-way, as manifestations of a potential energy-saving policy are not harmful for economic growth. This type of hypothesis is called a conservation hypothesis, and has also been confirmed in the studies of J. Kraft and A. Kraft [6] on the market in the USA, W. Lise and K. Van Montfort [7] on Turkey, C. C. Lee [8] on France, Italy and Japan, A.E. Akinlo [9] on Sudan and Zimbabwe, M. Shahbaz and others [10]
on Portugal, and X. P. Zhang and X. M. Cheng [11] on China. Likewise, C.
Caraiani and others [12] used the Granger causality test to analyze the causal link between energy usage and GDP in five emerging European countries from 1980- 2013. They proved the validity of the hypothesis for Hungary, Poland, and Turkey, in turn D. Makarenko and D. Streimikiene [13] for Ukraine. D.
Striemkine and others [14] reached the similar conclusions for the Baltic countries.
In contrast, Y. Fang [15] tested what is referred to as the growth hypothesis based on the analyses of the Chinese market from 1978-2008. This hypothesis expresses the idea that energy consumption is an important factor in economic growth, and that energy-saving policies can have a negative impact on the economy. N.
Magnani and A. Vanona, who analyzed regions of Italy from 1997 to 2007, as well as R. Iglesi-Lotz [17], based on his observations of OECD countries, also confirm this hypothesis. Further support can be found in the work of A.N.
Menegaki [18], who analyzed 27 European countries from 1997 to 2007, along with that of A. K. Tiwari, who used the VaR method to analyze the Indian market for nearly 50 years from 1960-2009. N. Apergis and J. E. Payne conducted a wide range of studies on the issue [20] in 80 countries, including in Central America. O.
Ocal & A. Aslan [21] considered the relationship between renewable energy and economic growth on the basis of analyses of 18 countries from 1994-2003, and confirmed a correlation between the above mentioned factors. A. A. Azlina et al.
[22] did the same on the basis of data from 1975-2011 using an error correction model. O. Ucan, E. Aricioglu, and F. [23] backed this position on the basis of studies conducted in 15 European countries between 1990-2011. Also worthy of mention in this case are the studies F. Kula [24] on 19 OECD countries from 1980-2008. C. Bozkurt & M. A. Destek [25], on the basis of case studies in OECD countries, hold that this hypothesis is true only for very developed countries. S.
Kayhan, et al. [26] drew similar conclusions, but only with reference to Romania.
J. E. Payne has devoted much attention to this problem. On the basis of data from 1949-2006, he corroborated the so-called neutrality hypothesis, which posits that there is no causal relationship between energy consumption and economic growth [27]. In other words, any reduction in energy consumption will not affect economic development. A. Aslan and O. Ocal [28] reinforce the thesis based on
analyses of new EU member countries. The same can be said about other researchers, such as: C. C. Lee [8], who studied countries like Great Britain, Germany, and Sweden; as well as U. Soytas & R. Sari [29], and F. Haliciouglu [30], who studied Turkey, and G. Kharlamova, S. Nate, O. Chernyak [31] who analyzed Ukrainian market.
J. E. Payne and N. Apergis [32], in another work that analyzed 20 OECD countries, confirmed the feedback hypothesis, which posits a two-way causal relationship between energy consumption and economic development, underlining that a conservative energy policy may limit the economy. Apergis and Payne [33]
further confirmed this hypothesis on the basis of research conducted in 13 Eurasian countries between 1992-2007; as did U. Al.-Mulali, et al. [34], who analyzed 18 Latin American countries between 1980-2010 using the co- integration method. The works of R. A. Salim, et al. [35], based on analyses of OECD countries from 1980-2011, are also consistent with this hypothesis. Lastly, the validity of the feedback hypothesis is bolstered by the research of M. Shahbaz, et al. [36] and T. Chang, et al. [37], which focuses on G7 countries.
3 Data
This article will attempt to answer the question of whether the EU directive from 2009 has affected the energy policies of individual countries and whether those countries themselves would have taken the same actions had the directive not been adopted. This will be done on the basis of an analysis of 28 European Union countries4 (excluding countries belonging to the European Free Trade Association) from 2004-2014. The research will cover the five-year periods before and after the implementation of EU Directive 2009/29/EC, which obliged member states to reduce production of greenhouse gases. This amount of time appears sufficient to observe the first changes in the energy policies of individual member countries. Analyzed will be the amount of energy obtained from renewable sources and greenhouse gas emissions. In order to ensure the comparability of results, the study has also taken into account variables specific for each country, such as area, number of inhabitants, total energy production, and GDP per capita.
The following is a list of individual variables together with their units of measurement:
4 The primary sources of data were the websites of Eurostat http://ec.europa.eu/eurostat/data/database, and the International Monetary Fund (for data on Gross Domestic Product) [date of access: 28.11.2016]
RE [toe] – production of renewable energy in thousands of toe5
CO2 [t] – greenhouse gas emissions (CO2 equivalent) generated by production of energy
EP [toe] – production of energy in thousands of toe SA [km2] - surface area (total area)
P [-] – population in thousands
GDP [current international dollar] - gross domestic product (at purchasing power parity) per capita
Furthermore, to facilitate analysis of three different years (2004, 2009, and 2014), an indication thereof has been added after each variable symbol, e.g. RE2004, RE2009, RE2014. The exception is surface area (SA), which is consant. These variables were used to create the indicators for characterizing countries, whereby the first two, i.e. production of renewable energy and greenhouse gas emissions, are related to the remaining four. Also, calculated was the ratio of greenhouse gas emissions to renewable energy production. All indicators together with their variable symbols for specific years are given in Table 1.
Table 1
Indicators and their averages for 2004, 2009 and 2014 Indicators 2004 Indicators 2009 Indicators 2014 RE2004/EP2004 RE2009/EP2009 RE2014/EP2014 RE2004/SA RE2009/SA RE2014/SA RE2004/P2004 RE2009/P2009 RE2014/P2014 RE2004/GDP2004 RE2009/GDP2009 RE2014/GDP2014 CO2004/EP2004 CO2009/EP2009 CO2014/EP2014 CO2004/SA CO2009/SA CO2014/SA CO2004/P2004 CO2009/P2009 CO2014/P2014 CO2004/GDP2004 CO2009/GDP2009 CO2014/GDP2014 CO2004/RE2004 CO2009/RE2009 CO2014/RE2014
Source: The authors’ own research
5 http://ec.europa.eu/eurostat/statistics-
explained/index.php/Glossary:Tonnes_of_oil_equivalent_(toe) [date of access: 28.11.2016]
4 Methodology
With numerous data sets characterized by many features, one of the best methods of comparison is clustering [38]. In order to determine groups of countries that were similar in terms of investment in renewable energy sources, we used a taxonomic analysis [39] with Ward's hierarchical clustering method [40]. This method is a type of agglomerative clustering method and is considered one of the most efficient in creating homogeneous clusters. The basis of analysis for agglomeration methods is an observation matrix composed of selected variables, from which a distance matrix is created. See below:
0 0
0
2 1
2 21
1 12
n n
n n
d d
d d
d d
(1) dij – the distance between i and j observations.
Culsters are created on the basis of the distance matrix in relation to the criterion of connection for the clusters in a group [41-42, 45-46]. Analysis of variance is used in Ward's method for estimating the distance between clusters. This technique aimed at minimizing the sum of squared deviations within clusters. The squared Euclidean distance is used as the criterion of connection for the clusters in a group:
p
i
jl il
ij x x
d
1
)2
(
(2) In Ward's method, it is desirable that the variables used have a coefficient of variation not less than 10%, and that they are not significantly correlated with each other. As can be seen from Table 2, the coefficient of variation greatly exceeds the limit in all cases. Analysis of the correlation (Table 3) showed a significant relationship between indicators CO2/RE, CO2/EP, and CO2/SA (coefficient of correlation greater than 0.75); therefore, the following indicators were omitted from further analysis: CO2/RE and CO2/SA.
Table 2
Coefficient of variation for the indicators for 2004, 2009, and 2014
Indicator 2004 Vz Indicator 2009 Vz Indicator 2014 Vz RE2004/EP2004 99.9 RE2009/EP2009 82.1 RE2014/EP2014 70.6 RE2004/SA 69.7 RE2009/SA 67.5 RE2014/SA 64.2 RE2004/P2004 124.8 RE2009/P2009 110.3 RE2014/P2014 100.4 RE2004/GDP2004 121.4 RE2009/GDP2009 99.9 RE2014/GDP2014 87.3 CO2004/EP2004 495.5 CO2009/EP2009 474.6 CO2014/EP2014 245.6
CO2004/SA 125.4 CO2009/SA 133.3 CO2014/SA 137.8 CO2004/P2004 45.8 CO2009/P2009 42.0 CO2014/P2014 43.8 CO2004/GDP2004 78.3 CO2009/GDP2009 60.7 CO2014/GDP2014 66.7 CO2004/RE2004 420.5 CO2009/RE2009 398.7 CO2014/RE2014 132.4
Source: The authors’ own research
Table 3
Correlation between indicators CO2/RE and CO2/EP Indicator 1 - Indicator 2 Correlation [%]
CO2004/RE2004 - CO2004/EP2004 99.9 CO2009/RE2009 - CO2009/EP2009 99.9 CO2014/RE2014 - CO2014/EP2014 95.6 CO2004/RE2004 - CO2004/SA 77.6 CO2009/RE2009 - CO2009/SA 81.9 CO2014/RE2014 - CO2014/SA 88.8 CO2004/EP2004 - CO2004/SA 76.0 CO2009/EP2009 - CO2009/SA 80.7 CO2014/EP2014 - CO2014/SA 83.1
Source: The authors’ own research
The seven most diverse indicators were chosen for analysis: RE/EP, RE/SA, RE/P, RE/GDP, CO2/EP, CO2/P, CO2/GDP. This was done separately for each year, e.g. RE2004/EP2004. The indicators had to be standardized in order to objectively assess similarities, regardless of the scales on which they were expressed. As a result of this standardization, we get a matrix of similarities that yields a statistical population. By using Ward's method on the matrix, we can determine groups with minimal differentiation of features, which in further steps will make up increasingly large clusters.
5 Empirical Results
5.1 Cluster Analysis for 2004
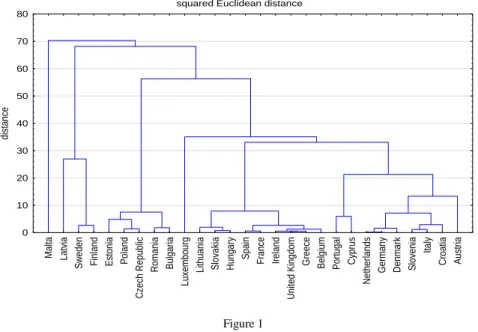
Clustering of countries was done for each year separately using the Statistica 12 program. A number of methods can be used to determine the optimal number of clusters, for example [43-44]. For 2004 (Figure 1), the dendrogram was cut off at 30, thanks to which the countries could be grouped into six clusters, similar to each other with respect to the chosen features, yet at the same time maximally different from the others.
squared Euclidean distance
Malta Latvia Sweden Finland Estonia Poland Czech Republic Romania Bulgaria Luxembourg Lithuania Slovakia Hungary Spain France Ireland United Kingdom Greece Belgium Portugal Cyprus Netherlands Germany Denmark Slovenia Italy Croatia Austria
0 10 20 30 40 50 60 70 80
distance
Figure 1 Dendrogram for 2004
Source: The authors’ own research
The results of clustering with respect to renewable energy production and greenhouse gas emissions using Ward's method are presented in Table 4, and their group averages in Table 5.
Table 4 Clusters for 2004
No\Group A B C D E F
1 Malta Luxembourg Finland Bulgaria Belgium Austria
2 Latvia Czech
Republic
France Croatia
3 Sweden Estonia Greece Cyprus
4 Poland Hungary Denmark
5 Romania Ireland Germany
6 Lithuania Italy
7 Slovakia Netherlands
8 Spain Portugal
9 United
Kingdom
Slovenia Source: The authors’ own research
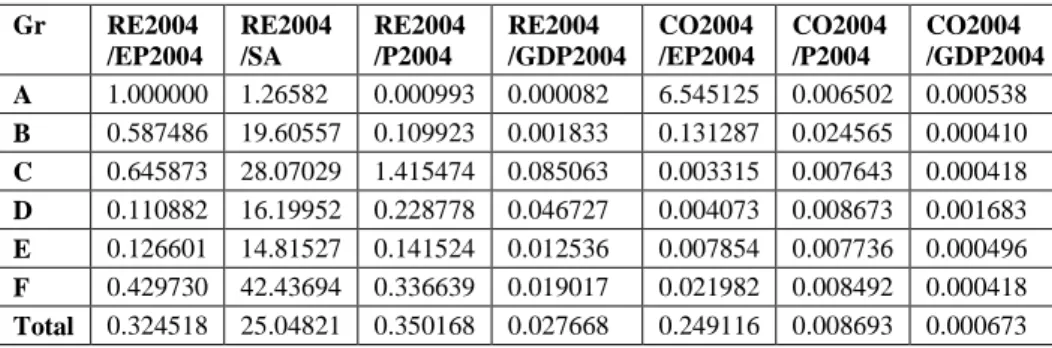
Table 5 Group averages for 2004 Gr RE2004
/EP2004
RE2004 /SA
RE2004 /P2004
RE2004 /GDP2004
CO2004 /EP2004
CO2004 /P2004
CO2004 /GDP2004 A 1.000000 1.26582 0.000993 0.000082 6.545125 0.006502 0.000538 B 0.587486 19.60557 0.109923 0.001833 0.131287 0.024565 0.000410 C 0.645873 28.07029 1.415474 0.085063 0.003315 0.007643 0.000418 D 0.110882 16.19952 0.228778 0.046727 0.004073 0.008673 0.001683 E 0.126601 14.81527 0.141524 0.012536 0.007854 0.007736 0.000496 F 0.429730 42.43694 0.336639 0.019017 0.021982 0.008492 0.000418 Total 0.324518 25.04821 0.350168 0.027668 0.249116 0.008693 0.000673 Source: The authors’ own research
For comparison of the groups, the values of indicators for individual countries relative to the overall average have been determined on the basis of Table 5, and are presented in Figure 2.
Figure 2
Comparison of group averages for 2004 - groups B - F
Source: The authors’ own research
We can see that group A, which consists only of Malta, stands out in comparison with the other groups. This is due to the high value of the indicator for emission of greenhouse gases in relation to the total energy produced (CO2004/EP2004).
Additionally, this group has the highest rate of energy production from renewable sources in relation to the total energy produced.
There is also only one country in group B (Luxembourg), which, as a small country, produces a large amount of greenhouse gases in relation to its number of inhabitants (CO2004/P2004). Similarly to group A, group B also has a large percentage of energy produced from renewable sources (RE2004/EP2004).
The most ecological group is group C, which consists of Finland, Latvia, and Sweden. In these countries, a large portion of the energy used is produced from renewable sources (RE2004/EP2004). This group is also positively distinguished by its high indicators for production of energy from renewable sources in relation to its population and GDP. This means that the economies of these countries are developing to the greatest extent on the basis of renewable energy.
In group D are mainly Central and Eastern European countries that joined the European Union in 2004 or later. In 2004, the economies of these countries were based mainly on energy produced from coal, and thus were polluting the environment with greenhouse gases to the greatest extent (CO2004/GDP2004).
They can be considered the biggest polluters of the European Union.
Figure 3
Visual presentation of the groups in 2004
Source: The authors’ own research
Group E is a group of countries that do not stand out in terms of production of energy from renewable sources, or in terms of excessive emission of greenhouse gases. The group consists of countries from different regions of the European Union, which varies from one another with respect to sources of energy production, as well as when they joined the European Union.
In the last group, group F, are countries which, similarly to those in group C, are considered environmentally friendly. However, they are different from those in group C in that they produce a lot of renewable energy relative to their area, but their GDP is not strongly associated with this kind of energy. The areas of the countries in this group are insignificant, as it includes small countries like Cyprus and Slovenia, as well as large countries like Germany.
As a supplement to the data above, these groups have been plotted on a map of Europe according to a color scheme (see Figure 3). Red indicates the least ecological countries, while green indicates the most ecological countries.
5.2 Cluster Analysis for 2009
When making a cluster for 2009 (see Figure 4), the dendrogram was also cut off at 30, and six groups also appeared.
squared Euclidean distance
Latvia Sweden Finland Malta Ireland United Kingdom Greece Slovakia Hungary Spain France Slovenia Czech Republic Cyprus Romania Lithuania Croatia Estonia Poland Bulgaria Luxembourg Denmark Netherlands Germany Belgium Portugal Italy Austria
0 10 20 30 40 50 60 70 80
distance
Figure 4 Dendrogram for 2009
Source: The authors’ own research
The composition of groups is shown in Table 6. We can see that there are no changes to groups A, B, and C; though in groups D, E, and F, six countries changed places (see Figure 7). Belgium has moved to more ecological group F.
Croatia, Cyprus and Slovenia moved from group F to "inferior" group E, where they are together with the Czech Republic and Romania. For these last two countries, however, belonging to group E is positive, as they have moved out of group D - the least ecological.
Table 6 Clusters for 2009
No\Group A B C D E F
1 Malta Luxembourg Finland Bulgaria Croatia Austria
2 Latvia Estonia Cyprus Belgium
3 Sweden Poland Czech
Republic
Denmark
4 France Germany
5 Greece Italy
6 Hungary Netherlands
7 Ireland Portugal
8 Lithuania
9 Romania
10 Slovakia
11 Slovenia
12 Spain
13 United
Kingdom
Source: The authors’ own research
Table 7
Transitions of countries between groups from 2004 to 2009
Country 2004→2009
Belgium E→F
Croatia F→E
Cyprus F→E
Czech Republic D→E
Romania D→E
Slovenia F→E
Source: The authors’ own research
When comparing group averages with the whole (Figure ), we get the impression that, aside from the transitions of a few countries between groups, there are no major changes to what we observed in 2004 (Figure 2). The profiles of the groups are also the same as in 2004.
Figure 5
Comparison of group averages for 2009 - groups B -F
Source: The authors’ own research
When comparing average indicator values in individual groups in 2004 and 2009, we can see that there is a change (Figure 5), but it is uniform enough to only cause small transitions between groups.
Figure 6
The change in average indicator values in individual groups from 2004 to 2009
Source: The authors’ own research
Figure 6 reveals that, in most of the groups, the production of energy from renewable sources rose and the production of greenhouse gases fell. These changes indicate that the production of energy from renewable sources was developing in Europe before the EU directive on reduction of greenhouse gas emissions was introduced.
Figure 7 shows a visual representation of the changes within the groups in 2009 according to a color scheme. Red indicates the least ecological countries, while green indicates the most ecological countries.
Figure 7
Visual presentation of the groups in 2009
Source: The authors’ own research
5.3 Cluster Analysis for 2014
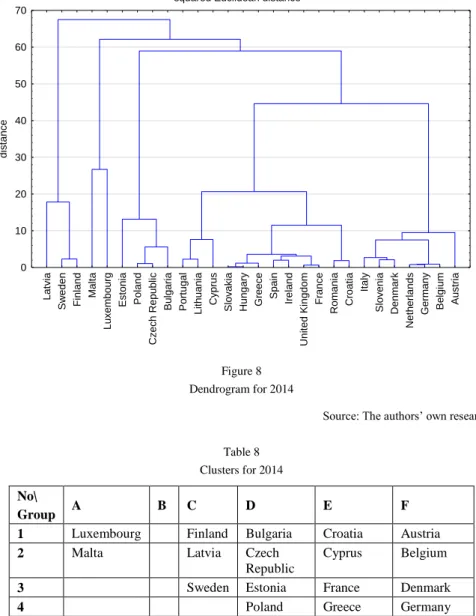
The last year for which the groups were clustered was 2014. Once again with the dendrogram (Figure 8) cut off at 30, this time only five groups appeared (Table 8).
In order to preserve the nomenclature of groups from 2004 and 2009, group B has been omitted.
squared Euclidean distance
Latvia Sweden Finland Malta Luxembourg Estonia Poland Czech Republic Bulgaria Portugal Lithuania Cyprus Slovakia Hungary Greece Spain Ireland United Kingdom France Romania Croatia Italy Slovenia Denmark Netherlands Germany Belgium Austria
0 10 20 30 40 50 60 70
distance
Figure 8 Dendrogram for 2014
Source: The authors’ own research
Table 8 Clusters for 2014 No\
Group A B C D E F
1 Luxembourg Finland Bulgaria Croatia Austria
2 Malta Latvia Czech
Republic
Cyprus Belgium
3 Sweden Estonia France Denmark
4 Poland Greece Germany
5 Hungary Italy
6 Ireland Netherlands
7 Lithuania Slovenia
8 Portugal
9 Romania
10 Slovakia
11 Spain
12 United
Kingdom
Source: The authors’ own research
There were only four transitions between groups during the five-year period from 2009 to 2014 (Table 9). The Czech Republic returned to group D (the least ecological), where it was in 2004. Slovenia also returned to its 2004 group, but in this case the change is positive, as group F is characterized by high production of energy from renewable sources in relation to its area. As aforementioned, group B has been omitted, and the country that previously belonged to it, Luxemburg, has moved to group A, characterized by high production of greenhouse gases in relation to total energy produced.
Table 9
Transitions of countries between groups from 2009 to 2014 Country 2009→2014
Czech Republic E→D Luxembourg B→A Portugal F→E Slovenia E→F
Source: The authors’ own research
When comparing the group averages for 2014 (Figure 9), we can see that there are no essential changes in the profiles of individual groups from 2004 and 2009.
Only in group A is there a visible decline in indicator CO2004/EP2004. This is a consequence of Luxmbourg's transfer to the group, but it still does not affect the group's profile.
Figure 9
Comparison of group averages for 2014 - groups B -F
Source: The authors’ own research
When analyzing the changes in indicators of groups from 2009 to 2014, we can see that only in group A is there a visible decline in indicator CO2004/EP2004 (Figure ). This is a consequence of Luxmbourg's transfer to the group, but it still does not affect the group's profile.
Figure 10
The change in average indicator values in group A from 2004 to 2009
Source: The authors’ own research
When analyzing the changes in the indicators of groups C - F from 2009 to 2014 (Figure 11), we can see that the production of energy from renewable sources rose and the emission of greenhouse gases fell in all groups.
Figure 11
The change in average indicator values in groups C - F from 2004 to 2009
Source: The authors’ own research Figure 12 shows a visual representation of the changes within the groups in 2014 according to a color scheme (see Figure 3). Red indicates the least ecological countries, while green indicates the most ecological countries.
Figure 12
Visual presentation of the groups in 2014
Source: The authors’ own research
Conclusions
Using Ward's analysis, we created 5-6 groups of countries similar to each other with respect to the production of energy from renewable sources and emission of greenhouse gases. Two groups (C and F) are invariably groups of ecological countries. The countries of group D are exceptionally unecological. Groups A and B, despite being made up of countries that produce energy primarily (or only) from renewable sources, are simultaneously characterized by a high emission of greenhouse gases, which is difficult to comprehend. This anomaly found in the Eurostat data was not further explored by the authors of this article. Finally, group E is neutral.
The analyses showed that in each group, the production of energy from renewable sources rose and the production of greenhouse gases fell over the 10-year period.
This was achievable in spite of the economic crisis. The EU directive from 2009 did not clearly impact investment in renewable energy in comparison with the 5 years preceding it. This should be interpreted positively, as it shows investor awareness in this area in different countries, regardless of top-down regulation.
Transitions between groups were only made by a few countries, the majority of which were from neutral group E. The lack of major transitions between groups is a negative phenomenon, especially in case of group D. This is because, despite investment, these countries (aside from Romania) were unable to move closer to neutral group E. Analysis of energy sources in individual countries in 2014, and the time needed for investments in this sector of the economy, shows that within the next decade, countries from group D will most likely not be able to make up for lost progress and "advance" to the level of groups C and F.
References
[1] Jasiński, P. (1996) Polityka energetyczna Wspólno Europejskich - tło historyczne. W P. Jasiński i T. Skoczny, Studia nad integracją europejską.
Elektroenergetyka. Waszawa
[2] Bowden, N. & Payne, J. (2009) The casual relationship between U.S.
energy consumption and real output: a disaggregated analysis. J. Policy Model, 2(31), pp. 180-188
[3] Ozturk, I. (2010) A literature survey on energy-growth nexus. Energy Policy, 38(1), pp. 340-349
[4] Sari, R., Ewing, B. & Soytas, U. (2008) The relationship between disaggregate energy consumption and industrial production in the United States: an ADRL approach. Energy Econ.(30), pp. 2302-2313
[5] Sadorsky, P. (2009) Renewable energy consumption and income in emerging economies. Energy Policy, 37(10), pp. 4021-4028
[6] Kraft, J. & Kraft, A. (1978) On the relationship between energy and GNP.
J. Energy Dev, 3, pp. 401-403
[7] Lise, W. & Van Montfort, K. (2007) Energy consumption and GDP in Turkey: is there a cointegration relationship? Energy Econ., 29, pp. 1166- 1178
[8] Lee, C. (2006) The causality relationship between energy consumption and GDP in G-11 countries revisited. Energy Policy, 34, pp. 1086-1093
[9] Akinlo, A. (2008) Energy consumption and economic growth: evidence from 11 Sub-Sahara African countries. Energy Econ., 30(5), pp. 2391-2400 [10] Shahbaz, M., Tang, C. & Shabbir, M. (2011) Electricity consumption and
economic growth nexus in Portugal using cointegration and causality approaches. Energy Policy, 39, pp. 3529-3536
[11] Zhang, X. & Chen, X. (2009) Energy consumption, carbon emissions, and economic growth in China. Ecol. Econ., 68(10), pp. 2706-2712
[12] Caraiani, C., Lungu, C. & Dascălu, C. (2015) Energy consumption and GDP causality: a three-step analysis for emerging European countries.
Renew. Sustain. Energy Rev., 44, pp. 198-210
[13] Makarenko, D., Streimikiene, D. (2014) Quality of life and environmentally responsible behavior in energy sector, Journal of International Studies, Vol.
7, No 3, 2014, pp. 179-192. DOI: 10.14254/2071-8330.2014/7-3/17 [14] Streimikiene, D., Strielkowski, W., Bilan, Y., & Mikalauskas, I. (2016)
Energy dependency and sustainable regional development in the Baltic States - a review. Geographica Pannonica, 20(2), pp. 79-87
[15] Fang, Y. (2011) Economic welfare impacts from renewable energy consumption: the China experience. Renew. Sustain. Energy Rev., 15, pp.
5120-5123
[16] Magnani, N. & Vanona, A. (2011) Regional Spillover Effects of Renewable Energy Generation in Italy. Working paper series(12). University of Verona, Department of Economics
[17] Inglesi-Lotz, R. (2015) The impact of renewable energy consumption to economic growth: a panel data application. Energy Econ.
doi:http://dx.doi.org/10.1016/j.eneco.2015.01.003
[18] Menegaki, A. (2011) Growth and renewable energy in Europe: a random effect model with evidence for neutrality hypothesis. Energy Econ., 33(2), pp. 257-263
[19] Tiwari, A. (2011) A structural VAR analysis of renewable energy consumption, real GDP and CO2 emission: evidence from Indi. Econ.
Bull., 31, pp. 1793-1806
[20] Apergis, N. & Payne, J. (2012a) The electricity consumption-growth nexus:
renewable versus non-renewable electricity in Central America. Energy Sources(Part B 7) pp. 423-431
[21] Ocal, O. & Aslan, A. (2013) Renewable energy concumption-economic growth nexus in Turkey. Renew. Sustain. Energy. Rev., 28, pp. 494-499 [22] Azlina, A., Law, S. & Mustapha, N. (2014) Dynamic linkages among
transport energy consumption, income and CO2 emission in Malaysia.
Energy Policy, 73, pp. 598-606
[23] Ucan, O., Aricioglu, E. i Yucel, F. (2014) Energy consumption and economic growth nexus: evidence from deveoped contries in Europe. Int. J.
Energy Econ. Policy, 4(3), str. 411
[24] Kula, F. (2014) The long-run relationship between renewable electricity consumption and GDP: evidence from panel data. Energy Sources, Part B Econ. Plan. Policy, 9(2), pp. 156-160
[25] Bozkurt, C. & Destek, M. (2015) Renewable energy and sustainable development nexus in selected OECD countries. Int. J. Energy Econ.
Policy, 5(2), pp. 507-514
[26] Kayhan, S., Adiguzel, U., Bayat, T. & Lebe, F. (2010) Causality relationship between real GDP and electricity consumption in Romania (2001-2010). Rom. J. Econ. Forecast., 4, pp. 169-183
[27] Payne, J. (2009) On the dynamics of energy consumption and output in the US. Appl. Energy, 86, pp. 575-577
[28] Aslan, A. & Ocal, O. (2016) The role of renewable energy consumption in economic growth: evidence from asymmetric causality. Renew. Sustain.
Energy Rev., 60, pp. 953-959
[29] Soytas, U. & Sari, R. (2009) Energy consumption, economic growth, and carbon emissions: challenges faced by an EU candidate member. Ecol.
Econ., 68(6), pp. 1667-1675
[30] Halicioglu, F. (2009) An econometric study of CO2 emissions, energy consumption, income and foreign trade in Turkey. Energy Policy, 37, pp.
1156-1164
[31] Kharlamova G., Nate S., Chernyak O. (2016) Renewable energy and security for Ukraine: challenge or smart way?, Journal of International Studies, Vol. 9, No. 1, pp. 88-115, DOI: 10.14254/2071-8330.2016/9-1/7 [32] Apergis, N. & Payne, J. (2012b) Renewable and non-renewable energy
consumption growth nexus: evidence from panel error correction model.
Energy Econ., doi:http://dx.doi.org.10.1016/j.eneco.2011.04.007
[33] Apergis, N. & Payne, J. (2010) Renewable energy consumption and economic growth in Eurasia. Energy Econ., 32, pp. 1392-1397
[34] Al-Mulali, U., Fereidouni, H. i Lee, J. (2014) Electricity consumption from renewable and non-renewable sources and economic growth: evidence from Latin American countries. Renew. Sustai. Energy Rev., 30, pp. 290-298
[35] Salim, R., Hassan, K. i Shafiei, S. (2014) Renewable and non-renewable energy consumption and economic activities: further evidence from OECD countries. Energy Econ., 44, pp. 350-360
[36] Shahbaz, M., Loganathan, N., Zeshan, M. & Zaman, K. (2015) Does renewable energy consumption add in economic growth? an application of auto-regressive distributed lag model in Pakistan. Renew. Sustain. Energy Rev., 44, pp. 576-585
[37] Chang, T., Gupta, R., Inglesi-Lotz, R., Simo-Kengne, B., Smithers, D. &
Trembling, A. (2015) Trembling, Renewable energy and growth: evidence from heterogeneous panel of G7 countries using Granger causality. Renew.
Sustain. Energy Rev., 52, pp. 1405-1412
[38] Everitt, B. S., Landau, S., Leese, M. & Stahl, D. (2011) Cluster analysis (wyd. 5th). Chichester: John Wiley & Sons
[39] Bailey, K. D. (1994) Typologies and Taxonomies: An Introduction to Classification Techniques. Thousand Oaks, CA: Sage
[40] Ward, J. H. (1963) Hierarchical Grouping to Optimize an Objective Function. Journal of the American Statistical Association, 58(301), pp. 236- 244
[41] Giudici, P. (2003) Applied Data Mining - Statistical Methods for Business and Industry. Chichester: John Wiley & Sons, Inc.
[42] Hastie, T., Tibshirani, R. & Friedman, J. (2009) The Elements of Statistical Learning: Data Mining, Inference, and Prediction. (wyd. Second Edition).
Online: Springer
[43] Fraley, C. & Raftery, A. E. (1988) How Many Clusters? Which Clustering Method? Answers Via Model-Based Cluster Analysis. The Computer Journal, 41(8), pp. 578-588
[44] Hardy, A. (1996) On the number of clusters. Computational Statistics &
Data Analysis, 23(1), pp. 83-96
[45] Tvaronaviciene, M., Razminiene, K., & Piccinetti, L. (2015) Aproaches towards cluster analysis. Economics and Sociology, 8(1), 19
[46] Kharlamova, G., & Vertelieva, O. (2013) The international competitiveness of countries: economic-mathematical approach. Economics and Sociology, 6(2), 39-52