Tibor Pintér
The Integration of Hungary into the European Union –
Economic Aspects
Summary
Hungary became a member of the European Union on 1 May 2004, together with nine other, predominantly Central and Eastern European countries. The establish- ment and tightening up of institutional relations with the European Union started in the period before this date. In the course of the accession negotiations, Hungary had to fulfil a large number of criteria included in accession chapters; and the political deals and legislative harmonization laid the basis for Hungary to be able to succeed as an EU Member State. There is a wide range of approaches to integration, of course:
in addition to the political and social dimensions, economic integration is also a legiti- mate, scientifically used and discussed concept. The statistical data examined in this study show that the Hungarian economy’s state of integration is controversial. On the basis of the foreign trade orientation, we can state that Hungary had been strongly integrated into the EU’s economy already before the accession. Other, partial indica- tors of integration also suggest that Hungary has moved towards a more intensive integration. Convergence to the level of economic development of the first, predomi- nantly Western European, EU Member States, and the performance compared to countries with similar capabilities can also be a fundamental indicator of integration performance – these are a kind of non-partial convergence data. The procedure of catching-up with the development of the richer Western European countries has been slight and with several hiccups, while in comparison to the level of development of the countries in the region, Hungary has fallen back over the past nearly one and a half
Dr Tibor Pintér, Lecturer, Budapest Business School (Pinter.Tibor@uni-bge.hu).
decades. I would like to point out that the situation of our country’s relative prosper- ity fell following our accession to the EU, and improvement started only after 2010.
Journal of Economic Literature (JEL) codes: F15, H60, P16
Keywords: integration, relative positions, foreign trade expansion, globalization
The most important steps in Hungary’s integration into the EU
The primary meaning of the term “integration” includes unification, conformity, and the merger of parts into a whole. Additionally, it involves assimilation and attachment, which in the case of the given organisation, namely, the European Union and its predecessors, may mean the inclusion of new Member States as integral parts in the community of Member States.
Integration theories in the classical sense sought to identify the rules behind the political and scientific forces wishing to re-unify Europe (Bóka, 2001). In these theo- ries, a key role was assigned to the trends based on neoclassical economics, emphasiz- ing the importance of effective distribution and dispersion of economic resources and assuming that improvement in the combined economic performance of the Member States, applicable to each country included, can also bring about convergence of so- cial structures and the mutual recognition of cultural values (Bache et al., 2011).
These ideas are closely related to the schools that gained greater publicity and pragmatic expression opportunities in the early stage of integration. They say that there was a need for a kind of a political unity in the post-World War II period of the continent’s history. As a first step, they tried to ease the opposition between Germany and France, the great powers of the continent, through joint control over the iron and steel industry, an important sector in terms of defence (Sey, 2008). Subsequently, other theories emphasizing the enforcement of economic and national interests were also adopted to explain reality, and one of their predominant groups can perhaps be termed as “intergovernmental approaches” (Pogátsa, 2009).
Although in this study, the emphasis is on the economic aspects of the European in- tegration, the development of the European Union can also be considered as a proce- dure driven by political decisions and political ideologies. Therefore, when discussing certain issues and formulating summaries, in addition to economic ideas in the narrow sense, political and social scientific categories have also been included in the study.
Hungary’s path to membership in the European Union was characterized by the fact that the most important goals to be achieved and tasks to be accomplished pre- dominantly included the establishment of political sovereignty, the economic policy interventions and the institutional system of a market economy. Hungary, and Poland, entered into institutionalized relations with the EEC, the predecessor institution of the EU, already during the late 1980s (Losoncz, 2011).
The four countries in the group, currently called the Visegrád Group (V4), joined the EU at the same time, on 1 May 2004, even though they started the accession pro- cedure and negotiations on different dates and with different prospects. Following the transformation of the political system, Hungary and Poland were the closest to accession. After Czechoslovakia was split up, the Czech Republic and Slovakia also submitted their formal applications for accession. During the ‘Eastern enlargement’, the candidate countries were initially divided into two groups, however, a decision was made in 2004 to include eight former socialist countries (Poland, Czech Republic, Slovakia, Hungary, Slovenia, Latvia, Lithuania and Estonia), and two island countries, Cyprus and Malta, in the European Union. Bulgaria and Romania, treated as candi- date countries for a time in the procedure, could only join the EU in 2007.
Already at that time, the accession procedure had a well-established legislative and policy background. In this framework, the EU established the system of relations between the Communities and Central and Eastern European countries, including Hungary, by providing trade policy preferences, concluding and implementing as- sociation agreements, and granting financial assistance through pre-accession funds (Balázs, 2003).
The EU gave up using safeguarding measures in trade against the former socialist Comecon countries, and offered asymmetric preferences to them. This meant that the Community had broken down the customs barriers to candidate countries (Lo- soncz, 2011).
The “second-generation” association agreements, also called new-type association agreements, provided the legal basis for the Eastern enlargement, and contained only a very few country-specific features in various documents of an identical structure.
In those days pre-accession funds had not yet been integrated into a single pro- grammes, the CARDS and IPA systems were implemented only at a later stage for the Western Balkan, rather a number of funding channels were provided and ten main- tained during actual EU membership.
It is important to point out that the Copenhagen criteria were formulated in this period, and in addition to setting economic, social and political prerequisites for the countries aspiring to join the EU, they also marked directions for the entire EU’s de- velopment. They have remained validly applicable to any country wishing to accede to the EU ever since (Pintér, 2016).
The accession negotiations started in 1998 between Hungary, several Central and Eastern European countries (not all that acceded in 2004) and the EU. The parties had to negotiate 31 accession chapters, and the discussions were bilateral. It is impor- tant to point out that the key issue for Hungary was the situation of agriculture, and I wish to note that the good bilateral relations with Germany and nation-state interests clashed at some points during the negotiations (Hettyey, 2017).
The negotiated chapters were very similar to the 35 chapters used today, and in the procedure of accession the negotiations heavily tasked the Hungarian government to harmonize Hungarian laws. It can be said that Hungary became an integral part of the EU already in 2004, or at the latest by the turn of the millennium, at least in terms of
the economic relations and the economic and financial legal system, and so regarding these areas, 2004 was only an administrative time limit (Lentner, 2005).
The above introduction of the Eastern enlargement in a nutshell also reveals that a kind of credibility deficit characterized the relationship between Hungary and the EU during the accession negotiations. The Community did not appreciate the fact that our country had built much more intensive relations with the EU considerably earlier than most other Central and Eastern European states. Therefore, by the end of the accession negotiations, the nexus between Hungary and the EU had become stern, and this can also be evaluated as a forerunner of the major conflicts experienced as a Member State since 2010.
As however, economic integration is easier to measure and analyse than the above- mentioned problems, this is the subject matter of the next chapter. Since in most the trends in the integration of the Visegrád countries or, more broadly, the Central and Eastern European states, are taken for a reference or for a basis of comparison, the investigation period begins after 1993, when Czech Republic and Slovakia became independent, and the end of the reviewed period varies between 2012 and 2017, de- pending on data accessibility.
Integration of the Hungarian economy into the European Union’s single market
An evaluation of the Hungarian economy’s integration is both easy and difficult.
Easy, because according to a significant part of the literature on integration, the na- ture of foreign trade relations between a given country and the countries that com- prise the economic integration or for a presumed internal market of the integrated unit is pivotal (Palánkai et al., 2011). However, evaluation is also difficult because complex indicators have been elaborated for measuring economic integration, and they may show different trends in integration, as indicators may in many cases show a shift not because of professional, but normative and ideological reasons.
On the other hand, it must be pointed out that a high degree of integration is suggested by the strong economic convergence (strong real convergence) or by the internal economic developments pointing towards balance. Moreover, we can still embark on a new dimension of economic integration if mutual approximation and harmonization efforts are seen between the acceding party and the host in economic policy, including fiscal policy. However, Hungary’s relative position in relation to the countries that acceded the EU simultaneously or that are on a similar level of develop- ment is also highly relevant.
Foreign trade
In the diagrams illustrating trends in foreign trade, trade relations with the old and new EU Member States are distinguished, since before the accession, integration was realized through Hungary’s relations with the 15 old Member States. However, it is
also important to point out that the EU’s requirement to also intensify trade with newly acceding countries was added as a criterion only subsequently (Losoncz, 2011).
The Figure 1 shows the division of goods and services exported to Hungary between the EU’s old Member States, the countries of Central and Eastern Europe (wider cate- gory than V4) and the rest of the world after 1991. It is clear from the diagram that West- ern Europe has the largest share in Hungary’s imports during almost the entire period, but the newly acceding EU Member States have also increased their respective shares.
It is methodologically important to note that after 2004, HCSO (Hungarian Cen- tral Statistical Office) compiled the export and import data by considering all the countries that had acceded after the EU15 as a single new unit within the EU, while in the previous years the term “Central and Eastern European countries” was used in the relevant statements. I treat these two expressions as synonyms, without filtering out any overlaps. This may explain the fact that, in 2004, a more significant decline is seen in trade with the regional countries. In the case of imports, the non-EU part never reaches 40 percent, and after 2004 the share of imports from the old and new EU Member States is clearly increasing, suggesting that the integration of Hungary’s economy into the single market intensified along this trend.
Figure 1: Percentage distribution of Hungary’s imports from the old EU Member States, new EU Member States of Central and Eastern Europe and non-EU countries
0 10 20 30 40 50 60 70 80 90 100
1991 1992 1993 1994 1995 1996 1996 1997 1998 1999 2000 2001 2002 2003 2004 2005 2006 2007 2008 2009 2010 2011 2012 2013 2014 2015 2016
EU CEE countries Non-EU countries
Source: The author’s calculation on the basis of HCSO data
If we take into account that integration theories determine thresholds and thresh- old percentages as a degree of integration, then we can be absolutely sure that since the middle of the 1990s, Hungary has clearly become an integral part of the EU’s
economy, considering imports. In his study Palánkai (2010) shows that an integration crosses the minimum dependency threshold if domestic trade exceeds 10 percent of aggregated GDP. In our analysis much higher percentages occur in other contexts, yet we can say that we are deeply integrated into the EU market and cross the threshold of dependence. This is only confirmed by the fact that Hungary is a very open economy in a global comparison, which means that in some years the volume of imports and exports altogether is more than 100 percent of Hungarian GDP, which represents a high degree of globalization and integration in the world, with its advantages and disadvantages.
Figure 2: Percentage distribution of Hungary’s exports to the old EU Member States, new EU Member States of Central and Eastern Europe and non-EU countries
0 10 20 30 40 50 60 70 80 90 100
1991 1992 1993 1994 1995 1996 1996 1997 1998 1999 2000 2001 2002 2003 2004 2005 2006 2007 2008 2009 2010 2011 2012 2013 2014 2015 2016
EU CEE countries Non-EU countries
Source: The author’s calculation on the basis of HCSO data
Naturally, the above conclusions are confirmed by an analysis of integration on the basis of exports. It is clearly shown that from the mid-1990s the target markets of the goods and services exported from Hungary were located in EU Member States. It is noteworthy that, for the above methodological reason, a kind of a censure was made in 2004, as a significant decline is seen in the share of the countries of the region, while no clear trend can be established for non-EU countries, as a cyclical fluctuation characterizes Hungary’s export in this direction. The share of non-EU countries, in the range of 20 to 25 percentage points, highlights the fact that integration into the EU economy has been far too successful, as our economy cannot be characterized by a healthy diversification regarding foreign markets. Bearing in mind that right before and after the most recent major global economic crisis, the economies most seriously
hit among the world’s major regions were none other than Europe and the EU, we can state that there is a need for a greater diversification in Hungary’s foreign trade relations. As economic and governmental interrelationships are becoming increas- ingly intensive, the more or less synchronized EU growth cycles (in certain years only one or two countries can achieve more than 2-3 percentage points of GDP growth compared to the EU average, and the difference is not always positive) predict that our pattern of foreign trade requires more proactive economic policy routines. Re- cently, the Hungarian government has been willing to adopt a proactive attitude; the professional reasons are illustrated in the figures above.
Trends of integration with regard to the FDI flow
The extent of Hungary’s integration into the global flow of foreign direct investments can also be considered as an indicator of Hungary’s integration into the EU.
The Table 1 summarizes data currently available at UNCTAD about Hungary. The data included in the bottom line make it clear that most of the FDI to Hungary flows from the EU, predominantly from older Member States. As a technical addition, we may note that amounts in excess of 100 percent and with negative sign are also in- cluded in the table. This is due for example to a significant negative balance in 2009, i.e. the withdrawal of capital from Hungary because of the crisis, while the EU’s 100 percent share in some cases indicates that in 2008 inflows were “negative” from other regions of the world, while those from the EU remained positive. All these comments are also true for the following figures, as the other Visegrád countries experienced similar trends, although changes were less intensive and volatile.
Table 1: The EU’s share in FDI inflows to Hungary between 2001 and 2012
FDI inflow
(million dollars) 2001 2002 2003 2004 2005 2006 2007 2008 2009 2010 2011 2012 Total FDI inflow 3936 2994 2137 4266 7709 6818 3951 6325 1995 2202 5842 13 769 FDI inflow from
the EU 2883 1882 2377 3102 7755 6398 2831 7008 –3440 1464 5465 11 140 EU proportion
as a percentage 73 63 111 73 101 94 72 111 –172 66 94 81
Source: UNCTAD bilateral statistics, http://unctad.org/en/Pages/DIAE/FDI%20Statistics/FDI-Statis- tics-Bilateral.aspx (accessed 6 November 2017)
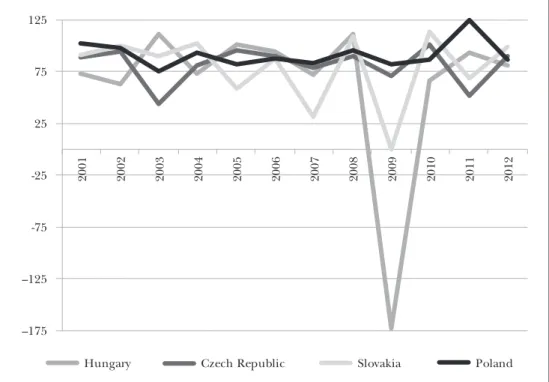
The FDI inflow rate of the Visegrád countries and the EU’s share may be deter- mined as follows. The Figure 3 clearly shows that for each country the EU is the largest FDI issuer and sender. It is remarkable though that the highest amount of capital was withdrawn by the EU from Hungary, in 2009, but it should also be noted that in percentage terms all these countries can be classified in roughly the same category, underlining that the Czech Republic is the most stable in this regard, without outliers.
Figure 3: FDI inflows from the EU to the Visegrád countries, as a percentage, between 2001 and 2012
–175 –125 -75 -25 25 75 125
2001 2002 2003 2004 2005 2006 2007 2008 2009 2010 2011 2012
Hungary Czech Republic Slovakia Poland
Source: The author’s calculation on the basis of UNCTAD’s bilateral statistics, http://unctad.org/en/
Pages/DIAE/FDI%20Statistics/FDI-Statistics-Bilateral.aspx (accessed 6 November 2017)
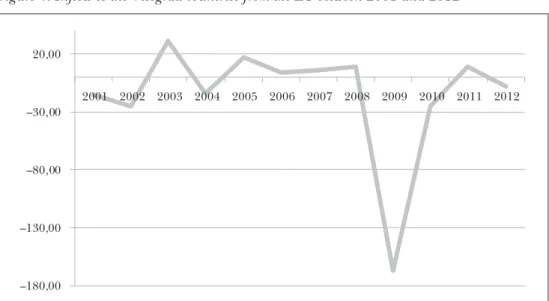
Hungary’s position relative to the other Visegrád countries is perhaps even better illustrated by the Figure 4, showing the deviation in Hungary compared to the EU’s average regional share in FDI inflow. It is clear that in the majority of the period, the EU as an FDI investor contributed more FDI to Hungary than the regional average.
This also caused the risk arising from Hungary’s greater exposure convert into a loss as a major EU related capital flight occurred in Hungary between 2008 and 2011.
Naturally, the latter cannot be detached from the economic crisis peaking at that time, and the unusual economic policy solutions that followed, and sectoral special taxes also triggered strong responses. In any case, we can conclude that Hungary is strongly linked to the European Union with regard to FDI inflows.
The identification of motives behind and the sectors affected by capital flows, and the assessment of the effects of corporate acquisitions may also be additional areas of research in integration (Kucséber, 2014). However, in the context of this study, it can be stated that in terms of capital inflows the integration of Hungary had been ac- complished already prior to the accession, and the EU’s capital contribution did not increase in the post-accession period. The latter is not a failure, because, as it was men- tioned regarding foreign trade, diversification would be a desirable goal for Hungary,
Figure 4: Inflow to the Visegrád countries from the EU between 2001 and 2012
–180,00 –130,00 –80,00 –30,00 20,00
2001 2002 2003 2004 2005 2006 2007 2008 2009 2010 2011 2012
Source: The author’s calculation on the basis of UNCTAD bilateral statistics, http://unctad.org/en/Pa- ges/DIAE/FDI%20Statistics/FDI-Statistics-Bilateral.aspx (accessed 6 November 2017)
and would not represent a solidarity or integration deficit in the relationship between Hungary and the EU.
Integration on the basis of the KOF Globalization Index
Complex indicators have also been developed over the decades to measure the de- gree of integration. As membership in the EU is a political decision, research insti- tutes also quantify the level of development and integration of political and social institutions. A large number of indicators can be used, such as the Open Government Index elaborated by the World Justice Project, the Worldwide Governance Indicator published by the World Bank, or the Bertelsmann Transformation Index mentioned in a Hungarian study (Ágh, 2012), the OECD’s SGI indicators and the Economist Democracy Index. The simpler SNA indicators are not the only tools to quantify eco- nomic development, as the different competitiveness indices and the added value in- dicators of international trade may give a more subtle picture of the economic status of a country. However, we can measure economic performance with the SNA indica- tors in the first place, and the KOF globalization index seems to be the most suitable tool for the description of a country’s integration.
The Swiss-based KOF (Konjunkturforschungsstelle) annually publishes the so-called KOF Globalization Index. The index shows the “degree of globalization” of a country on a scale of 0 to 100. The higher the value, the more globalized and integrated the country is. As the indicator is used to describe a country’s openness to world economy, smaller countries are typically at the top of the ranking.
The indicator is built on three major pillars. One of them is the economic pillar in globalization, representing 36 percent in the final index. Foreign trade data, FDI flow, capital flow indicators, the height of customs walls and capital and import restrictions are included in this pillar.
The second pillar takes social aspects into account. This is the most controversial building block of the indicator, with a weight of 38 percent. The value is calculated on the basis of the frequency of Internet use, the size of foreign population, the number of newspapers and books read. For example, the number of McDonald’s restaurants or IKEA stores in a country increases the value of the index. The list makes it clear why this pillar can be taken the least seriously.
The third pillar is called “political globalization,” with a weight of 26 percent in the index. Membership in international organisations, participation in UNSC mis- sions, the ratification of international conventions and the number of embassies in the country increase the value of the pillar.
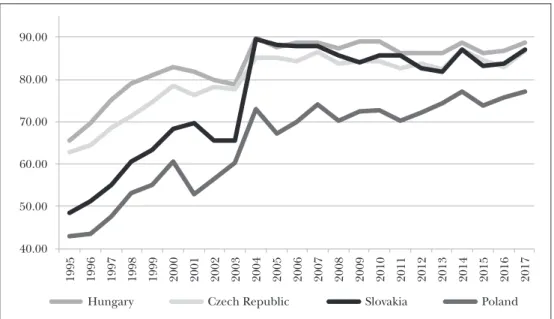
As shown in the Figure 5, Hungary is typically among the top 10 countries accord- ing to the aggregated KOF Globalization Index as well as the economic globalization index, preceding the other Visegrád countries. Since 1995, Hungary has always scored the highest, while Poland has always ranked last, due only to its size. In a realistic evaluation, in the period of the EU integration Hungary was at the forefront of eco- nomic opening and liberalisation, which may be a surprising in light of the main- stream scientific evaluation of Hungary. We had reached the level where we could be considered as an integral part of the EU and Western Europe already before 2004, notwithstanding the fact that Hungary undertook burdens beyond its means by open- ing its markets. It is sufficient to remember the study entitled “Tax Justice Network:
The Price of Offshore,” which makes it clear that Hungary was one of the most heavily exploited states at the times of the regime change, as since 1980s at least 2.5 times Hungary’s GDP left the country illegally.
The Figure 6 clearly shows Hungary’s integration performance and efforts. A com- parison of the scores of Hungary and the average economic, social and political indi- cators of the Visegrád countries reveals that Hungary has performed above the aver- age. Since 2004, Hungary has been approaching the Visegrád average in all respects, and remains below the average only in social factors. There has always been a per- ceptible lack of understanding and a confidence deficit between Hungary and the EU since the years right after the accession, and this resulted in a certain degree of turning against the integrator.
Real economic convergence and economic policy integration
Real economic convergence can also be a measure of a country’s economic integra- tion. In this case Hungary’s convergence to the welfare enjoyed in the EU or perhaps the euro area need to be analysed. However, it is also worth mentioning how Hungary has performed in relation to the average living standard of the countries in the region with approximately the same level of development in the reviewed period.
Figure 5: KOF’s economic globalization index for the Visegrád countries between 1995 and 2017
40.00 50.00 60.00 70.00 80.00 90.00
1995 1996 1997 1998 1999 2000 2001 2002 2003 2004 2005 2006 2007 2008 2009 2010 2011 2012 2013 2014 2015 2016 2017
Hungary Czech Republic Slovakia Poland
Source: The author’s calculation on the basis of the official site of the KOF, http://globalization.kof.ethz.ch/
(accessed 9 November 2017)
Figure 6: Hungary’s deviation from the average of the Visegrád countries, calculated with the three pillars of KOF, expressed in index points
–1.00 1.00 3.00 5.00 7.00 9.00 11.00 13.00
1995 1996 1997 1998 1999 2000 2001 2002 2003 2004 2005 2006 2007 2008 2009 2010 2011 2012 2013 2014 2015 2016 2017
Economic Social Political
Source: The author’s calculation on the basis of the official site of the KOF, http://globalization.kof.ethz.ch/
(accessed 9 November 2017)
The Figure 7 shows that in Hungary the living standard exceeds the world average, and in the post-2009 period, as a realistic goal, a certain level of convergence to the EU average and to the high-income countries has also been achieved. However, it is important to note, that Hungary’s position has been weakened compared to Central European and Baltic states with similar attributes, especially after 2003-2004, its acces- sion to the EU, when Hungary fell from a regional leader to the average in welfare.
Hungarian per capita GDP remains nearly 40 percent below the level of high-income countries, and about 30 percent below the EU average.
Figure 7: Percentage difference in welfare in Hungary and in country groups specified by the World Bank, based on GDP per capita on purchasing power parity
–80 –60 –40 –20 0 20 40 60 80
1995 1996 1997 1998 1999 2000 2001 2002 2003 2004 2005 2006 2007 2008 2009 2010 2011 2012 2013 2014 2015 2016
Difference from Central Europe and the Baltics Difference from the EU
Difference from high-income countries Difference from the world
Source: The author’s calculation on the basis of World Bank data
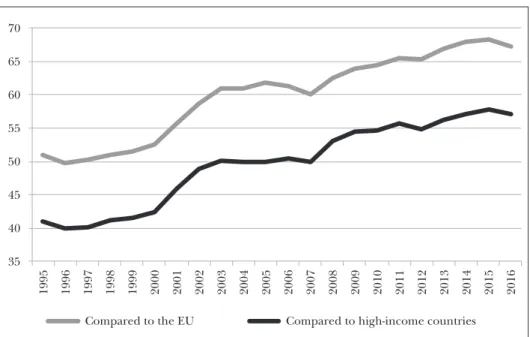
For the Hungarian society and the economic policy the EU and high-income countries represent a kind of a goal to be achieved. Convergence was the fastest in Hungary between 1998 and 2003, and a similar development was witnessed after 2011.
However, stagnation, or even decline compared to the EU, followed the accession, as illustrated in the Figure 8.
It is also conspicuous in the next figures that in 2003 and 2004 there was a turna- round in Hungary’s economic development that eroded its previous outstanding posi- tion. This caused frustration and disillusionment with the EU and with globalization in the Hungarian people and society.
Figure 8: Welfare in Hungary on the basis of GDP per capita, based on purchasing power parity, relative to the average of the EU and to high-income countries
35 40 45 50 55 60 65 70
1995 1996 1997 1998 1999 2000 2001 2002 2003 2004 2005 2006 2007 2008 2009 2010 2011 2012 2013 2014 2015 2016
Compared to the EU Compared to high-income countries
Source: The author’s calculation on the basis of World Bank data
As the World Bank does not have an average indicator for the Visegrád coun- tries, so I calculated the average GNI per capita indicator of these four countries, and the deviation is shown by Figure 9. Since GNI was not available for Slovakia prior to 2004, the analysis starts in that year. Compared to its direct competitors and partners, Hungary clear fell behind after 2005, and this trend lasted up to 2012, but Hungary remained unable to catch up with the Visegrád countries in terms of income adjusted with the primary income stream.
In the case of fiscal policy integration, the area characterised by the following trends: the degree of deviation from the Maastricht convergence criteria in the given indicators; a comparison of Hungary’s fiscal policy performance before and after the accession; a comparison with countries in the region and with countries of similar inherited development policies.
Compliance with the Maastricht criteria remains important despite the fact that none of the countries that have adopted the euro by bilateral agreements right in 2004 have managed to do so. However, it is important to note that Hungary and other countries in the eastern enlargement have legally agreed not to use derogation, opt- out and other means to keep them out of monetary and economic policy integration, i.e. these countries have a direct perspective of adopting the euro. Furthermore, the most recent major financial and economic crisis has shown that such reference values are considered as disciplinary, reliability and stabilization anchors even by the inter- national market and political players.
Figure 9: Difference in GNI per capita, based on purchasing power parity, as a percentage, relative to the average GNI per capita of the Visegrád Group
–12 –10 –8 –6 –4 –2 0 2 4 6
2004 2005 2006 2007 2008 2009 2010 2011 2012 2013 2014 2015 2016
Source: The author’s calculation on the basis of World Bank data
The Figure 10 shows the times when the growth rate of the Hungarian economy was above or below the average of the Visegrád countries. It is apparent that between 2005 and 2008, right after accession, Hungary fell behind the other countries in the region. However, it is also important to examine whether there was any relationship between budgetary discipline and the relative growth data on the side of fiscal policy in the given periods. The relationship between economic performance and the coun- try’s foreign market position is also a priority area to examine.
The Figure 11 points to a paradoxical situation. There was a very high deficit-to-GDP ratio in Hungary just in the period of low growth compared to the Visegrád countries.
An unquestioned evidence of the incumbent government’s economic responsibility is that the economy was unable to utilize the growth-enhancing effects of the remitted budget in a regional comparison, that is to say, Hungary experienced a relative eco- nomic downturn, while the country could not keep budgetary discipline, either. Prior to the recent crisis, rapid economic growth characterised the world as a whole, includ- ing the newly acceded European countries, and thus countries could raise capital easily.
After the crisis, Europe has never again recovered to a rapid growth, perhaps with the exception of Poland and Romania, in this chronological order. In absolute terms, after 2012, Hungary overperformed, even against lower growth rates, but in this period the achievement of overperformance demanded considerably more sacrifice, as the finan- cial and capital markets only slowly regained confidence in the Hungarian economic policy under pressure. That said, the 2010 change of government and economic policy clearly had a positive impact on Hungary’s development. Mainstream academic analy- ses do not even mention this fact, evidencing either ignorance or ideological rejection, both representing serious offenses with a view to the ethical criteria of scientific analyses.
Figure 10: Deviation of Hungary’s annual real GDP growth rate from the average of the V4 countries
–6 –5 –4 –3 –2 –1 0 1 2
1995 1996 1997 1998 1999 2000 2001 2002 2003 2004 2005 2006 2007 2008 2009 2010 2011 2012 2013 2014 2015 2016
Source: The author’s calculation on the basis of World Bank data
Figure 11: Deviation of Hungary’s annual GDP growth rate from the average of the Visegrád countries, Hungarian budget deficit to GDP and current account balance to GDP
–12 –10 –8 –6 –4 –2 0 2 4 6
1995 1996 1997 1998 1999 2000 2001 2002 2003 2004 2005 2006 2007 2008 2009 2010 2011 2012 2013 2014 2015 2016
Deviation of Hungary from the average of V4 countries Deficit to GDP
Balance of current account Source: The author’s calculation on the basis of World Bank data
As a country cannot be isolated from the rest of the world, and this applies to Hungary exponentially, the current account needs to be analysed. As evidenced in the Figure 11, in the second half of the period, with an improvement of the country’s relative position, the balance changed to a comfortable surplus, and this could facili- tate favourable growth data. Hungary’s membership in the EU could also play a role, but it is doubtful whether without a considerable devaluation of the forint the process could have taken place. Thus the existence of a domestic currency can be considered as a favourable asset in this period.
Figure 12: Deviation in Hungary’s budget deficit to GDP from the average of the Visegrád countries, the euro area and the EU, percentage points
–10 –8 –6 –4 –2 0 2 4
1995 1996 1997 1998 1999 2000 2001 2002 2003 2004 2005 2006 2007 2008 2009 2010 2011 2012 2013 2014 2015 2016
Deviation of the deficit from the V4 countries Deviation of the deficit from the eurozone Deviation of the deficit from the EU
Source: The author’s calculation on the basis of IMF WEO data issued in October 2017
The relative position of the Hungarian budget is presented in the Figure 12 against the average of the Visegrád countries, the average of the euro area and the average of the EU as benchmarks. Unfortunately, in the majority of the period, the budget deficit was higher than the references, with only one significant change after 2010, confirm- ing the assumptions made above.
The Figure 13 of the relative position of the gross debt in the public sector relative to GDP reveals that Hungary has so far been on average 20 percentage points more indebted to its regional counterparts, but our position significantly improved compared to the euro area and the EU, since indebtedness is less typical today than in the mid-2000s, when the value of the indicator exceeded the other two averages.
Figure 13: Deviation of Hungary’s sovereign debt relative to GDP from the average of the V4 countries, the euro area and the EU, percentage points
–20 –10 0 10 20 30 40 50
1995 1996 1997 1998 1999 2000 2001 2002 2003 2004 2005 2006 2007 2008 2009 2010 2011 2012 2013 2014 2015 2016
Deviation of state debt from the V4 countries Deviation of state debt from the eurozone Deviation of state debt from the EU
Source: The author’s calculation on the basis of IMF WEO data issued in October 2017
The most important indicator of trade in goods and services with the rest of the world is the balance of current account relative to GDP. A comparison with all bench- marks suggests that the current period is the most favourable in terms of Hungary’s position: in 2016, the current account position exceeded the corresponding figure of the euro area by at least two percentage points, and of the Visegrád countries by four percentage points. In this respect, membership in the EU could have a very positive impact on the trend, as it is Hungary’s most important export market. Naturally, it is a question whether this performance is only temporary or the result of the weakening forint, and yet this has been the greatest macroeconomic achievement since the coun- try’s accession to the EU, and a success achieved especially in the years after 2010.
An analysis of the trends in the real economy, fiscal and economic policy sheds new light on the facts. One cannot go without saying that the new type of economic policy in Hungary has in fact brought about highly positive results. Unfortunately, after the accession to the EU, the Hungarian economic players and the Hungarian society found themselves in a situation where the country lost its regional leadership position.
This resulted in distrust and disappointment with the EU, and in the mid-2000s a series of extremely unfavourable political decisions deteriorated the situation in Hungary.
A turn in fiscal policy integration and in the current account balance have improved the situation, although a significant reduction in debt and a permanent overper- formance in a regional comparison are still awaited. The future prospects of Hungary
Figure 14: Deviation in the current account balance of Hungary relative to GDP from the average of the Visegrád countries, the euro area and the EU, percentage points
–10 –8 –6 –4 –2 0 2 4 6
1995 1996 1997 1998 1999 2000 2001 2002 2003 2004 2005 2006 2007 2008 2009 2010 2011 2012 2013 2014 2015 2016
Deviation of current account from the V4 countries Deviation of current account from the eurozone Deviation of current account from the EU
Source: The author’s calculation on the basis of IMF WEO data issued in October 2017
and the continent can only be analysed on a considerably wider spectrum. In the 21st century the economy will certainly not grow at the pace seen in the 20th century. All this can result in a preference for comparisons based on relative positions rather than absolute terms, as presented above.
Summary and outlook
In addition to economic effects, Hungary’s integration into the EU also has social and political concomitants. The simplest interpretation of the term ‘integration’ requires and analysis of the extent Hungary has become an organic part of the European Un- ion, serving the integrity and development of the larger entity. The fact that the ratios determined in integration theories exceed the thresholds evidences that the EU has a significant role in Hungary’s economy through foreign trade and capital flow.
The KOF index also points to the fact that Hungary is closely linked to the EU and to Western Europe as a result of a conscious country management strategy followed over a longer timeframe.
Hungary has been slowly catching up with the economically more advanced West- ern European countries of higher living standards, but mainly due to wrong econom- ic policy decisions made in the past, precisely in the years following the accession, it fell behind the countries with similar endowments, and this was a negative collective experience. However, the more recent economic policy decisions have improved the
fiscal policy discipline and real economic relations with the rest of the world. In this study the emphasis is on relative rather than absolute growth and convergence. The reason for this is that after the 2007-2008 crisis, the rapid and “easy” economic growth of the previous period does not seem to be available in the longer term. In such a situation, the current position of a country can be determined by comparison to the current performances of countries with similar attributes.
The increasingly sharp contrasts mentioned in this study and the difference be- tween the development perspectives of the European Commission and the Hungar- ian government in economic, geopolitical and social policy suggest further possible conflicts to expect between the parties in the future. The current Brexit negotiations, as well as numerous disruption and confrontation processes, certainly raise the need for a theoretical analysis of disintegration.
References
Ágh, Attila (2012): Demokráciakutatás a politikai és közpolitikai elemzés keresztútján: a demokráciák minősége és teljesítőképessége [Research in democracy at the crossroads of political and public policy analyses: the quality and performance of democracies]. Politikatudományi Szemle, Vol. 21, No. 2, pp. 55-72.
Bache, Ian; George, Simon and Bulmer, Stephen (2011): Politics in the European Union. Oxford University Press, Oxford.
Bóka, Éva (2001): Az európai egységgondolat fejlődéstörténete [A history of the idea of a unified Europe]. Napvi- lág, Budapest.
Balázs, Péter (2003): Európai egyesülés és modernizáció [Europe’s unification and modernisation]. Osiris Ki- adó, Budapest.
Hettyey, András (2017): „A magyar pozíció teljes körű érvényesítésére nincs esély”: Magyarország európai uniós csat- lakozási tárgyalásai és a német külpolitika [No chance for the full enforcement of the Hungarian position:
Hungary’s negotiations to accede the European Union and German foreign policy]. Külügyi Szemle, Vol.
17, No. 1, http://real.mtak.hu/64338/ (access 12 January 2018).
Kucséber, László Zoltán (2014): A határon átnyúló fúziók piaci és pénzügyi jellemzői Magyarországon, a külföldi közvetlen befektetések tükrében [The market and financial characteristics of cross-border fu- sions in Hungary in light of foreign direct investments]. Competitio, Vol. 13, No. 1, pp. 30-46, https://
doi.org/10.21845/comp/2014/1/2.
Lentner, Csaba (2005): Rendszerváltás és pénzügypolitika [Change of regime and financial policy]. Akadémiai Kiadó, Budapest.
Losoncz, Miklós (2011): Az Európai Unió Rómától Budapestig [The European Union from Rome to Buda- pest]. Tri-Mester, Tatabánya.
Palánkai, Tibor (2010): Az integráció mérésének lehetőségei [Measuring the level of integration]. Köz- gazdaság, Vol. 5, No. 4, pp. 47-72.
Palánkai, Tibor; Kengyel, Ákos; Kutasi, Gábor; Benczes, István and Nagy, Sándor Gy. (2011): A globális és re- gionális integráció gazdaságtana [Economics of global and regional integration]. Akadémiai Kiadó, Budapest.
Pintér, Tibor (2016): Az Európai Unió bővítése. Szerbia integrációjának kérdései [Enlargement of the European Union, issues related to the integration of Serbia]. Doctoral thesis, Széchenyi István University, http://
rgdi.sze.hu/images/RGDI/honlapelemei/fokozatszerzesi_anyagok/pinter_tibor_disszertacio.pdf (ac- cess 28 November 2017).
Pogátsa, Zoltán (2009): Álomunió. Európai piac állam nélkül [A dream union: A European market without states]. Nyitott Könyvműhely, Budapest.
Sey, István (2008): Fejezetek az európai integráció 20. századi történetéből [Chapters from the history of the Eu- ropean integration]. Universitas-Győr, Győr.