Revised manuscript accepted for publication. Published in the Journal of Proteome Research, 2018, 17 (5), pp 1898–1906. DOI: 10.1021/acs.jproteome.7b00912
Selection of collision energies in proteomics mass spectrometry experiments for best peptide
identification: study of Mascot score energy dependence reveals double optimum
Ágnes Révész,1) Tibor András Rokob,2) § Dany Jeanne Dit Fouque,3) Lilla Turiák,1) Antony Memboeuf,3) Károly Vékey,1) László Drahos*1)
1) MS Proteomics Research Group, Research Centre for Natural Sciences, Hungarian Academy of Sciences, Magyar Tudósok körútja 2., H-1117, Budapest, Hungary
2) Theoretical Chemistry Research Group, Research Centre for Natural Sciences, Hungarian Academy of Sciences, Magyar Tudósok körútja 2., H-1117, Budapest, Hungary
3) UMR CNRS 6521, CEMCA, Université de Bretagne Occidentale, 6 Av. Le Gorgeu, 29238 Brest Cedex 3, France
KEYWORDS: mass spectrometry, peptide fragmentation, Mascot score, collision energy, optimization, curve fitting
§ This author no longer works in academia.
ABSTRACT: Collision energy is a key parameter determining the information content of beam- type collision induced dissociation MS/MS spectra, and its optimal choice largely affects successful peptide and protein identification in MS-based proteomics. For an MS/MS spectrum, quality of peptide match based on sequence database search, often characterized in terms of a single score, is a complex function of spectrum characteristics, and its collision energy dependence has remained largely unexplored. We carried out ESI-Q-TOF-MS/MS measurements on 2807 peptides from tryptic digest of HeLa and E. coli at 21 different collision energies. Agglomerative clustering of the resulting Mascot score vs. energy curves revealed that only few of them display a single, well-defined maximum; rather, they feature either a broad plateau or two clear peaks.
Non-linear least squares fitting of one or two Gaussian functions allowed the characteristic energies to be determined. We found that the double peaks and the plateaus in Mascot score can be associated with the different energy dependence of b and y type fragment ion intensities. We determined that the energies for optimum Mascot scores follow separate linear trends for the unimodal and bimodal cases with rather large residual variance even after differences in proton mobility are accounted for. This leaves room for experiment optimization and points to the possible influence of further factors beyond m/z.
INTRODUCTION
In recent years, major development of experimental techniques and data processing, relying on bioinformatics, has largely extended the capabilities of mass spectrometry (MS) based proteomics research. Thanks to the combination of advances in instrumentation, fragmentation methods, and analysis strategies, MS has become an indispensable tool for the study of protein expression, protein interactions, and modifications.1–10 A typical strategy for obtaining proteomics information
from a biological sample consists of the combination of enzymatic digestion (usually by trypsin) followed by (nano)-liquid chromatography electrospray ionization tandem MS of the resulting peptides. One of the fragmentation approaches is the data-dependent MS/MS analysis (DDA), where first an MS scan is measured, and then precursor ions are selected for sequential MS/MS events during the cycle time using mass and charge dependent fragmentation parameters. The fragment ion spectrum of a peptide is then searched against a sequence database to identify the peptide sequence, and the search score measures the similarity between the experimental and theoretical spectrum, thereby shows the confidence of the peptide-spectrum match.
In the frequently employed beam-type collision induced dissociation (CID) experiments, collision energy is one of the most important parameters influencing the quality of an MS/MS spectrum.
Although its choice significantly affects the information content of the spectra and thereby the efficiency of data-dependent analysis experiments, optimization of collision energy is far from being straightforward; moreover, different objectives may require different optimal values. In fact, numerous investigations have addressed the optimal choice of collision energy for peptides. The target variables for optimization were either a) maximum intensity of a parent–fragment transition,11–17 or b) the optimum was defined as the value providing a given survival yield (ratio of the parent ion intensity to the summed intensity of parent and all fragments).18–20 The former has outstanding importance in peptide quantitation but is not necessarily the best indicator for confident peptide identification characterized by the typically employed scoring functions.
Regarding the latter, it has not been studied how it correlates with successful peptide identification.
Furthermore, in proteomics MS experiments, use of much lower, close to zero survival yields is typical. Last but not least, most of the above mentioned studies only covered a very small number of peptides (typically less than 100), making it harder to form general conclusions.
The question is also relevant in the field of post-translational modifications (PTMs), where an additional complexity stems from different optimal conditions for determining peptide sequence and PTM structure. Several types of modifications (e.g., phosphorylation, glycosylation) are more labile than the peptide backbone itself, and significantly reduced collision energy may provide correct information on structure and/or attachment site.21–29 In this respect, a relevant work by Hinneburg et al.23 targeted maximum information on both the glycan and peptide moiety in a single tandem MS experiment. The latter was characterized by the peptide intensity coverage score, defined as the sum of intensities of all fragments explained by peptide fragmentation divided by the sum of intensities of all product ions. Due to the specific focus of the study, again a relatively small number of peptides derived from only 4 different proteins were involved in the examination.
Other approaches targeted higher number of identified peptides or proteins, but in these cases, the detailed peptide level information is lacking.30–32
With respect to individual peptide ions, these above mentioned collision energy dependence studies in general reveal a charge dependent linear trend between the optimal collision energy and peptide m/z value, although the correlation coefficient varies significantly. Neta et al.18 also found that the amino acid composition and the number of mobile protons also influence the collision energy for 50 % fragmentation. Further, in a systematic study aiming maximum fragment ion intensity, Holstein et al.11 showed that b ions tend to require lower collision energy than y ions. In line with these findings, MS instrument vendors provide default collision energy choices that are linear with m/z.33 On the other hand, systematic studies aiming to explore the correlation between collision energy and successful peptide identification at level of individual peptides are still lacking in the literature. Such studies could provide important background information for data dependent
analysis experiment design, including the potential use of multiple collision energies simultaneously, which has been explored to some extent.23,30,34,35
In light of the above, we set out to investigate how confidence in peptide identification varies with collision energy. Several types of identification scores have been devised and are commonly employed;36,37 here, we focus on the behavior of one of the most frequently employed approaches, the Mascot score.38 The Mascot score characterizes the probability p that the observed match between the experimental peaks and the sequence is a random event. The score is computed as
−10×log p, with higher scores indicating lower probability, hence, higher confidence. During the scoring of an MS/MS spectrum, Mascot does not take into account all peaks. Instead, the spectrum is divided into 110 Da wide segments, and only the most intense peak from each segment is considered. The score is determined in this way, and then the approach is iteratively repeated, adding the next most intense peak from each segment in each round, until the score cannot be improved any more. The highest value obtained in this way will be the final score.38,39
In this article, we thus present the investigation of the MS/MS collision energy dependence of confident peptide identification as characterized by the Mascot score. We identify the optimal choice of collision energy and its dependence on peptide m/z value, and we provide an explanation for the markedly different behavior from other optimization targets. Our aim is to carry out this analysis on a relatively large number of tryptic peptides, trypsin being the most frequently employed digestion enzyme. We targeted the simultaneous processing of many proteins/peptides, present in various concentrations in complex samples. We chose two commercially available standards, the tryptic digests of HeLa and E. coli cells for this purpose. We believe that the findings obtained from a large array of systematic measurements can help to better exploit the potential present in current LC-MS/MS techniques.
EXPERIMENTAL SECTION
Chemicals and reagents
LC-MS grade solvents and HeLa tryptic digest standard were purchased from Sigma Aldrich (Sigma-Aldrich Kft., Budapest, Hungary) and Thermo Fisher Scientific (Thermo Fisher Scientific, Waltham, MA, USA), respectively. MassPREP enolase digestion and MassPREP E. coli digestion standards were from Waters (Waters, Milford, MA, USA).
Mass spectrometry analysis
Liquid chromatography-mass spectrometry investigations were carried out on a Bruker Maxis II ETD Q-TOF (Bruker Daltonics, Bremen, Germany) mass spectrometer equipped with a CaptiveSpray nanoBooster ionization source coupled to an Ultimate 3000 NanoRSLC System (Dionex, Sunnyvale, CA, USA) under the control of Hystar v. 3.2 (Bruker Daltonics, Bremen, Germany). In each run, 50 ng HeLa or 100 ng E. coli digest standard was injected onto an Acclaim PepMap 100 C-18 trap column (5 μm, 100 Å, 100 µm × 20 mm, Thermo Fisher Scientific, Waltham, MA, USA) using 0.1% trifluoroacetic acid (TFA). Peptides were separated on an Acclaim PepMap RSLC C-18 analytical column (2 μm, 100 Å, 75 µm × 500 mm, Thermo Fisher Scientific, Waltham, MA, USA) at 48 oC using a flow rate of 270 nl/min. The gradient was as follows: 4% B from 0 to 11 min, followed by a 90 min gradient to 50% B, then the concentration of the solvent B was elevated to 90% in 1 min and kept there for 5 min; solvent A was 0.1% formic acid (FA) in water, while solvent B was 0.1% FA in acetonitrile.
Sample ionization was achieved in the positive electrospray ionization mode via a CaptiveSpray nanoBooster ion source. The capillary voltage was set to 1300 V, the nanoBooster pressure was
0.2 bar, the drying gas was heated to 150 oC, and the flow rate was 3 l/min. Internal mass calibration was performed via lock mass for each run using sodium formate. The ion transfer parameters were set as follows: prepulse storage 10 µs, quadrupole ion energy 5 eV, Funnel 1 RF 400 Vpp, Multipole RF 400 Vpp. The collision RF was set to 1200 Vpp, and the ion transfer time was 120 µs. For the MS measurements, a fix cycle time of 2.5 sec was used. MS spectra were acquired over a mass range of 150–2200 m/z at 3 Hz. CID using default intensity threshold (15000) was performed at 16 Hz for abundant precursors (intensity>40000) and at 4 Hz for ones of low abundance (intensity<40000). Note, that in order to limit run-to-run variability of DDA experiments (see below), increased intensity thresholds (400000 and 100000 in case of HeLa and E. coli digest, respectively) were used in the energy dependent examinations, which led to MS/MS acquisition at 16 Hz for all these measurements.
The collision energies applied to fragment the peptides were chosen to be the sum of an m/z dependent default collision energy, given by
collision energy (eV) = 0.0368 × (precursor m/z) + 4.2786, (1)
and a collision energy shift, mapping the –20 eV to +20 eV range in 2 eV steps in 21 separate runs.
Hence, 21 different collision energy values for each peptide were measured, centered at a peptide specific default value, subject to lower limit on the applied collision energy of 5 eV. Note that the 2 eV steps in energy meant different step sizes in voltages for the different charge states. The default linear correlation was determined earlier empirically by tuning the manufacturer’s recommendations to provide a large number of identified proteins and is used routinely in our laboratory for proteomics investigations. Note, however, that the significance of using a default linear correlation is only to avoid measuring peptides at highly irrelevant energies, and its exact
coefficients do not affect our conclusions. An active exclusion of 2 min after 1 spectrum was used except if the intensity of the precursor was elevated threefold. The LC-MS/MS measurements for HeLa at each collision energy shift were run at least twice on two different days, allowing the reproducibility of the results to be assessed, which we present in the SI. In order to obtain statistics on the run-to-run variability of a simple standard, we measured enolase (50 fmol/run) using the LC-MS/MS method described above, applying the default collision energy.
Data Analysis
The raw Q-TOF data were first recalibrated using Bruker Compass DataAnalysis software 4.3 (Bruker Daltonik GmbH, Bremen, Germany) for the internal calibrant. MS/MS peak list generation was performed using ProteinScape software 3.1 (Bruker Daltonik GmbH, Bremen, Germany). The samples were matched with the human SwissProt (2015_08) database using the Mascot search engine v.2.5 (Matrix Science, London, UK). The parameters for the Mascot search were set as follows: trypsin as the enzyme, maximum 2 missed cleavages allowed, cysteine carbamidomethylation as fixed and methionine oxidation, glutamine and asparagine deamidation as variable modifications. Precursor tolerance was set to 7 ppm; the MS/MS tolerance was 0.05 Da, the minimum peptide length was 6, and decoy database was generated by Mascot. The Mascot ion score corresponding to p < 0.05 varied in the range from 13 to 28, on average, it was 22. To ensure confident peptide identifications, we only considered a peptide identified at a given collision energy if its Mascot score exceeded 15, and only peptides identified with a score above 25 at least at one collision energy were included in the investigations.
We studied energy dependence of peptide behavior by combining the results from all runs, obtaining Mascot score vs. collision energy shift curves for all identified peptide ions. Different
charge states of the same sequence were treated separately. Only peptide ions successfully identified at least at 3 consecutive collision energy values were taken into account in the energy dependence analysis.
The score vs. energy shift functions were first normalized by dividing all points with the maximum score for the given peptide ion. The normalized curves were then subjected to an agglomerative cluster analysis40 to identify classes of similar overall behavior. We employed a Euclidean distance measure between curves, computing square root of sum of squared differences at each energy shift.
For the purpose of distance calculation, zero score was assumed for all collision energy shifts where the peptide could not be identified. Ward’s method40 was employed to choose pairs of clusters to merge.
For each peptide ion, the optimum energy was determined from the normalized score vs. collision energy shift data sets by fitting one or two Gaussian functions. This approach allowed us to reduce noise and reliably determine peak positions. The Levenberg–Marquardt algorithm41,42 was employed to directly estimate parameters of the nonlinear model functions:
f1(t) = A exp [–B(t–C)2] (2)
f2(t) = A exp [–B(t–C)2] + D exp [–E(t–F)2] (3)
The A,B,D,E parameters were constrained to be nonnegative. As we did not have any data point with score below 15, we decided to add two points with zero score at a shift of ±35 eV. Thorough manual checking of the data and the resulting fits ensured that these additional points were compatible with the measured trends and in fact improved fit quality by avoiding erroneously wide
peaks to be fitted. The initial parameters of the fit (1 trial set for f1, 4 trial sets for f2) were chosen manually and were the same for all peptide ions.
Where there were less than 12 data points in the original data, we only attempted to fit f1. We accepted the fit and considered peak position C as the optimum collision energy shift if C fell between the highest and lowest shift where we had measured data points. Otherwise, we simply determined the optimum energy by calculating the score-weighted average of all shift values where the peptide appeared.
Data for peptide ions with at least 12 points were fitted using both f1 and f2. The two-peak fit was accepted, and two optimum energies (C and F) were assigned to the peptide ion if all of the following conditions were met:
sum of squares of residuals for the two-peak fit was less than 80% of that of the one-peak fit,
neither of the two peaks was exceedingly narrow (e.g., fitted to a single outlier data point), specifically, B and E were both less than 0.05,
neither of the two peaks had its maximum outside the actually measured collision energy shift range, i.e., C and F both fell between the highest and lowest shift where we had measured data points,
the maximum value of the fitted curve was less than 1.2,
If these conditions were not met, only the fit of f1 or the weighted average were considered, as described above. These criteria were determined empirically, and confirmed by manual inspection
to provide reasonable distinction between experimental curves requiring one or two Gaussians to be described.
The combination of the data from the 21 separate runs for all peptides was carried out using in- house developed Perl scripts built on top of the Mascot Parser API.43 The data were output into Microsoft Excel, where clustering studies were done using the XLSTAT add-on.44 The non-linear fits were carried out, and the corresponding plots were generated by our Perl scripts using the levmar45 and PGPLOT46 libraries through their Perl Data Language interfaces.
RESULTS AND DISCUSSION
To determine the optimal collision energy for tryptic peptides from proteomics identification point of view, we constructed energy dependence curves of Mascot score simultaneously for a large set of peptides identified from standard HeLa and E. coli tryptic digests. Overall, 21 different collision energies were examined for all peptides, mapping the energy dependence in steps of 2 eV. If a peptide was identified more than once in the same LC-MS/MS run, i.e., measured several times at the same collision energy, the best scoring match was accepted.
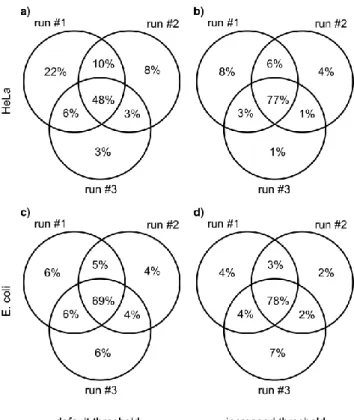
For a DDA sampling strategy on complex samples, it may happen that there is insufficient time to measure MS/MS for all MS peaks. In such cases, it becomes essentially random which peptides are actually measured in a given run.47,48 To overcome this phenomenon and limit run-to-run variability of the set of identified peptides, we increased MS intensity threshold for carrying out MS/MS. In this way, variability statistics on these complex samples (HeLa and E. coli) are notably improved and match those on a very simple one (enolase). Specifically, the fraction of common peptides found in repetitions of identical measurements is significantly higher than with the default threshold (see Figure 1). Of course, this can be achieved at the price of significantly reduced
number of identified peptides. Overall, we identified 3531 peptide ions within the 21+21 runs from the two tryptic digests (2152 from HeLa, 1379 from E. coli). To ensure a meaningful study of energy dependence, only peptide ions identified at least at 3 consecutive collision energy shift values, having a score of at least 25 at least at one of the energies were included in the analysis, yielding 2807 (1721 from HeLa, 1086 from E. coli) peptide ions to process. About three fourth of them were doubly charged, and most of the rest had a charge of +3, with only a few examples for singly and quadruply charged ions.
Figure 1. Overlap of identified peptides from repeated experiments using default MS intensity
threshold to select an ion for DDA analysis (15000 cps) for HeLa (a) and E. coli (c), and increased MS intensity threshold for HeLa (b, 400000 cps) and E. coli (d, 100000 cps). The total number of identified peptide ions with increased threshold was about one third of that with default threshold for both samples.
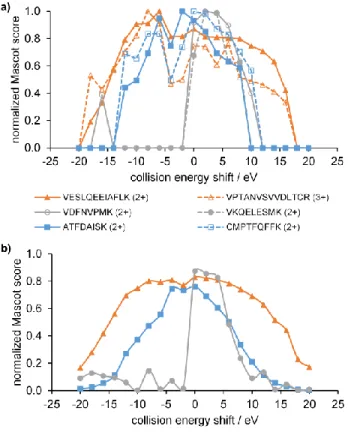
Examples of the energy dependence of Mascot score for a few peptides with different characteristics are depicted in Figure 2a. As apparent, peptides behave quite differently; even the shape of curves varies widely. Further, in contrast to the case of survival yield or maximum intensity of a fragment ion, it becomes very difficult to identify one single optimal energy in many cases. Sometimes a wide plateau appears in the curves, or even two separate maxima can be found.
To characterize this variability on the large set of investigated peptides and thereby get idea how to define collision energy maximizing Mascot score for a given peptide, we employed clustering techniques. As a result of agglomerative cluster analysis, it turned out that the curves can be ranked into three main classes, whose averages are shown in Figure 2b. Results from clustering support the assignment of 3 materially different classes, further details can be found in the SI. Apparently, there are one or two maxima on the curves. Qualitatively, class 3 (13 % of the members) has one narrow maximum somewhat above 0 eV energy shift. Class 2 (66 % of the members) shows 2 separate maxima, one at around energy shift 0–5 eV and another one at ca. 10 eV lower collision energy. Interestingly, the latter one can even belong to higher Mascot score for some of the peptides under study. Class 1 (21 % of the members) has one maximum centered around –5 – 0 eV collision energy shift value, but it shows significant broadening, implying the possible presence of two peaks close to each other. The emergence of a second lower energy peak may be the reason for class 1’s maximum lying at lower energies than that of class 3.
Figure 2. a) Selected examples of normalized Mascot score vs. collision energy shift curves. For
each curve, the coloring shows to which class it belongs. b) Averages of all curves belonging to the three main classes, respectively, coming from cluster analysis.
While cluster averages shown on Figure 2b are rather smooth and possess easily identifiable characteristics, results for individual peptides (Figure 2a) are more affected by noise. It is remarkable that the variance of Mascot scores across measurements is rather high, in spite of using an MS/MS threshold higher than typical in proteomics experiments. In order to reliably determine the optimum energy shifts, we decided to employ non-linear fitting. The results of the clustering strongly suggest that the observed shape of the energy vs score function corresponds to either one or two overlapping peaks. We therefore modeled them using one or two Gaussian functions, and we term these “unimodal” and “bimodal” behavior. We identified the position of the fitted peaks
as the characteristic (optimum) energies. As measurement noise may affect the clustering and the fitting differently, the decision between unimodal and bimodal was made on the basis of the fit quality, and not from the cluster assignment. Nevertheless, in line with expectations, more than 97% of class 3 was unimodal, while for class 1, this number decreases to 89%, reflecting the widening. Similarly, more than 75% of class 2 was bimodal.
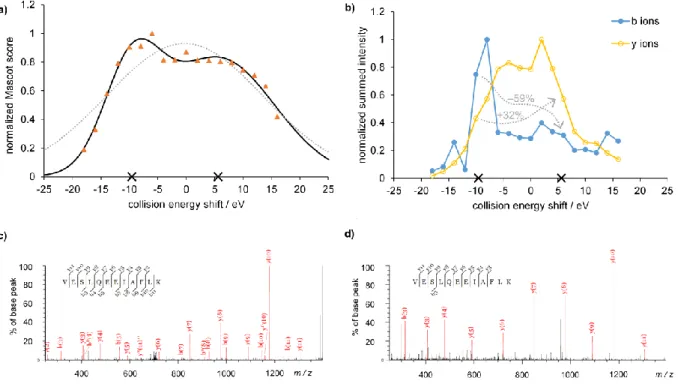
Figure 3a shows the fitting results for a typical class 2 peptide. The obtained fits for all the rest of peptides can be found in the SI. It can be seen that the sum of two Gaussian functions (solid black curve) provides a very good fit giving optimum energies at –9.6 eV and 5.6 eV, while one Gaussian function (dotted gray curve) is not satisfactory to model these data.
In order to get further insight into the nature of the two maxima on the energy dependent Mascot score curve, we determined the summed intensities of the two types of fragment ions (b- and y- type ions, including variants with H2O loss, NH3 loss etc.) produced in the collision induced dissociation experiments as functions of collision energy. The results are illustrated for the VESLQEEIAFLK2+ peptide in Figure 3b. We found that the summed b ion intensity shows a sharp maximum at a collision energy shift roughly corresponding to the first peak of the Mascot score vs energy shift curve. When going to the higher energy peak from the lower energy peak, the summed intensity decreases by 59%. On the other hand, the summed y ion intensity gives a broad plateau, having maximum around the second peak of the Mascot score curve. The summed intensity increases by 32% when going to the higher energy peak from the lower energy peak.
Note, however, that in absolute terms, y ions are equally or more intense than b ions even at low collision energies optimal for b type fragments. The number of b- and y-type ions behave similarly, although the number of y fragments is less sensitive to the applied collision energy in this case.
These differences are also nicely illustrated by the two annotated MS/MS spectra taken at collision
energies closest to the characteristic optimum values for VESLQEEIAFLK2+ peptide, namely –10 eV and 6 eV (see Figures 3c-d). A similar analysis for a bimodal but class 1 peptide CMPTFQFFK2+ (also displayed on Figure 2a above) shows analogous trends though the peak positions are closer to each other; details can be found in the SI.
Figure 3. a) Result of the Gaussian fitting procedure of the energy dependence curve for a class 2
peptide (VESLQEEIAFLK2+). Orange triangles – measured data, solid black line, and solid black crosses – two-Gaussian model function and its peak positions, dotted gray line – one-Gaussian model function. b) Summed intensities of y- and b-type fragments, normalized to their respective maxima, as function of collision energy shift for VESLQEEIAFLK2+ peptide. Black crosses on the horizontal axis show the fitted peak positions. Gray arrows and numbers show the changes when going to the high energy peak from the low energy peak. c) and d) Annotated MS/MS spectra
of VESLQEEIAFLK2+ peptide at two different energies closest to the determined peak positions (–10 eV and 6 eV, respectively).
To establish the general trends exemplified by the observations described above for VESLQEEIAFLK2+ peptide, we considered and compared features of the two MS/MS spectra taken at collision energies that were closest to the peak positions of the Gaussian fitting procedure for all the peptides having bimodal behavior. In complete agreement with the above discussed specific example, we found large energy dependence in the number and summed intensity of b ions, where they prefer lower collision energy. Specifically, the average of the above discussed change in summed intensity when going to the higher energy peak from the lower energy peak amounts to –69% (see Table 1). The average change in their number is comparable, –73%. The y ions are less sensitive to the collision energy but are more intense and more numerous at higher collision energy (average increase of 19% and 13%, respectively).
Table 1. Average change in summed intensity and number of b/y fragment ions in MS/MS spectra when going to the higher from the lower energy peak across all peptide ions
b ions y ions
Intensity Number Intensity Number
–69% –73% +19% +13%
The above observations on the behavior of b and y ion intensities are well in line with the known characteristics of peptide fragmentation processes.11,49–52 Expectedly, such multiply charged tryptic peptide ions produce b and y type fragments at identical rates, but the relative stability of these differ. While y ions are fairly stable, b ions easily fragment further to produce smaller b ions, a ions or internal ions. a ions and internal ions are not taken into account or annotated by Mascot
at all for ESI/QTOF spectra, and for b ions, the further fragmentation leads to a decreased overall intensity, particularly at elevated collision energies. In fact, collision energy optimization toward maximum fragment intensity yields lower optimum for b ions than for y ions.11 On the other hand, it is remarkable to observe that the presence of two maxima in the Mascot score vs energy function can be associated with the different energy dependence of two types of fragment ions. While b ions are less intensive even at their optimum energy, and Mascot only takes into account the most intense peaks in the scoring, the contribution of b ions to reliable identification is significant enough to induce a second Mascot score peak at low energies. Notably, this low energy peak is often higher than the peak at higher energies.
In addition to the varying contributions from b and y ions, another factor that may become important, particularly in the case of +3 or higher charge states, is the formation of doubly charged daughter ions, which easily fragment further at higher energies. For the 3+ or higher charged bimodal peptides, on average we identified 0.92 and 0.34 doubly charged fragment ions at the lower and higher energy peak position, respectively, in line with the expectations. However, the summed intensity of doubly charged fragments was less than 5% of the summed intensity of all fragments in ~90% of the considered MS/MS spectra, meaning that the potential effect on the overall energy dependent behavior of Mascot score is limited.
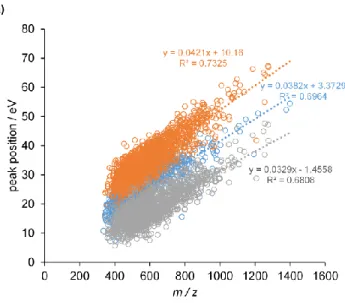
Figure 4. Peak positions in eV as a function of m/z for a) doubly charged peptides b) triply charged
peptides. Blue circles indicate the position of the sole peak for peptides having unimodal behavior, while orange and gray circles are the higher and the lower collision energies, respectively, for bimodal peptides.
On the basis of the fitted Mascot score vs. collision energy shift curves, we then plotted the peak positions, i.e., the optimum values, as a function of m/z, separately for +2 and +3 charged peptides (Figure 4). To allow the trends to be determined without any bias toward our original default collision energy calibration, we display the peak positions as absolute eV values rather than shifts.
For a given peptide, the graphs show either the position of a single peak (blue circles, when one Gaussian was fitted to the Mascot score-collision energy curve), or the positions of the two peaks (orange and gray circles, corresponding to the positions of the two Gaussians). Peak positions in each group follow linear trends with respect to m/z as expected, but the three groups have different m/z dependence. We therefore fitted three separate lines on the peak positions. Even so, we find that the residual variance is large, the R2 values range from 0.45 to 0.75. Some of this variance may be associated with the above discussed noise in our experimental data, but it also indicates that factors other than the m/z can be relevant in determining the optimum energy values.
As discussed widely in the literature,50,53–55 one of the key factors determining the energetics of peptide fragmentation is the presence of mobile proton(s). Three cases are usually distinguished:
1) non-mobile protons, where the number of ionizing protons is less than or equal to the number of Arg residues; 2) partially mobile protons, where the number of ionizing protons is greater than the number of Arg residues, but less than or equal to the number of all basic sites (Lys, Arg, His, N-terminus) 3) mobile protons, where the number of ionizing protons is greater than the number of all basic sites. The fragmentation requires less and less energy in this order, because the presence of protons not sequestered in very basic sites opens up charge-directed fragmentation pathways.
In our experiments, the peptide ions bearing +2 charge are almost always tryptic with no missed cleavages. Hence, they fall into the partially mobile category, and proton mobility cannot account for the observed residual variance. On the other hand, only roughly two thirds of the analyzed +3
ions were in the partially mobile category, while the rest had mobile protons, allowing a meaningful comparison. As expected, we found that the presence of mobile protons lowers the optimum collision energy for the unimodal peptides, as well as the lower optimum for the bimodal peptides, by ~4.5 eV on average. The lowering is only ~1 eV for the higher optimum of bimodal peptides, but the difference is still significant at the 5% confidence level in a Welch’s t-test (see Supporting Information for details). At the same time, linear fits of optimum energy vs. m/z separately for peptides with mobile and partially mobile protons show comparable R2 values to the overall fits, indicating that other factors are also important for the +3 ions. In the literature, several studies investigated the effects of sequence on fragmentation patterns and energetics,18,19,54–62 but the question in connection with (Mascot) score optimization has remained open and might warrant further investigation.
In general, approximately half of the peptides have bimodal behavior, and for higher m/z, it is even more typical to have double maxima. The presence of the double maximum in the energy dependence of Mascot score thus seems to be a widespread, and so far, overlooked phenomenon.
The two fitted slopes for the two positions of the double peak are different, but still the lines are remarkably parallel, not showing any tendency to meet at a common origin. In other words, difference between the two peaks shows only weak m/z dependence, and it is ~17 eV on average for both +2 and +3 ions. Notably, an analogous phenomenon was observed, although not commented on, by Holstein et al. in their regressions for optimal collision energies targeting highest intensities of individual b and y ions in MRM experiments.11 The weak m/z dependence of the difference might thus be related to the specific behavior of b and y ions under collisional activation.
As expected, +2 ions require larger energies, as evidenced by the larger slopes with comparable intersects. For the more prevalent +2 ions, the one-peak trendline is very close to our original collision energy vs m/z function (the “zero shift”). This indicates that our previous strategy targeting large number of identified peptides already yielded quite reasonable energy values in terms of Mascot score optimization. Specifically, for unimodal peptides and considering all charge states, average of Mascot scores obtained from the measurements closest to the peak position was approximately 4% higher than from the measurement at zero shift, i.e., the earlier default, which is a slight increase. For the peptides having bimodal behavior, measurements closest to the position of the higher peak yielded a ca. 15% increase in average Mascot score over the zero shift. As apparent from Figure 4, the optimum is farther away from the earlier default for these ions, so the higher increase is expected. Nevertheless, the Mascot score vs. collision energy curves are rather flat in these cases, limiting the possible gain in score. Importantly, since it has been demonstrated in the literature that Q-TOF MS/MS data share high degree of similarity with HCD MS/MS data, our findings gathered on a Bruker Q-TOF equipment may be relevant for the state-of-the art Orbitrap mass spectrometers most frequently used in shotgun proteomics.13,14
CONCLUSIONS
In this work, we investigated the collision energy dependence of Mascot score for all high intensity peptides from tryptic digests of HeLa and E. coli cells. To our knowledge, this is the first study to investigate the energy dependence of a measure directly related to peptide identification via database searches on a large number of tryptic peptides (2807). We mapped this dependence via repeated experimental runs with collision energies systematically shifted by a constant amount from a default linear m/z dependent value. Following peptide identification by the Mascot search
patterns among the resulting curves, and carried out non-linear least squares fitting of Gaussian model functions to estimate characteristic energies pertaining to Mascot score optima. Our studies allowed us to draw the following conclusions for tryptic peptides:
1. In the Mascot score vs. collision energy curves, several distinct behaviors can be identified.
Some peptide ions show a well-defined maximum around a certain energy. In the majority of cases, however, the curves feature either a broad plateau with one ill-defined maximum or two well-separated peaks with somewhat lower scores in-between them.
2. While the maxima are not well defined, and the determination of their positions are further hampered by experimental noise, we found that the observed curve shapes can be well modeled using one or two Gaussian functions. Peak positions could thus be determined reliably using a non-linear curve fitting approach.
3. Our analysis of the number and intensities of the b and y type fragment ions revealed that the presence of the two maxima in the Mascot score curve is linked to the different energy dependence of b and y fragment ion intensities. While this behavior of b and y ions was already described in the literature, our study is the first to quantify how the less abundant b ions can give rise to favorable peptide identification at significantly smaller energies than the intensity optimum for y ions.
4. The determined energies maximizing Mascot score were found to show the expected linear m/z dependence, though with a rather large residual variance. Where two maxima exist, their difference is surprisingly m/z independent. Proton mobility is uniform for +2 ions, while for +3 ions, we found that its differences have a marked effect on the optimum energy. Still, there seem to be further factors influencing the optimum.
5. Collision energy optimization specific to Mascot score can offer some gain over a preliminary optimization toward high number of identified peptides/proteins. For unimodal and bimodal peptide ions, ~4% and ~15% increase in average score could be obtained by measuring at the optimum energies. The observed gain is limited because the single-peak optimum is close to the earlier optimization, and the double-peak curves are generally flat.
The above findings corroborate that successful peptide identification in proteomics experiments can depend in a complex way on parameters, and it is determined by several factors. While the underlying processes have been amply discussed in the literature, high level studies of the resulting behavior also seem to be warranted to understand their interplay. Further work is ongoing in our laboratory to shed more light on the peptide characteristics responsible for the various observed behavior classes, and to better describe optimum energies by relating them to other variables beyond mass and charge.
Supporting Information.
Text S1. Agglomerative cluster analysis for up to 8 clusters. Figures S1–S5. Averages of all curves belonging to the 4–8 classes coming from cluster analysis. Text S2. Reproducibility. Figure S6.
Explanation of notation on supplementary figure sets displaying raw fit results. Figure S7. b/y ion intensity analysis for the class 1 peptide CMPTFQFFK2+. Figure S8. Peak positions in eV as a function of m/z for triply charged peptides with mobile and partially mobile protons. Table S1.
Statistical analysis of the difference between optimum energies for triply charged peptides with mobile and partially mobile protons. (PDF)
Figure set S1. Fitted curves for all analyzed peptides (ZIP) Corresponding Author
* László Drahos: drahos.laszlo@ttk.mta.hu, (+36-1) 382 6542
Acknowledgements
Á.R. and L.T. were supported by the János Bolyai Research Scholarship of the Hungarian Academy of Sciences. Funding from the National Research, Development and Innovation Office (NKFIH K-109006 and VKSZ-12-1-2013-0001) is gratefully acknowledged.
REFERENCES
(1) Han, X.; Aslanian, A.; Yates, J. R. Mass Spectrometry for Proteomics. Curr. Opin. Chem.
Biol. 2008, 12, 483–490.
(2) Hernandez, P.; Müller, M.; Appel, R. D. Automated Protein Identification by Tandem Mass Spectrometry: Issues and Strategies. Mass Spectrom. Rev. 2006, 25, 235–254.
(3) Domon, B.; Aebersold, R. Mass Spectrometry and Protein Analysis. Science (80-. ). 2006, 312, 212–217.
(4) Nesvizhskii, A. I.; Vitek, O.; Aebersold, R. Analysis and Validation of Proteomic Data Generated by Tandem Mass Spectrometry. Nat. Methods 2007, 4, 787–797.
(5) Yates, J. R.; Ruse, C. I.; Nakorchevsky, A. Proteomics by Mass Spectrometry: Approaches, Advances, and Applications. Annu. Rev. Biomed. Eng. 2009, 11, 49–79.
(6) Holl, S.; Mohammed, Y.; Zimmermann, O.; Palmblad, M. Scientific Workflow Optimization for Improved Peptide and Protein Identification. BMC Bioinformatics 2015, 16, 284–296.
(7) Nielsen, M. L.; Savitski, M. M.; Zubarev, R. A. Improving Protein Identification Using Complementary Fragmentation Techniques in Fourier Transform Mass Spectrometry. Mol.
Cell. Proteomics 2005, 4, 835–845.
(8) Baldwin, M. A. Protein Identification by Mass Spectrometry. Mol. Cell. Proteomics 2004, 3, 1–9.
(9) Szabo, Z.; Janaky, T. Challenges and Developments in Protein Identification Using Mass Spectrometry. TrAC - Trends Anal. Chem. 2015, 69, 76–87.
(10) Olsen, J. V.; Mann, M. Status of Large-Scale Analysis of Post-Translational Modifications by Mass Spectrometry. Mol. Cell. Proteomics 2013, 12, 3444–3452.
(11) Holstein, C. A.; Gafken, P. R.; Martin, D. B. Collision Energy Optimization of B-and Y- Ions for Multiple Reaction Monitoring Mass Spectrometry. J. Proteome Res. 2011, 10, 231–
240.
(12) MacLean, B.; Tomazela, D. M.; Abbatiello, S. E.; Zhang, S.; Whiteaker, J. R.; Paulovich, A. G.; Carr, S. A.; MacCoss, M. J. Effect of Collision Energy Optimization on the Measurement of Peptides by Selected Reaction Monitoring (SRM) Mass Spectrometry.
Anal. Chem. 2010, 82, 10116–10124.
(13) De Graaf, E. L.; Altelaar, M. A. F.; Van Breukelen, B.; Mohammed, S.; Heck, A. J. R.
Improving SRM Assay Development: A Global Comparison between Triple Quadrupole, Ion Trap, and Higher Energy CID Peptide Fragmentation Spectra. J. Proteome Res. 2011, 10, 4334–4341.
(14) Wu, C.; Shi, T.; Brown, J. N.; He, J.; Gao, Y.; Fillmore, T. L.; Shukla, A. K.; Moore, R. J.;
Camp, D. G.; Rodland, K. D.; Qian, W.-J.; Liu, T.; Smith, R. D. Expediting SRM Assay Development for Large-Scale Targeted Proteomics Experiments. J. Proteome Res. 2014, 13, 4479–4487.
(15) Sherwood, C. A.; Eastham, A.; Lee, L. W.; Risler, J.; Mirzaei, H.; Falkner, J. A.; Martin, D. B. Rapid Optimization of MRM-MS Instrument Parameters by Subtle Alteration of Precursor and Product M/z Targets. J. Proteome Res. 2009, 8, 3746–3751.
(16) Picotti, P.; Aebersold, R. Selected Reaction Monitoring–based Proteomics: Workflows, Potential, Pitfalls and Future Directions. Nat. Methods 2012, 9, 555–566.
(17) Holman, S. W.; Sims, P. F. G.; Eyers, C. E. The Use of Selected Reaction Monitoring in Quantitative Proteomics. Bioanalysis 2012, 4, 1763–1786.
(18) Neta, P.; Simon-Manso, Y.; Yang, X.; Stein, S. E. Collisional Energy Dependence of Peptide Ion Fragmentation. J. Am. Soc. Mass Spectrom. 2009, 20, 469–476.
(19) Haller, I.; Mirza, U. A.; Chait, B. T. Collision Induced Decomposition of Peptides. Choice of Collision Parameters. J. Am. Soc. Mass Spectrom. 1996, 7, 677–681.
(20) Baker, E. S.; Tang, K.; Danielson, W. F.; Prior, D. C.; Smith, R. D. Simultaneous Fragmentation of Multiple Ions Using IMS Drift Time Dependent Collision Energies. J.
Am. Soc. Mass Spectrom. 2008, 19, 411–419.
(21) Hu, H.; Khatri, K.; Zaia, J. Algorithms and Design Strategies towards Automated Glycoproteomics Analysis. Mass Spectrom. Rev. 2017, 36, 475–498.
(22) Segu, Z. M.; Mechref, Y. Characterizing Protein Glycosylation Sites through Higher- Energy C-Trap Dissociation. Rapid Commun. Mass Spectrom. 2010, 24, 1217–1225.
(23) Hinneburg, H.; Stavenhagen, K.; Schweiger-Hufnagel, U.; Pengelley, S.; Jabs, W.;
Seeberger, P. H.; Silva, D. V.; Wuhrer, M.; Kolarich, D. The Art of Destruction: Optimizing
Collision Energies in Quadrupole-Time of Flight (Q-TOF) Instruments for Glycopeptide- Based Glycoproteomics. J. Am. Soc. Mass Spectrom. 2016, 27, 507–519.
(24) Krenyacz, J.; Drahos, L.; Vékey, K. Letter: Collision Energy and Cone Voltage Optimisation for Glycopeptide Analysis. Eur. J. Mass Spectrom. 2009, 15, 361–365.
(25) Vékey, K.; Ozohanics, O.; Tóth, E.; Jek, A.; Révész, Á.; Krenyácz, J.; Drahos, L.
Fragmentation Characteristics of Glycopeptides. Int. J. Mass Spectrom. 2013, 345–347.
(26) Liu, X.; Jin, Z.; O’Brien, R.; Bathon, J.; Dietz, H. C.; Grote, E.; Van Eyk, J. E. Constrained Selected Reaction Monitoring: Quantification of Selected Post-Translational Modifications and Protein Isoforms. Methods 2013, 61, 304–312.
(27) Zhao, Y.; Brasier, A. R. Applications of Selected Reaction Monitoring (SRM)-Mass Spectrometry (MS) for Quantitative Measurement of Signaling Pathways. Methods 2013, 61, 313–322.
(28) Zhang, Y.; Ficarro, S. B.; Li, S.; Marto, J. A. Optimized Orbitrap HCD for Quantitative Analysis of Phosphopeptides. J. Am. Soc. Mass Spectrom. 2009, 20, 1425–1434.
(29) Linke, D.; Hung, C. W.; Cassidy, L.; Tholey, A. Optimized Fragmentation Conditions for iTRAQ-Labeled Phosphopeptides. J. Proteome Res. 2013, 12, 2755–2763.
(30) Diedrich, J. K.; Pinto, A. F. M.; Yates, J. R. Energy Dependence of HCD on Peptide Fragmentation: Stepped Collisional Energy Finds the Sweet Spot. J. Am. Soc. Mass Spectrom. 2013, 24, 1690–1699.
(31) Distler, U.; Kuharev, J.; Navarro, P.; Levin, Y.; Schild, H.; Tenzer, S. Drift Time-Specific
Collision Energies Enable Deep-Coverage Data-Independent Acquisition Proteomics. Nat.
Methods 2014, 11, 167–170.
(32) Tran, T. T.; Strozynski, M.; Thiede, B. Quantitative Phosphoproteome Analysis of Cisplatin-Induced Apoptosis in Jurkat T Cells. Proteomics 2017, 17, 1600470.
(33) Thermo Fisher Scientific Product Support Bulletin 104. Normalized Collision Energy Technology http://tools.thermofisher.com/content/sfs/brochures/PSB104-Normalized- Collision-Energy-Technology-EN.pdf.
(34) Cao, Q.; Zhao, X.; Zhao, Q.; Lv, X.; Ma, C.; Li, X.; Zhao, Y.; Peng, B.; Ying, W.; Qian, X.
Strategy Integrating Stepped Fragmentation and Glycan Diagnostic Ion-Based Spectrum Refinement for the Identification of Core Fucosylated Glycoproteome Using Mass Spectrometry. Anal. Chem. 2014, 86, 6804–6811.
(35) Thermo Fisher Scientific Product Support Bulletin 121. Collision Activation Resulting Stepped Range Steps Energy Time Normalized Collision Energy Enhanced Fragmentation of Small Molecules in a Thermo Scientific LTQ Series Linear Ion Trap Mass Spectrometer
Using Stepped Normalized Collision Energy
https://fscimage.fishersci.com/images/D13514~.pdf.
(36) Wright, J. C.; Choudhary, J. S. PSM Scoring and Validation. In Proteome Informatics;
Bessant, C., Ed.; The Royal Society of Chemistry, 2017; pp 69–92.
(37) Nesvizhskii, A. I. A Survey of Computational Methods and Error Rate Estimation Procedures for Peptide and Protein Identification in Shotgun Proteomics. J. Proteomics 2010, 73, 2092–2123.
(38) Perkins, D. N.; Pappin, D. J. C.; Creasy, D. M.; Cottrell, J. S. Probability-Based Protein Identification by Searching Sequence Databases Using Mass Spectrometry Data.
Electrophoresis 1999, 20, 3551–3567.
(39) Cottrell, J. Some peaks are more equal than others http://www.matrixscience.com/blog/some-peaks-are-more-equal-than-others.html.
(40) Abu-Jamous, B.; Fa, R.; Nandi, A. K. Hierarchical Clustering. In Integrative Cluster Analysis in Bioinformatics; John Wiley & Sons, Ltd., 2015; pp 157–166.
(41) Levenberg, K. A Method for the Solution of Certain Non-Linear Problems in Least Squares.
Q. Appl. Math. 1944, 2, 164–168.
(42) Marquardt, D. An Algorithm for Least-Squares Estimation of Nonlinear Parameters. SIAM J. Appl. Math. 1963, 11 (2), 431–441.
(43) Mascot Parser. Matrix Science, http://www.matrixscience.com/msparser.html.
(44) XLSTAT 2016: Data Analysis and Statistical Solution for Microsoft Excel. Addinsoft, Paris, France, https://www.xlstat.com 2016.
(45) Lourakis, M. I. A. Levmar: Levenberg-Marquardt Nonlinear Least Squares Algorithms in C/C++, Version 2.6. Institute of Computer Science, Foundation for Research and Technology – Hellas, Heraklion, Greece, http://www.ics.forth.gr/~lourakis/levmar/ 2011.
(46) Pearson, T. PGPLOT 5.2.2. California Institute of Technology, http://www.astro.caltech.edu/~tjp/pgplot/ 2001.
6, 411–412.
(48) Bell, A. W.; Deutsch, E. W.; Au, C. E.; Kearney, R. E.; Beavis, R.; Sechi, S.; Nilsson, T.;
Bergeron, J. J. M. A HUPO Test Sample Study Reveals Common Problems in Mass Spectrometry–based Proteomics. Nat. Methods 2009, 6, 423–433.
(49) Taylor, J. A.; Johnson, R. S. Implementation and Uses of Automated de Novo Peptide Sequencing by Tandem Mass Spectrometry. Anal. Chem. 2001, 73, 2594–2604.
(50) Paizs, B.; Suhai, S. Fragmentation Pathways of Protonated Peptides. Mass Spectrom. Rev.
2005, 24, 508–548.
(51) Lau, K. W.; Hart, S. R.; Lynch, J. A.; Wong, S. C. C.; Hubbard, S. J.; Gaskell, S. J.
Observations on the Detection of B- and Y-Type Ions in the Collisionally Activated Decomposition Spectra of Protonated Peptides. Rapid Commun. Mass Spectrom. 2009, 23, 1508–1514.
(52) Waldera-Lupa, D. M.; Stefanski, A.; Meyer, H. E.; Stühler, K. The Fate of B-Ions in the Two Worlds of Collision-Induced Dissociation. Biochim. Biophys. Acta - Proteins Proteomics 2013, 184, 2843–2848.
(53) Boyd, R.; Somogyi, Á. The Mobile Proton Hypothesis in Fragmentation of Protonated Peptides: A Perspective. J. Am. Soc. Mass Spectrom. 2010, 21, 1275–1278.
(54) Wysocki, V. H.; Tsaprailis, G.; Smith, L. L.; Breci, L. A. Mobile and Localized Protons: A Framework for Understanding Peptide Dissociation. J. Mass Spectrom. 2000, 35, 1399–
1406.
(55) Dongré, A. R.; Jones, J. L.; Somogyi, Á.; Wysocki, V. H. Influence of Peptide Composition, Gas-Phase Basicity, and Chemical Modification on Fragmentation Efficiency: Evidence for the Mobile Proton Model. J. Am. Chem. Soc. 1996, 118, 8365–8374.
(56) Tabb, D. L.; Huang, Y.; Wysocki, V. H.; Yates, J. R. Influence of Basic Residue Content on Fragment Ion Peak Intensities in Low-Energy Collision-Induced Dissociation Spectra of Peptides. Anal. Chem. 2004, 76, 1243–1248.
(57) Barton, S. J.; Richardson, S.; Perkins, D. N.; Bellahn, I.; Bryant, T. N.; Whittaker, J. C.
Using Statistical Models to Identify Factors That Have a Role in Defining the Abundance of Ions Produced by Tandem MS. Anal. Chem. 2007, 79, 5601–5607.
(58) Huang, Y.; Triscari, J. M.; Tseng, G. C.; Pasa-Tolic, L.; Lipton, M. S.; Smith, R. D.;
Wysocki, V. H. Statistical Characterization of the Charge State and Residue Dependence of Low-Energy CID Peptide Dissociation Patterns. Anal. Chem. 2005, 77, 5800–5813.
(59) Zhou, X. X.; Zeng, W. F.; Chi, H.; Luo, C.; Liu, C.; Zhan, J.; He, S. M.; Zhang, Z. PDeep:
Predicting MS/MS Spectra of Peptides with Deep Learning. Anal. Chem. 2017, 89, 12690–
12697.
(60) Rogalski, J. C.; Lin, M. S.; Sniatynski, M. J.; Taylor, R. J.; Youhnovski, N.; Przybylski, M.;
Kast, J. Statistical Evaluation of Electrospray Tandem Mass Spectra for Optimized Peptide Fragmentation. J. Am. Soc. Mass Spectrom. 2005, 16, 505–514.
(61) Sun, S.; Yang, F.; Yang, Q.; Zhang, H.; Wang, Y.; Bu, D.; Ma, B. MS-Simulator: Predicting Y-Ion Intensities for Peptides with Two Charges Based on the Intensity Ratio of Neighboring Ions. J. Proteome Res. 2012, 11, 4509−4516.
(62) Mouls, L.; Aubagnac, J. L.; Martinez, J.; Enjalbal, C. Low Energy Peptide Fragmentations in an ESI-Q-Tof Type Mass Spectrometer. J. Proteome Res. 2007, 6, 1378–1391.
TOC graphic