DOI: 10.1556/606.2018.13.3.19 Vol. 13, No. 3, pp. 197–208 (2018) www.akademiai.com
AN ASSESSMENT OF SOIL WATER EROSION IN THE MYJAVA HILL LAND: THE APPLICATION OF
A PHYSICALLY-BASED EROSION MODEL
1 Zuzana NÉMETOVÁ, 2 David HONEK, 3 Tamara LÁTKOVÁ
4 Monika ŠULC MICHALKOVÁ, 5 Silvia KOHNOVÁ
1,3,5
Department of Land and Water Resources Management, Faculty of Civil Engineering Slovak University of Technology, Radlinského 11, 810 05 Bratislava, Slovak Republic e-mail: 1zuzana.nemetova@gmail.com, 3tamara.latkova@gmail.com,5kohnova@stuba.sk
2,4 Department of Geography, Faculty of Science, Masaryk University, Kotlářská 2 611 37 Brno, Czech Republic, e-mail: 2324439@mail.muni.cz, 4monika.michalko@gmail.com
Received 22 December 2017; accepted 29 April 2018
Abstract: The scope of this study is an evaluation of potential soil water erosion using the physically-based erosion model, EROSION-3D. This model is event-based and calculates soil water erosion during an actual measured rainfall event. The calculations of the erosion model take advantage of a digital elevation model, precipitation and soil parameters, which are established in a specific parameter catalogue. The soil water erosion was modeled in two small catchments in the Myjava Hill Land (Slovakia), using 9 soil moisture scenarios and two different crops on arable areas. When considering the last 35 years of rainfall records at the Myjava meteorological station, three storm rainfall events were applied in the modeling. The results were statistically analyzed to figure out the differences between the model’s functional possibilities; the modeling under the various scenarios proved a strong interaction between the values of the input factors and the results of the soil erosion.
Keywords: Erosion modeling, Physically-based 3D model, Event-based modeling
1. Introduction
Soil erosion is a natural phenomenon resulting from the removal of topsoil by natural factors as wind and water that transport material elsewhere; it is strongly accelerated by human activity. Soil erosion occurs at relatively low and widely varying rates from year to year and from location to location and cannot be completely eliminated by any measures or interventions. Nevertheless, it is necessary to reduce its intensity and impact [1], [2], [3]. The practical measurement of soil erosion is quite difficult and there are many problems associated with erosion monitoring. That is the reason why the Geographic Information System (GIS) and remote sensing data have
been extensively used for mapping soil erosion, together with the modeling of erosion and erosion-accumulation processes [4], [5], [6].
Physically-based models take into account the spatial variability of land use and hydrological processes and estimate soil loss based on physical laws on a watershed scale [7], [8]. A physical model can overcome many defects of empirical models because of the use of parameters that have a physical interpretation [9]. Physical-based models are designed to calculate soil erosion through mathematical and physical equations; they should be able to calculate actual processes more accurately [10], [11].
In this paper, the physically-based EROSION-3D (E-3D) erosion model has been used for calculations in the Myjava Hill Land in the western part of Slovakia. This model has been developed since 1995 by Michael von Werner at the Department of Geography, Georg August University Goettingen in Berlin [12]. The model is able to predict the amounts of soil erosion and deposition from both a single extreme rainstorm and a series of numerous rainfall events that occur within a longer period like one year or a decade. The model simulates surface runoff, erosion, deposition and the volume and concentration of eroded sediment for single erosion events as a function of time and space [13].
Much research has been conducted at the Myjava Hill Land, because this area represents an appropriate region for the interconnection of historical and current records of erosion processes, together with the application of GIS technologies [14]-[18].
Erosion processes have been occurring since the late 16th century, thanks to the rapid settlement of this region, together with the rapid transformation of the landscape from forest to farmlands [2]. Also, the geological situation (flysch with predominant marls and layers of fine-grained conglomerates), condition of the relief (deep valleys with relatively steep slopes), and variable agricultural management (from small fields with different kinds of crops to large fields with one crop), make this land vulnerable to intensive erosion and soil degradation.
The main scope of this paper is to present a new approach for modeling the soil water erosion in the small catchments in the Myjava Hill Land, using the physically- based E-3D erosion model. Three rainfall events that were observed at the Myjava meteorological station were used to determine the role of variable rainfall amounts and their duration, as well as the impact of extreme rainfall events on the erosion processes.
The possible effect of different land cover types together with the physical-geographical conditions of the research areas was discussed.
2. Study site
Two small catchments (Turá Lúka and Svacenický creek), which are situated in the Myjava Hill Land in the western part of Slovakia, have been analyzed in this study (Fig. 1). The Myjava Hill Land is known for its quick runoff response, when soil water erosion is the dominant soil threat. Turá Lúka is composed of a small watershed that drains approximately 0.3 km2 of the agricultural land. A permanent gully with a length of about 300 m is located in the middle of the study area. The Svacenický creek catchment is located very close to Turá Lúka and has similar physical-geographic conditions. However, the total area is 6.3 km2 with variable land use, and the entire
catchment is drained by several streams. The climate of both areas is represented by mild winters and warm summers with a continental, warm, and moderately humid climate. The mean annual air temperature is about 8.8 °C, and the mean annual precipitation is between 650 to 700 mm.
Fig. 1. Location of study sites
3. Methods
3.1. EROSION-3D model
The concept used in E-2D was developed by Schmidt in 1991 at the Department of Geography at the Free University of Berlin. This concept has been developed and implemented in the E-3D model by Michael von Werner since 1995 [12].
These physically and event-based models represent a suitable tool for estimating erosion processes resulting from natural rainfall. The models calculate the amount and direction of overland flows by taking into account the slope and the exposition of the land surface [3], as well as characteristics deposition, the volume and concentration of sediment, total erosion, net erosion, etc. The infiltration rate is estimated by an infiltration sub-routine based on the approach of Green and Ampt [19].
The main difference between the E-2D and E-3D models is in a spatial interpretation. The E-2D simulates soil erosion on a slope profile and can be applied to slopes of any length. The E-3D model works with a digital elevation model in the form of a square grid. Both models have been analyzed and validated during comprehensive
rainfall simulation studies, which were carried out on agricultural land in Saxony from 1992 to 1996 [12].
3.2. Input data
A digital elevation model was used with a spatial resolution of 10 x10 m (provided by Esprit spol. s. r.o. in 2005) for both study sites. The input parameters are summarized in Table I and Table II. The soil input parameters were taken from a parameter catalogue that quantifies the Slovak soil system [20].
Table I
Summary of input soil parameters to EROSION-3D model (part 1)
Soil parameter [Units]
June August
Fallow Silage corn
Winter
wheat Fallow Silage corn
Winter wheat Bulk density [kg/m3] 1250 1339 1497 1250 1449 1497 Initial moisture content [%] 10-50 10-50 10-50 10-50 10-50 10-50 Organic carbon content [%] 1.100 1.473 1.473 1.100 1.473 1.473 Erodibility [N/m2] 0.0003 0.0009 0.0083 0.0003 0.0014 0.073 Roughness [s/m1/3] 0.032 0.015 0.0053 0.032 0.023 0.100
Cover [%] 0 12 87 0 82 84
Skin factor [-] 1 1 1 1 1 1
Table II
Summary of input soil parameters to EROSION-3D model (part 2)
Grain size distribution [%] Clay Silt Sand
FC MC CC FS MS CS FS MS CS
Loam 1 10 1 1 36 1 1 48 1
Note: FC - fine clay; MC - medium clay; CC - coarse clay; FS - fine silt; MS - medium silt;
CS - coarse silt; FS - fine sand; MS - medium sand; CS - coarse sand
The calculations were performed for three storm rainfall events, which were the most extreme rainfall events occurring during the time period of 1995-2017 (Fig. 2).
The two rainfall events were from 2008 and one from 1999. The first one occurred on 15.8.2008 with a total rainfall amount of 22.5 mm and duration of 50 minutes. The second one occurred on the same day with a rainfall amount of 16.3 mm for 20 minutes, and the last one on 8.6.1999 was an 80 minutes rainfall event with 18 mm of rain.
In order to estimate the variability and dynamic character of the soil erosion processes among different field management practices, three crops (fallow without vegetation cover, winter wheat, and corn) were chosen. Because the most temporal and spatially unstable parameter is represented by the initial soil moisture, nine soil moisture scenarios were created that considered one fallow and two crop types and three rainfall scenarios.
Fig. 2. The variability of the selected extreme rainfall events
4. Results
The modeling of the soil water erosion in the two small catchments was calculated using the E-3D model. The evaluation of the soil erosion was based on nine scenarios of the initial soil moisture, and one fallow and two different types of crop, i.e. silage corn and winter wheat. The results show the relationship between the soil conditions and soil water erosion, which also corresponds to the relief and precipitation. Nevertheless, the model was not able to calculate any processes until the initial soil moisture reached 30%. Before the moisture reached 30%, the whole rainfall amount saturated the catchment. The model is also able to calculate the full water capacity for each land cover. In this case, the results showed no changes in the calculated values, when the soil was fully saturated.
The total surface runoff was mainly generated in both catchments when the initial soil moisture exceeded 35% (Table III, Table IV and Table V). The winter wheat was exposed to the greatest amount of runoff in both study areas (90% of the rainfall was drained), in contrast with the fallow land, which had the lowest values (almost 50% of the rainfall saturated the catchments). The second rainfall scenario resulted in the highest surface runoff in both catchments; thanks to the extreme character of this rainfall event (i.e. almost 100% of the rainfall was drained in Turá Lúka in the case of the winter wheat).
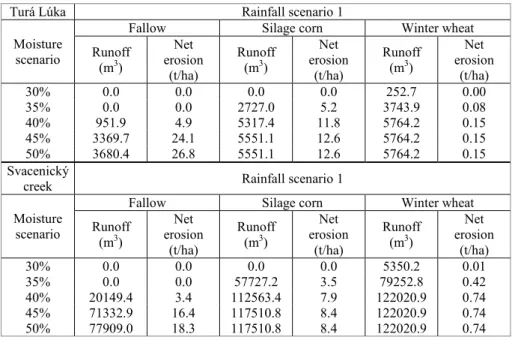
Table III
Results of EROSION-3D model for the rainfall scenario 1 and both catchments
Turá Lúka Rainfall scenario 1
Moisture scenario
Fallow Silage corn Winter wheat
Runoff (m3)
Net erosion
(t/ha)
Runoff (m3)
Net erosion
(t/ha)
Runoff (m3)
Net erosion
(t/ha)
30% 0.0 0.0 0.0 0.0 252.7 0.00
35% 0.0 0.0 2727.0 5.2 3743.9 0.08
40% 951.9 4.9 5317.4 11.8 5764.2 0.15
45% 3369.7 24.1 5551.1 12.6 5764.2 0.15
50% 3680.4 26.8 5551.1 12.6 5764.2 0.15
Svacenický
creek Rainfall scenario 1
Moisture scenario
Fallow Silage corn Winter wheat
Runoff (m3)
Net erosion
(t/ha)
Runoff (m3)
Net erosion
(t/ha)
Runoff (m3)
Net erosion
(t/ha)
30% 0.0 0.0 0.0 0.0 5350.2 0.01
35% 0.0 0.0 57727.2 3.5 79252.8 0.42
40% 20149.4 3.4 112563.4 7.9 122020.9 0.74
45% 71332.9 16.4 117510.8 8.4 122020.9 0.74
50% 77909.0 18.3 117510.8 8.4 122020.9 0.74
Table IV
Results of EROSION-3D model for the rainfall scenario 2 and both catchments
Turá Lúka Rainfall scenario 2
Moisture scenario
Fallow Silage corn Winter wheat
Runoff (m3)
Net erosion
(t/ha)
Runoff (m3)
Net erosion
(t/ha)
Runoff (m3)
Net erosion
(t/ha)
30% 0.0 0.0 1416.3 2.8 1999.0 0.05
35% 724.6 4.3 3102.2 8.6 3534.3 0.13
40% 2432.1 23.1 4264.4 13.6 4450.7 0.18
45% 3599.1 40.1 4379.6 14.1 4450.7 0.18
50% 3756.1 42.6 4379.6 14.1 4450.7 0.18
Svacenický
creek Rainfall scenario 2
Moisture scenario
Fallow Silage corn Winter wheat
Runoff (m3)
Net erosion
(t/ha)
Runoff (m3)
Net erosion
(t/ha)
Runoff (m3)
Net erosion
(t/ha)
30% 0.0 0.0 29980.2 1.9 42317.3 0.26
35% 15338.7 2.9 65670.3 5.8 74816.2 0.60
40% 51484.8 15.6 90272.0 9.1 94215.0 0.84
45% 76187.7 27.0 92711.5 9.4 94215.0 0.84
50% 79511.0 28.7 92711.5 9.4 94215.0 0.84
Table V
Results of EROSION-3D model for the rainfall scenario 3 and both catchments
Turá Lúka Rainfall scenario 3
Moisture scenario
Fallow Silage corn Winter wheat
Runoff (m3)
Net erosion
(t/ha)
Runoff (m3)
Net erosion
(t/ha)
Runoff (m3)
Net erosion
(t/ha)
30% 0.0 0.0 0.0 0.0 0.0 0.00
35% 0.0 0.0 0.0 0.0 2456.9 1.64
40% 420.5 1.8 2104.5 7.6 4347.2 3.45
45% 2354.8 17.1 3368.8 14.6 4347.2 3.45
50% 2601.5 19.3 3368.8 14.6 4347.2 3.45
Svacenický
creek Rainfall scenario 3
Moisture scenario
Fallow Silage corn Winter wheat
Runoff (m3)
Net erosion
(t/ha)
Runoff (m3)
Net erosion
(t/ha)
Runoff (m3)
Net erosion
(t/ha)
30% 0.0 0.0 0.0 0.0 0.0 0.00
35% 0.0 0.0 17033.4 1.3 52009.3 1.09
40% 8901.4 1.2 64923.3 8.6 92025.3 2.29
45% 49847.1 11.5 81378.1 11.3 92025.3 2.29
50% 55070.3 13.3 81378.1 11.3 92025.3 2.29
Table III, Table IV and Table V compare the results calculated for the three rainfall events and the five initial soil moisture scenarios (30-50%), together with the fallow land and the two crops. It is obvious that there is a relationship between the initial soil moisture and the results modeled, which is described by a polynomial function with a high degree of the correlation (the correlation coefficient is higher than 0.9, which is significant with p=0.05). The values are increasing according to the graduated initial soil moisture. The results confirmed that the erosion processes were intensive for the fallow land, especially during the second rainfall event. The net erosion in Turá Lúka ranges from 4.3 (35% of the initial soil moisture) to 42.6 tons per hectare (50% of the initial soil moisture), and the winter wheat land cover type could mostly reduce the effect of the erosion. The intensity of the net erosion in the Svacenický creek catchment is in a range from 2.9 (35% of the initial soil moisture) to 28.7 tons per hectare (50% of the initial soil moisture) for the fallow land and the second rainfall event.
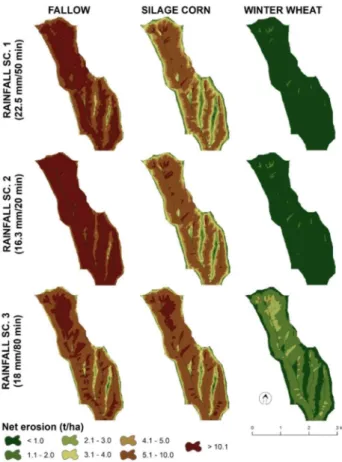
The results of the 3D model are presented in the maps with the spatial variability of the soil erosion in both catchments are plotted in Fig. 3 and Fig. 4. The intensity of the net erosion (the difference between the total erosion and deposition) was very high in the middle of the Turá Lúka catchment. The permanent gully and an intermittent stream are located in this part of the catchment. The erosion processes were much higher in the case of the fallow land (higher than 30 tons per hectare), which had been expected, and the winter wheat rapidly decreased the effect of the erosion in the catchment. The results also confirmed the extreme character of the second rainfall event, which corresponded to the highest values of the net erosion. Similar results were obtained for
Svacenický creek. The highest intensity of the erosion processes was located in the upper part and partly in the middle of the catchment. The second rainfall event also resulted in extreme erosion processes, and together with the fallow land, the intensity approached 80 tons per hectare in their effect on vulnerable locations.
Fig. 3. The intensity of the net erosion in the Turá Lúka catchment
5. Discussion
The vulnerability of the Myjava Hill Land to intensive erosion processes, e.g. rill and gully erosion, which was confirmed by the results [2]. The map of the potential water erosion [21], which was developed by the Soil Science and Conservation Research Institute, shows little or no erosion on the hilltops and ridges (0-4 t/ha/yr), and high erosion (10-30 t/ha/yr) or extreme erosion (more than 30 t/ha/yr) located on the hill slopes in both study areas. The results show the similar spatial variability of the erosion processes, but the total values of the modeled parameters are much higher. However, it
is crucial to note that our calculations were performed for specific rainfall events and are not incomparable with long-term calculations.
Fig. 4. The intensity of the net erosion in the Svacenický creek catchment
The results show a strong dependence between the soil condition and potential soil water erosion, which also corresponds to the relief and precipitation. The model is very sensitive to the initial soil moisture content, which was confirmed by the results [12].
The strong relationship between the initial soil moisture and calculated parameters were found out. The soil erosion rate in the catchment is sensitive to rainfall and that the daily rainfall is an especially good indicator of the variations in the rate of soil erosion [22], [23]. The three different rainfall events indicated that a rainfall of a short duration and a relatively large amount of precipitation can cause the most intensive erosion. The importance of detailed information about the characteristics of a rainfall are very important, i.e. an extreme rainfall event [24], [25], [26], [27].
The results show significant deviations between the erosion of the fallow land, silage corn and winter wheat. In both of chosen case studies, the winter wheat can strongly decrease the intensity of erosion processes. Fallow land is very harmful in
terms of erosion processes, especially in parts with a high surface angle (e.g. the upper part of the Svacenický creek catchment). The significance of the slope conditions has also been confirmed by several authors [28], [29]. The difference between the fallow land, silage corn and winter wheat is based on variable input data from the parameter catalogue. The variability of the inputs is mainly due to the dates of the rainfall events, i.e. June and August, because the values in the parameter catalogue are created for every month. In the case of the winter wheat, the erosion was dramatically reduced during the first and second rainfall events, because the values of erodibility and roughness made the soil more protective against the erosion processes.
It must be note that this presented research is limited to a small study area without direct field measurements of the surface soil erosion. In future research, it will be necessary to model the sediment yield and deposition besides the soil loss and to apply a total sediment load to verify the reliability of the soil loss.
6. Conclusion
EROSION-3D models represent a very good tool for quantifying soil erosion and other characteristics considering the variability of the input data (mainly the soil data set). Most of these data were available as parameter estimates derived from a predefined parameter catalogue. However, for more accurate results it is better to use actual measured data, especially the initial soil moisture, as the most accurate variable soil characteristic.
The results show a significant relationship between the physical-geographical conditions in our study areas, especially the slope gradient, moisture content and soil parameters. Considering the character of the rainfall events, it can be stated that the duration of a particular rainfall event is much more important than the total amount.
Also, the results confirmed that the Myjava Hill Land is very vulnerable to erosion processes.
Acknowledgments
This study was supported by the Slovak Research and Development Agency under the contract No. APVV-15-0425 and No. APVV-15-0497 and VEGA Agency 1/0710/15 and by the European Commission’s Seventh Framework Project RECARE, Contract No. 603498 and by the Specific Research project at Masaryk University (MUNI/A/1251/2017, Integrated research of environmental changes in the landscape sphere III). The authors thank the agencies for their research support.
References
[1] Antal J., Streďanský J., Streďanská A., Tátošová L., Lackóová L. The protection and fertilization of soil, (in Slovak) Slovak University of Agriculture, Nitra, 2013.
[2] Stankoviansky M. Historical evolution of permanent gullies in the Myjava Hill Land, Slovakia, Catena, Vol. 51, 2003, pp. 223‒239.
[3] Kenderessy P. Soil loss assessment in an agricultural landscape and its utilization in landscape planning, Ekológia, Vol. 31, No. 3, 2012, pp. 309–321.
[4] Hofierka J., Šúri M., Cebecauer T., Fulajtár E. Potential and actual soil erosion risk assessment of Slovakia using USLE model and GIS, (in Slovak) Acta Facultatis Studiorum Humanitatis et Naturae Universitatis Prešoviensis, Prírodné vedy, Folia Geographica, 2001.
[5] Sotiropoulou A. M., Alexandridis T., Bilas G., Karapetsas N., Tzellou A., Silleos N., Misopolinos,N. A user-friendly GIS model for the estimation of erosion risk in agricultural land using the USLE, Proceedings of the International Conference on Information and Communication Technologies for Sustainable Agri-production and Environment, Skiathos, Greece, 8-11 September, 2011, pp. 795‒801.
[6] Vysloužilová B., Kliment Z. Soil erosion and sediment deposition modeling on a small catchment scale, Geografie, Vol. 2, 2012, pp. 170‒191.
[7] Schindewolf M. Schmidt J. Parameterization of the EROSION 2D/3D soil erosion model using a small-scale rainfall simulator and upstream runoff simulation, Catena, Vol. 91, 2012, pp. 47-55.
[8] Wheater H. S., Jakeman A. J., Beven K. J. Progress and directions in rainfall-runoff modeling, Modeling Change in Environmental Systems, 1993, pp. 101–132.
[9] Abbott M. B., Bathurst J. C., Cunge J. A., O’connell P.E., Rasmussen J. An introduction to the European Hydrological System - Systeme Hydrologique Europeen, “SHE”, 1: History and philosophy of a physically-based, distributed modeling system, Journal of Hydrology, Vol. 87, No. 1-2, 1986, pp. 45‒59.
[10] Bhuyan S. J., Kalita P. K., Janssen K. A., Barnes P. L. Soil loss predictions with three erosion simulation models, Environmental Modeling and Software, Vol. 17, 2002, pp. 137‒146.
[11] Nearing M. A., Jetten V., Baffaut C., Cerdan O., Couturier A., Hernanez M., Bissonnais Y.
L., Nichols M. H., Nunes J. P., Renschler C. S., Souchere V., Van Oost, K. Modeling response of soil erosion and runoff to changes in precipitation and cover, Catena, Vol. 61, 2005, pp. 131‒154.
[12] Werner M. Erosion-3D, User manual, Ver. 3.1.1, Berlin, Geognostics, 2006.
[13] Weigert A., Wenk G., Ollesch G. Fritz H. Simulation of snowmelt erosion using the EROSION 3D model, Journal of Plant Nutrition and Soil Science, Vol. 166, No. 6, 2003, pp. 128–130.
[14] Bučko Š. Regionalisation of accelerated water erosion in the lowland relief of south- western Slovakia (in Slovak), Geografický časopis, Vol. 24, 1972, pp. 143‒151.
[15] Gajdová J. The impact of the erosion processes in an agricultural landscape on the water quality in the water body, Project 514-78 VTP: The research of fresh water management and environmental aspects of water bodies, Water Research Institute, Bratislava, 1999.
[16] Stankoviansky M., Koco Š., Pecho J., Jenčo M., Juhás J. Geomorphic response of dry volley basin to large-scale land use changes in the second half of the 20th century and problems with its reconstruction, Moravian Geographical Reports, Vol. 16, No. 4, 2008, pp. 11‒24.
[17] Nosko R., Výleta R., Fraštia M., Škrinár A., Danáčová M. Estimation of changes in erosion gully on a hillslope, SGEM 2016, 16th International Multidisciplinary Scientific GeoConference, Book 3, Vol. 3, Water Resources, Forest, Marine and Ocean Ecosystems:
conference proceedings, Extended scientific sessions, Vienna, Austria, 2-5 November 2016, pp. 95‒102.
[18] Výleta R., Celler M., Danáčová M. Efect of erosion control on water erosion and sediment transport in the cadastre unit of Sobotište, Czech Journal of Civil Engineering, Vol. 2, No. 2, 2016, pp. 162‒168.
[19] Green W. H., Ampt G. Studies of soil physics, part I, the flow of air and water through soils, Journal of Agricultural. Sciences, Vol. 4, 1911, pp. 1‒24.
[20] Németová Z., Honek D. Application of a physically-based erosion model in a small catchment of the Myjava river basin, Proceedings of the 29th conference of the Young Hydrologists, Bratislava, Slovakia, 9-11 November 2017, pp. 1‒13.
[21] The map of the potential water erosion, Soil Science and Conservation Research Institute, http://www.podnemapy.sk/erozia/viewer.htm?activelayer=0, (last visited 20 December 2017).
[22] Jain S. K., Kumar S., Varghese J. Estimation of soil erosion for a Himalayan watershed using GIS technique, Water Resources Management, Vol. 15, No. 1, 2001, pp. 41‒54.
[23] Dabral P. P., Baithuri N., Pandey A. Soil erosion assessment in a hilly catchment of North Eastern India using USLE, GIS and remote sensing, Water Resources Management, Vol. 22, No. 12, 2018, pp. 1783‒1798.
[24] Gaál L., Molnár P., Szolgay J. The effect of precipitation corrections on the dependence structure of storm characteristics, Urban challenges in rainfall analysis: 9th International Workshop on Precipitation in Urban Areas, St. Moritz, Switzerland, 6-9 December 2012, pp. 1-12.
[25] Molnár P., Fatichi S., Gaál L., Szolgay J., Burlando P. Storm type effects on super Clausius-Clapeyron scaling of intense rainstorm properties with air temperature, Hydrology and Earth System Sciences, Vol. 19, No. 4, 2015, pp. 1753‒1766.
[26] Pindjaková T., Kelčík S., Šoltész A. Simulation of flood progress on the River Gidra, Pollack Periodica, Vol. 11, No. 1, 2016, pp. 25‒34.
[27] Janík A., Šoltész A. Flash flood mitigation modeling - case study small Carpathians, Pollack Periodica, Vol. 12, No. 2, 2017, pp. 103‒116.
[28] Demirci A., Karaburun A. Estimation of soil erosion using RUSLE in a GIS framework: a case study in the Buyukcekmece Lake watershed, northwest Turkey, Environmental Earth Science, Vol. 66, No. 3, 2012, pp. 903‒913.
[29] Csáfordi P., Podor A., Bug J., Gribovszki Z. Soil erosion analysis in a small forested catchment supported by ArcGIS model builder, Acta Silvatica & Lignaria Hungarica, Vol. 8, 2012, pp. 39‒55.