MŰHELYTANULMÁNYOK DISCUSSION PAPERS
INSTITUTE OF ECONOMICS, CENTRE FOR ECONOMIC AND REGIONAL STUDIES, HUNGARIAN ACADEMY OF SCIENCES - BUDAPEST, 2019
MT-DP – 2019/8
Job loss, disability insurance and health expenditures
ANIKÓ BÍRÓ – PÉTER ELEK
Discussion papers MT-DP – 2019/8
Institute of Economics, Centre for Economic and Regional Studies, Hungarian Academy of Sciences
KTI/IE Discussion Papers are circulated to promote discussion and provoque comments.
Any references to discussion papers should clearly state that the paper is preliminary.
Materials published in this series may subject to further publication.
Job loss, disability insurance and health expenditures
Authors:
Anikó Bíró senior research fellow
“Lendület” Health and Population Research Group
Institute of Economics, Centre for Economic and Regional Studies, Hungarian Academy of Sciences
biro.aniko@krtk.mta.hu
Péter Elek assistant professor Department of Economics Eötvös Loránd University (ELTE)
peter.elek@tatk.elte.hu
March 2019
Job loss, disability insurance and health expenditures
Anikó Bíró – Péter Elek
Abstract
We analyse the causal effect of job loss on disability insurance enrolment on a five-year horizon and the implications on health expenditures. Using individual level administrative panel data from Hungary, we follow individuals displaced due to a mass lay-off and compare their labour force status to non-laid-off individuals with similar employment and health history, chosen with propensity score matching. According to our estimates, being laid off increases the transition probability to disability by 50% (or 1.4% points) in four years, and half of the excess transitions occur within the first year. We find a greater than average effect among older individuals and those who were in worse health before.
Outpatient, inpatient and pharmaceutical expenditure increases 3.5−4 times when a laid-off individual takes up disability benefit, and decreases slightly afterwards, but does not reach the pre-disability levels. This health expenditure pattern resembles that observed around the diagnosis of previously undetected chronic diseases, such as diabetes or hypertension, but genuine health shocks may also be present. The increase in health expenditure corresponds to 20-25% of the additional disability payments in the medium term.
JEL: C23, I12, I38, J63
Keywords: administrative panel data, disability insurance, displacement, health expenditures
Acknowledgements
Anikó Bíró and Péter Elek were supported by the Momentum ("Lendület") programme of the Hungarian Academy of Sciences (grant number: LP2018-2/2018). Data for Appendix D were provided in the framework of Hungarian National Research and Innovation Office (NKFIH) Grant No. 120545. The authors would like to thank Márton Csillag, Judit Krekó, Attila Lindner, Dániel Prinz, Ágota Scharle, Balázs Váradi, seminar participants at The University of Edinburgh, at the Institute of Economics of the Hungarian Academy of Sciences, at the Szirák labour market conference and at the annual conference of the Hungarian Economic Association for their useful comments.
Állásvesztés, rokkantnyugdíj és egészségügyi kiadások
Bíró Anikó – Elek Péter
Összefoglaló
Ötéves időtávon vizsgáljuk az állásvesztés rokkantnyugdíjazásra kifejtett hatását és összefüggését az egészségügyi kiadásokkal. Magyarországi egyéni szintű adminisztratív paneladatokat használva követjük a csoportos létszámleépítések keretében elbocsátott munkavállalókat, és hozzájuk munkapiaci és egészségügyi előtörténetben hasonló, ám nem elbocsátott dolgozókat párosítunk propensity score alapú eljárással. Becslésünk szerint az elbocsátás 50%-kal (illetve 1,4 százalékponttal) növeli a rokkantnyugdíjazás valószínűségét négy év alatt. A rokkantnyugdíjazási többlet mintegy fele az elbocsátás utáni első évben jelentkezik. Átlagosnál erősebb hatást mérünk az idősebbek és a korábban rosszabb egészségi állapottal rendelkezők körében.
Az elbocsátottak járóbeteg-, fekvőbeteg- és gyógyszerkiadásai 3,5–4-szeresükre emelkednek a rokkantnyugdíjazáskor, és enyhén csökkennek utána, de nem érik el a kiindulási értékeiket.
Ez a kiadási mintázat hasonlít a krónikus betegségek, például a diabétesz vagy a magas vérnyomás diagnózisakor megfigyelhető mintázathoz, de nem zárható ki tényleges egészségügyi sokkok jelenléte sem. Középtávon az egészségügyi kiadások növekedése a megnövekedett rokkantnyugdíj-kifizetések 20-25%-át teszi ki.
JEL: C23, I12, I38, J63
Tárgyszavak: adminisztratív paneladatok, rokkantnyugdíj, elbocsátás, egészségügyi kiadások
Job loss, disability insurance and health expenditures
Anik´ o B´ır´ o
∗1and P´ eter Elek
†1,21Institute of Economics, Centre for Economic and Regional Studies of the Hungarian Academy of Sciences, “Lend¨ulet” Health and Population Research Group
2E¨otv¨os Lor´and University (ELTE), Budapest, Hungary
March 2019
Abstract
We analyse the causal effect of job loss on disability insurance enrolment on a five-year horizon and the implications on health expenditures. Using individual level administrative panel data from Hungary, we follow individuals displaced due to a mass lay-off and compare their labour force status to non-laid-off individuals with similar employment and health history, chosen with propensity score matching. According to our estimates, being laid off increases the transition probability to disability by 50%
(or 1.4% points) in four years, and half of the excess transitions occur within the first year. We find a greater than average effect among older individuals and those who were in worse health before.
∗E-mail: biro.aniko@krtk.mta.hu
†E-mail: peter.elek@tatk.elte.hu
Outpatient, inpatient and pharmaceutical expenditure increases 3.5−4 times when a laid-off individual takes up disability benefit, and decreases slightly afterwards, but does not reach the pre-disability levels. This health expenditure pattern resembles that observed around the diagnosis of previously undetected chronic diseases, such as diabetes or hypertension, but genuine health shocks may also be present. The increase in health expenditure corresponds to 20−25% of the additional disability payments in the medium term.
Keywords: administrative data; disability insurance; displacement; health expen- ditures
JEL codes: C23; I12; I38; J63
Acknowledgments: Anik´o B´ır´o and P´eter Elek were supported by the Momentum (“Lend¨ulet”) programme of the Hungarian Academy of Sciences (grant number: LP2018- 2/2018). Data for Appendix D was provided in the framework of the Hungarian National Research and Innovation Office (NKFIH) Grant No. 120545. The authors would like to thank M´arton Csillag, Judit Krek´o, Attila Lindner, D´aniel Prinz, ´Agota Scharle, Bal´azs V´aradi, seminar participants at The University of Edinburgh, at the Institute of Economics of the Hungarian Academy of Sciences, at the Szir´ak labour market conference and at the annual conference of the Hungarian Economic Association for their useful comments.
1 Introduction and related literature
The aims of this paper are twofold: to estimate the extent to which displaced workers substitute non-employment with participation in social programmes for the disabled, and to estimate the implications of the transition to disability benefit status due to job loss on health expenditures.
The high share of working-age individuals receiving disability benefits is a major social and economic problem in many developed countries. Liebman [2015] documents a substantial increase in the share of disability insurance recipients within the working-age population in the United States, rising from 2.2% in the late 1970s to 4.6% in 2013. Banks et al. [2015]
report for Great Britain that the number of disability recipients more than doubled from the 1970s to 2013. According to OECD statistics, 5.6% of the working age population in OECD countries received disability benefits in 2007 (the middle of our examined period), with much higher than average rates in Hungary (12%), Sweden, Norway, Finland and the Netherlands (8−11%) (OECD, 2009, Figure 4.1). To make the problem more severe, very few recipients of disability benefits return to the labour market.
Consequences on government expenditures are substantial. According to Eurostat, spend- ing on disability benefits amounted to 1.9% of GDP in the European Union (EU27) in 2007, of which 1.4% were cash benefits and 0.9% of GDP was disability pension. In most OECD coun- tries these expenditures are much larger than expenditures on any other income-replacement programme for working-age individuals [OECD, 2009]. It is, thus, of great policy importance to understand and potentially reduce the employment-related channels of disability claims.
Such reductions can not only increase the employment rate of the working-age population,
but can also have beneficial effects on the public health care budget – a previously undocu- mented aspect, which is the focus of our analysis.
We know from previous literature that job loss has a lasting negative effect on future labour market position (B¨oheim and Taylor, 2002, Eliason and Storrie, 2006) and a particu- larly scarring effect on consecutive earnings (Arulampalam, 2001, Gregory and Jukes, 2001, Jacobson et al., 1993, Ruhm, 1991; among many others), but less is known about its effects on the uptake of social security benefits.
If eligible, a displaced worker can claim unemployment benefits. However, once the benefit period expires, the individual either has to return to work or needs to secure other social security benefits so as to receive some income and maintain social insurance status.
Therefore, job loss might influence labour force status through the disability channel. As Autor and Duggan [2003] pointed out, the characteristics of the disability insurance system influence the propensity of labour force exit for workers who faced adverse shocks. The more generous the disability benefit, the more likely it is for workers to exit the labour market.
In line with the results of Autor and Duggan [2003], Rege et al. [2009] and Bratsberg et al.
[2013] show evidence from Norway that job loss significantly increases the risk of disability benefit uptake. Looking at the period of the Great Recession, both Maestas et al. [2015]
and Jim´enez-Mart´ın et al. [2018] find that the recession had an increasing effect on disability applications, but due to the increased rate of denials, there is no clear effect on the stock of disability benefit recipients. Scharle [2008] shows on county-level data in Hungary that local labour market conditions are correlated with disability insurance claims.
Our first aim in this paper is to estimate the causal effect of job loss on disability insurance enrolment using individual-level administrative data from Hungary between 2003 and 2011.
To overcome the endogeneity of job loss, we exploit mass lay-offs and match laid-off to non- laid-off workers with propensity score matching. We then follow individuals in the matched sample and obtain that job loss implies a 50% (or 1.4% points) higher transition to disability insurance in four years. Half of the excess transitions occur within the first year, and the transition probability returns to the value in the control group after about three years.
Obviously, the increased transition to disability after a job loss may not only be a re- sult of the altered labour market behaviour described above, but may also stem from gen- uine health shocks associated with unemployment. Disentangling the two channels is not straightforward, even if data on healthcare use or health expenditures is available, because non-employment may affect the demand for health services through various pathways.
First, unemployment and inactivity may have direct health effects, although the literature on it is mixed (see e.g. Browning et al., 2006 and Schmitz, 2011 for non-significant results;
Schaller and Stevens, 2015 for negative average effects and Schiele and Schmitz, 2016 for negative effects on those in initial bad health). Second, even if health status is constant, non-employment may reduce health care use because of the decreased incentives for health maintenance and possibly because of a change in insurance status. Kuhn et al. [2009] and Schaller and Stevens [2015] find little evidence for an effect of job loss on healthcare use.
However, Schaller and Stevens [2015] find that doctoral visits and prescription drug usage decrease if the lost job was the primary source of insurance.
In particular, the application for and maintenance of disability benefit may have pro- found, time-varying impact on healthcare use. At the time of the application, healthcare use may increase because of the expanded incentives for being diagnosed with various chronic conditions, and also because of the need to check health status during the review process.
Afterwards, receiving disability benefit may reduce incentives for health maintenance, thus lowering healthcare use.
We are not familiar with studies in the literature that would analyse the relationship between health expenditures – a measure of healthcare use – and the uptake of disability benefits due to job loss. This is the second aim of our paper.
According to our results, claiming disability benefit after being laid off is associated with a 3.5−4-fold surge in health expenditure. Although the expenditure declines after the uptake of the benefit, it does not reach its pre-disability levels. We do not observe specific health conditions in our database, but in other individual-level administrative datasets we find that the diagnosis of chronic diseases, such as diabetes or hypertension, is associated with similar patterns of health expenditure, although with a somewhat smaller (two-fold – three-fold) surge. Overall, the results suggest that the surge in health expenditure around the uptake of disability benefit is due mostly to the diagnosis of chronic diseases, although genuine health shocks may also be present.
2 Institutional background
2.1 Disability and unemployment benefits
The following brief summary of the disability insurance system in Hungary is based on MISSOC [2018], OECD [2012] and Scharle [2011].
Disability insurance in its current form was introduced in 1983. As part of the social security system, disability benefits are paid from the public budget. During the first part of
the analysed period (up to 2008), people with at least 67% incapacity for work could apply for disability pension. The amount of the benefit was influenced by the average wage before disability, the incapacity ratio and the length of the insurance period. The replacement rate typically varied between 40 −65%. Eligibility terminated if the pensioner was no longer incapable of work, or worked on a regular basis, earning an income comparable to what could have been earned in the specific occupation prior to becoming disabled. The evaluation of claims was rather generous. However, as public spending on disability benefits steadily increased, governments began to acknowledge the need for reform. As a result, rehabilitation allowance was introduced in 2008. It is paid to a person with a required number of service years who suffers from 50−79% damage to health (comparable to the 67% incapacity for work in the previous system), is unable to pursue a former job but is capable of rehabilitation.
It is 20% more generous than the disability pension but may be paid only for the necessary period of rehabilitation and for a maximum of three years. Recipients of the allowance have to participate in a comprehensive rehabilitation plan devised by the employment office with a view to recover their work capacity. Those who suffer from at least 50% damage to health, but for whom rehabilitation is not proposed, can apply for disability pension. Our data does not allow us to distinguish between these types of benefits, so we will examine them jointly under the name of ‘disability benefit’.
An application for disability benefit is evaluated by a committee, which considers the social circumstances of the applicant as well as the medical evidence for disability. Thus to prove eligibility, the applicant has to contact physicians to request medical certificates. A similar process exists for the review of eligibility, which occurs every 1−5 years (depend- ing on the condition of the applicant). This implies that the application for and review of
disability both increase health expenditure. In the analysed period, the approval rate of dis- ability insurance applications was around 30% [Central Administration of National Pension Insurance, 2018].
The system of disability insurance was again reformed in 2011, mostly due to the high public payments on disability benefits and to the alleged widespread abuse of the system.
The new, stricter legislation came into effect in 2012, which is outside our observation period.
Since then, disability benefits are no longer considered to be part of the pension system, but rather as a type of sickness allowance.
A major risk of the system is that, despite the screening of applicants for disability benefits, individuals might still use them as a substitute of unemployment benefits. Over the analysed period (between 2003–2011), Hungary had a two-tier unemployment insurance scheme. Unemployment benefit in the first tier depended on the income the year before unemployment, and could be received for, at most, 270 days. After the exhaustion of the first tier of unemployment benefits, the unemployed could receive a flat amount of unem- ployment assistance for an additional 3 months. Afterwards, low-income individuals could claim welfare benefits.
2.2 Healthcare system
The Hungarian healthcare system is a single-payer system, where services are financed from contributions and state subsidies, administered by the National Health Insurance Fund Ad- ministration (NHIFA). The vast majority of individuals – the employees, the unemployed, the pensioners and those on various benefits – are automatically insured (in the case of em-
ployees, the employers are obliged to pay the social insurance contributions for them). So as to remain insured, inactive people not belonging to any of the previous categories have to pay a monthly fee for health insurance coverage: however, those with low income are still exempt from the payment of the fee.
The majority of healthcare services, including both outpatient and inpatient care, do not require co-payments, although informal payments are common for a wide range of services.
People may opt for using private care (which was common only in certain specialties; e.g.
in dental care or gynecology, during the examined period) when they have to pay fee for the services. User fees for medication depend on the amount of subsidies from the NHIFA, which varies greatly across substances. On average, patients have to cover slightly less than half of the price of a medication: the rest is paid by the social security. A more detailed overview of Hungary’s healthcare system is provided by Ga´al et al. [2011].
3 Data
The empirical analysis is based on a unique administrative panel dataset from Hungary. The data covers a random half of the 5−74 years-old population in 2003, who were followed-up until 2011. It was created by linking administrative data from the Hungarian tax authority, the pension and the health authorities, among others.1 In this research, we concentrate on the 35−54 years-old age group, which includes most of the transitions to disability, but excludes the vast majority of old-age pensioners.
1The linked dataset is under the ownership of the Central Administration of National Pension Insurance, the National Health Insurance Fund Administration, the Educational Authority, the National Tax and Customs Administration, the National Labour Office, and the Pension Payment Directorate of Hungary.
The data was processed by the Institute of Economics, Centre for Economic and Regional Studies of the Hungarian Academy of Sciences.
We use various segments of the dataset. Gender, year of birth and settlement of residence (corresponding to year 2003) are recorded for each individual. The labour market and benefit segment contains monthly information on wages, employment, pension and other benefit status. Therefore, we can track on a monthly basis whether an individual was employed, was a pensioner or received unemployment, disability or other benefits. Occupation (ISCO) codes of employment spells are collected for employees (but not for the self-employed). Level of education is not observed but can be approximated for each occupation code (and thus for each individual) as the median education level of workers with the same occupation in the Labour Force Survey (LFS).
The dataset contains firm-level information on employers (such as private or public), and employees of the same firm can be identified. In particular, the size of the firm can be approximated as twice the number of its employees in the sample, although this estimate is not very accurate for micro-firms.
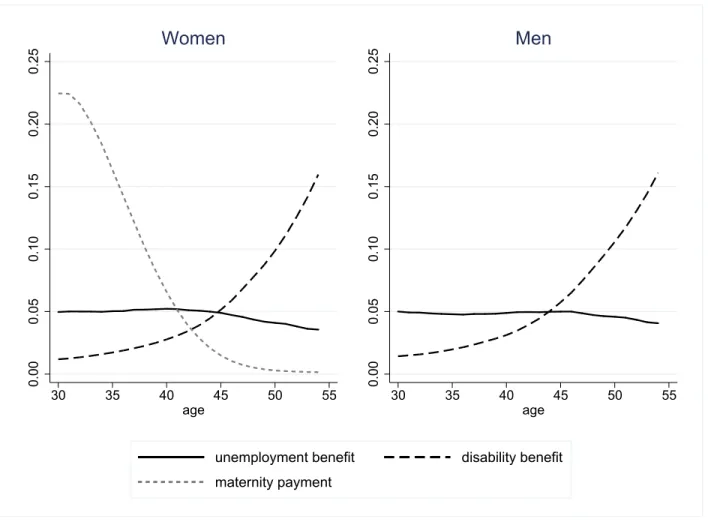
Figure 1 shows the rates of the most important benefits by gender and age. The employ- ment rate (not shown in the figure) is 60−70% for males of the examined ages. Because of maternity, employment rate reaches 60% only among women aged above 35. The ratio of disability benefit recipients increases heavily with age and goes above 10% among those aged 50 and above, while unemployment benefit is received by around 5% of the population at all examined ages. The ratio of old-age pensioners (not shown) is below 3%, even among those aged 50−54.
Health expenditures are observed on the annual level in the dataset. We have information on the annual public expenditures on specialist outpatient care and inpatient care, and on the annual public plus private (out-of-pocket, OOP) expenditures on prescribed pharmaceuticals.
0.000.050.100.150.200.25
30 35 40 45 50 55
age
Women
0.000.050.100.150.200.25
30 35 40 45 50 55
age
Men
unemployment benefit disability benefit maternity payment
Figure 1: Rates of some benefits by gender and age group
Altogether, we track around 60% of total healthcare expenditure in Hungary. The most important excluded items are services provided by general practitioners (GP), and OOP payments on non-prescribed medications and on medical services. Although GP care is not covered by our data, total outpatient care expenditures are reasonably well captured because of the high usage of outpatient specialist care in Hungary (see Elek et al., 2015).
In the main analysis, we will follow the labour market outcomes of those affected by mass lay-off, which we consider as an involuntary job loss. An event is classified as a mass lay-off if the size of the company decreases by at least 30% and remains, at most, at 70% of the original size during the following year. This definition includes company closures as well.
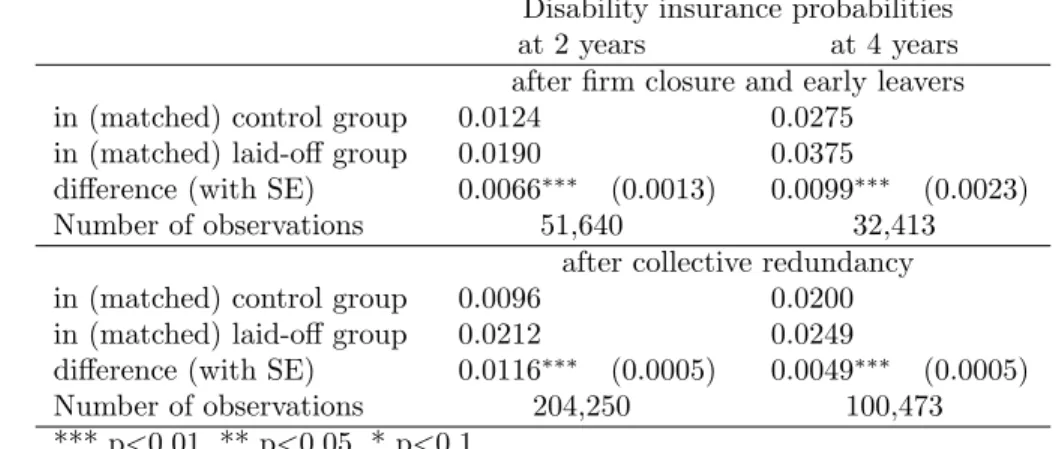
Since the size of micro-firms cannot be determined precisely, due to the 50% sample at our disposal, we examine only the mass lay-offs of companies with at least five employees in the sample (i.e. at least ten employees on average). We exclude those observations concerning mass lay-offs where the firm size decreases by more than 30%, but more than 15% of the employees move to the same employer. In Appendix C, we use two alternative definitions of job loss – company closure (including early leavers) and the official definition of collective redundancy in Hungary. We show that the main results are qualitatively robust to the alternative definitions.
4 Methods
4.1 Mass lay-off and disability benefits
We examine the medium-term effect of involuntary job loss on taking up disability benefits.
We compare disability insurance enrolment of laid-off workers to those non-laid-off workers who were similar in their measured characteristics at the time of lay-off. Similarity is defined in terms of the variables of Table 1, which contains calendar time, individual demographic characteristics (gender, age, region, settlement type), characteristics of the current job (firm size, occupation2), history of labour market and benefit status in the last 24 months, history of health expenditures and sick leave in the last two calendar years (but not including the current year) and the change in size of the employee’s firm in the last two years.
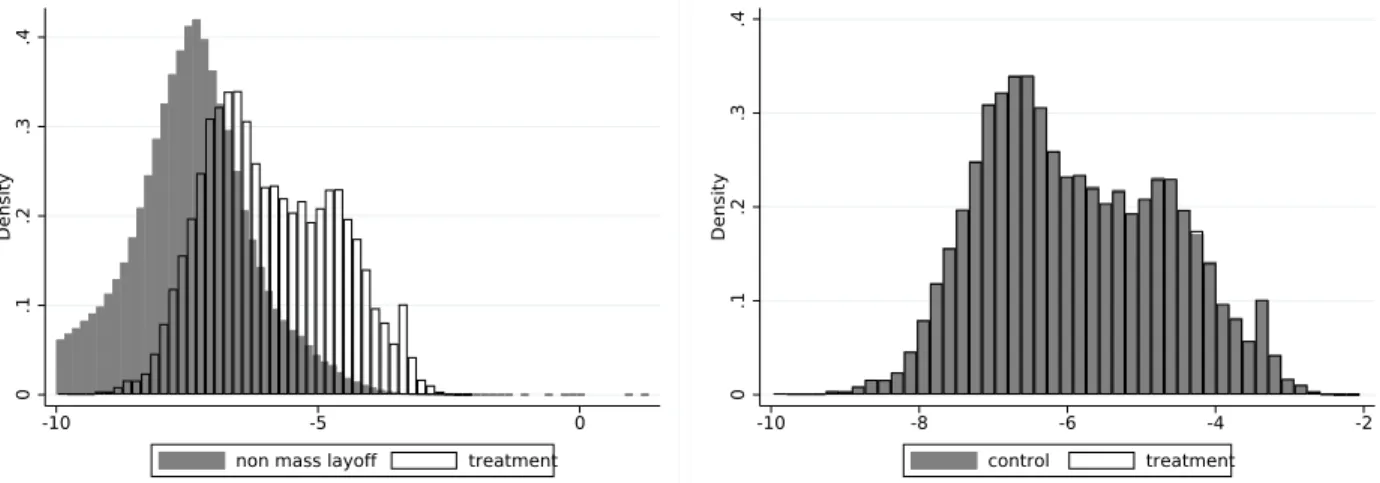
We perform 1:1 nearest neighbour propensity score matching, using a logit model with the above variables. Following, for example, Austin [2011], a caliper of 0.2 standard deviation of
2A detailed occupational (ISCO-based) classification with 34 items, not shown in the Table, is used.
the logit score is enforced to exclude matches that are far from a laid-off worker in treatment propensity.3 Exact matching is conducted on gender and monthly date, and matching is performed without replacement on the individual basis; i.e. if a person is chosen in the control group, then she/he will not be chosen again at a later date. The last column of Table 1 shows that the laid-off and the matched control sample are sufficiently similar to each other with respect to the examined variables, the standardized differences4 being below 7% (0.07) in all cases, less than the 0.10 difference treated as an appropriate balance in propensity score studies (e.g. Austin, 2009). Figure A1 in the Appendix also confirms that the estimated propensity scores are balanced in the treatment (lay-off) and the matched control group.
We follow both the stock of disability benefit recipients and the transition rate to dis- ability in the matched laid-off vs. control groups. Let t = 0 denote the time of inclusion into the sample.5 We first compare the probabilities of receiving disability benefit in the two groups at t = 24 and t = 48 months, respectively. Then, to measure heterogenous lay-off effects, we estimate linear probability models where the lay-off dummy is interacted with individual characteristics such as gender, level of education, age group, region specific unem- ployment rate (measured att = 0) and – to capture baseline health status – the dummy for hospitalization in the last year before t= 0. Third, we compare the three-month transition probabilities to disability in the two groups at each quarter beforet = 60 months.
3This adjustment affects only 4% of the treated sample; hence Table 1 does not display descriptive statistics separately on the laid-off and the matched laid-off sample.
4The standardized difference is obtained by dividing the mean difference with the standard deviation of the variables. The latter is approximated as the square root of the average of the two individual variances.
5Hencet= 0 denotes the time of lay-off in the treated group. In the control group it does not correspond to a particular event but only indicates a time point when the history of the control person is very similar to her/his matched treated counterpart.
4.2 Health expenditures
We investigate the time pattern of health expenditures of displaced workers who became disabled 1−12; 13−24; 25−36 or 37−48 months after the job loss. Due to the non- negligible fraction of zero expenditures (i.e. of not using the given category of healthcare at all in a given year) and to the high skewness of the expenditure distributions, we analyse the probability of positive (non-zero) expenditures and the logarithm of the positive expenditures separately, in a two-part (hurdle) model setting, for three expenditure categories (outpatient, inpatient and prescribed pharmaceutical expenditures).
First, we compare the time patterns to a control group, which consists of the matched (1:1) control pairs of those laid-off workers who later became disabled. This way, we can identify the dynamics of health expenditure shocks that eventually lead to disablement.
Second, we conduct an event study analysis. We regress, in a fixed-effects setting, the annual health expenditure measures on the years elapsed since (or before) the uptake of disability benefit within the sample of laid-off individuals receiving disability benefit:
his =η0+X
k6=0
ηkDis(k)+ci+ξs+uis, (1)
where i denotes the individual, s the calendar time in years, his is the indicator of health expenditures (binary indicator of positive expenditures or the logarithmic value of positive expenditures),D(k)is (−2≤k ≤3) is the time (in years) after or before the uptake of disability benefit, ξs is the calendar year fixed effect, ci captures individual fixed effects (controlling for all time-invariant individual characteristics such as gender or initial health status) and uis denotes the error term. The parameters ηk are of main interest.
5 Results
5.1 Descriptive analysis
Tables 1 displays descriptive statistics for different subsamples. The first columns refer to the general employed population and the second columns to workers displaced in mass lay- offs, at the time of their (first) lay-off. The samples are restricted to those aged 35−54 years, who were continuously employed in the last six months, and – to comply with the mass lay-off definition – were employed by a firm with at least ten (estimated) employees.
We concentrate on years between 2005−2009 to ensure that we have a two-year long history and also a two-year long follow-up period for each individual. Altogether we examine 28,169 laid-off workers, out of the approximately 1 million workers of the 35–54-years old cohort.
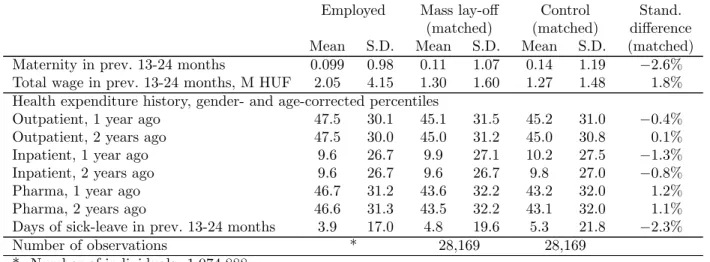
According to Table 1, mass lay-offs peaked during the financial crisis in 2008−2009,and affected males, the lower educated and the employees of smaller firms disproportionately more often. Furthermore, laid-off workers earned one third less and spent one month less in employment, 0.3 month more in unemployment and 0.9 day more on sick leave in the 13−24 months preceding their displacement than the general employed population. On the other hand, the two-year health expenditure history is not particularly different in the laid-off and in the general working population, as measured by outpatient, inpatient and pharmaceutical expenditure percentiles. These percentiles were calculated according to the (five-year) age group- and gender-specific expenditure distributions (covering workers and non-workers as well).6
6The average inpatient percentile is around 10 for both groups because of the low rate of hospitalisation.
Employed Mass lay-off Control Stand.
(matched) (matched) difference Mean S.D. Mean S.D. Mean S.D. (matched) Year
2005 0.202 0.402 0.173 0.378 0.173 0.378 0.0%
2006 0.201 0.401 0.161 0.367 0.161 0.367 0.0%
2007 0.202 0.402 0.152 0.359 0.152 0.359 0.0%
2008 0.201 0.401 0.253 0.435 0.253 0.435 0.0%
2009 0.193 0.395 0.261 0.439 0.261 0.439 0.0%
Male 0.464 0.499 0.538 0.499 0.538 0.499 0.0%
Age group
35-39 0.247 0.431 0.257 0.437 0.261 0.439 −0.9%
40-44 0.232 0.422 0.231 0.422 0.229 0.420 0.5%
45-49 0.244 0.429 0.237 0.425 0.236 0.425 0.2%
50-54 0.277 0.448 0.275 0.446 0.274 0.446 0.2%
Region (2003)
C Hungary 0.289 0.453 0.285 0.452 0.284 0.451 0.3%
C Transdanubia 0.127 0.332 0.130 0.337 0.128 0.334 0.7%
W Transdanubia 0.116 0.32 0.111 0.314 0.109 0.312 0.5%
S Transdanubia 0.091 0.287 0.083 0.277 0.083 0.276 0.1%
N Hungary 0.118 0.322 0.138 0.345 0.141 0.348 −0.8%
N Great Plain 0.137 0.343 0.141 0.348 0.146 0.353 −1.3%
S Great Plain 0.123 0.328 0.111 0.314 0.108 0.311 0.7%
Settlement type (2003)
Budapest 0.164 0.37 0.153 0.360 0.152 0.359 0.4%
County-level town 0.217 0.412 0.187 0.390 0.188 0.391 −0.2%
Other town 0.321 0.467 0.326 0.469 0.326 0.469 −0.1%
Village 0.298 0.457 0.334 0.472 0.334 0.472 0.0%
Estimated level of education (based on occupation)
Primary 0.140 0.347 0.207 0.405 0.206 0.405 0.2%
Lower secondary 0.377 0.485 0.544 0.498 0.543 0.498 0.2%
Upper secondary 0.276 0.447 0.172 0.378 0.173 0.378 −0.2%
Tertiary 0.207 0.405 0.077 0.267 0.078 0.268 −0.4%
Firm characteristics
Size 4811 8970 209 554 182 522 5.0%
10-24 employees 0.121 0.326 0.214 0.410 0.229 0.420 −3.7%
25-49 employees 0.079 0.269 0.183 0.387 0.196 0.397 −3.2%
50-99 employees 0.089 0.284 0.181 0.385 0.190 0.392 −2.3%
100-249 employees 0.113 0.316 0.172 0.378 0.170 0.376 0.6%
250-4999 employees 0.308 0.462 0.214 0.410 0.187 0.390 6.8%
5000- employees 0.292 0.455 0.036 0.185 0.028 0.165 4.4%
Size 1 year ago if non-missing 3831 7632 220 576 181 565 6.9%
Size 2 years ago if non-missing 3038 6454 167 479 141 516 5.2%
Size 1 year ago non-missing 0.852 0.355 0.795 0.404 0.791 0.406 1.0%
Size 2 years ago non-missing 0.727 0.445 0.595 0.491 0.572 0.495 4.6%
Government sector 0.292 0.455 0.030 0.172 0.027 0.161 2.3%
Labour market history, number of months
Employment in prev. 12 months 11.87 0.71 11.59 1.21 11.58 1.24 0.6%
Employment in prev. 13-24 months 11.36 2.21 10.31 3.50 10.18 3.66 3.7%
Disab benefit in prev. 12 months 0.003 0.14 0.007 0.22 0.005 0.20 0.6%
Disab benefit in prev. 13-24 months 0.010 0.32 0.021 0.45 0.022 0.46 −0.2%
Unemployment in prev. 12 months 0.066 0.55 0.20 0.93 0.19 0.93 1.0%
Unemployment in prev. 13-24 months 0.20 1.20 0.55 1.91 0.55 1.92 −0.4%
Maternity in prev. 12 months 0.026 0.42 0.028 0.45 0.037 0.51 −1.9%
Employed Mass lay-off Control Stand.
(matched) (matched) difference Mean S.D. Mean S.D. Mean S.D. (matched) Maternity in prev. 13-24 months 0.099 0.98 0.11 1.07 0.14 1.19 −2.6%
Total wage in prev. 13-24 months, M HUF 2.05 4.15 1.30 1.60 1.27 1.48 1.8%
Health expenditure history, gender- and age-corrected percentiles
Outpatient, 1 year ago 47.5 30.1 45.1 31.5 45.2 31.0 −0.4%
Outpatient, 2 years ago 47.5 30.0 45.0 31.2 45.0 30.8 0.1%
Inpatient, 1 year ago 9.6 26.7 9.9 27.1 10.2 27.5 −1.3%
Inpatient, 2 years ago 9.6 26.7 9.6 26.7 9.8 27.0 −0.8%
Pharma, 1 year ago 46.7 31.2 43.6 32.2 43.2 32.0 1.2%
Pharma, 2 years ago 46.6 31.3 43.5 32.2 43.1 32.0 1.1%
Days of sick-leave in prev. 13-24 months 3.9 17.0 4.8 19.6 5.3 21.8 −2.3%
Number of observations * 28,169 28,169
*: Number of individuals: 1,074,888
*: Number of person-months: 38.4−38.9 million, depending on the variable S.D.: standard deviation
Standardized difference: the difference of means divided by the square root of the average of the two individual variances
Table 1: Descriptive statistics of the employed, the matched mass lay-off and matched control sample (with standardized differences between the latter two), see text for sample restrictions
Figure 2 displays the time pattern of labour force indicators of the matched laid-off vs.
control workers. The pre-trends of the two groups are identical, apart from the severance pay effect observed in monthly wages of laid-off workers just before the lay-off. The employment rate falls substantially at the time of mass lay-off and partly reverts afterwards, while the unemployment rate shows the opposite pattern. Meanwhile, the stock of disability benefit recipients increases much faster after the job loss than in the control group.
5.2 Mass lay-off and disability benefits
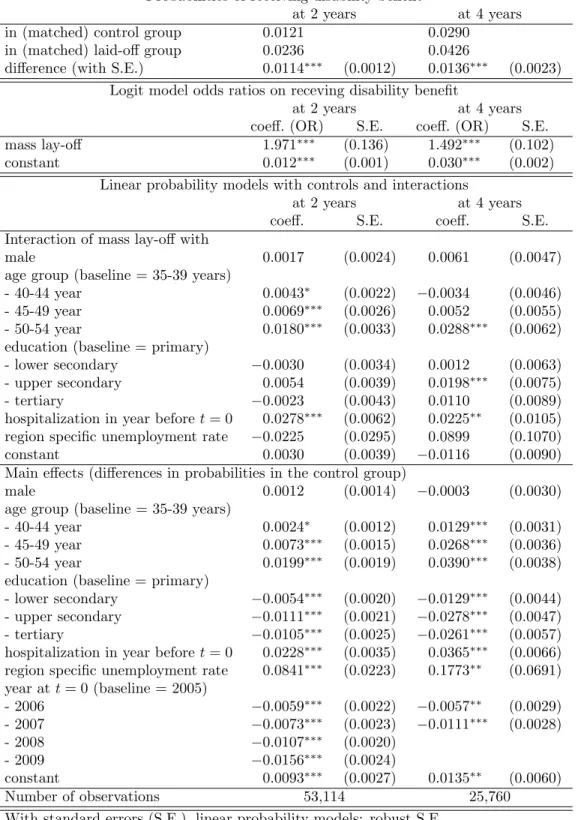
Table 2 displays the probability of receiving disability benefit at t = 24 andt = 48 months.
The ratio of disability benefit recipients is 2.3% in the laid-off and 1.2% in the control group after two years, hence the difference is 1.1% points, which increases to 1.4% points after four years. In line with these figures, a simple logit model, containing only the lay-off dummy gives
0.40.60.81.0
-36 -24 -12 0 12 24 36 48 60
months since mass lay-off
laid off control
employment
0.00.10.20.3
-36 -24 -12 0 12 24 36 48 60
months since mass lay-off
laid off control
unemployment
0.000.020.04
-36 -24 -12 0 12 24 36 48 60
months since mass lay-off
laid off control
disability benefits
110130150170
1,000 HUF, deflated to 2003
-36 -24 -12 0 12 24 36 48 60
months since mass lay-off
laid off control
monthly wage, zeros excluded
Figure 2: Labour force indicators around the time of mass lay-off
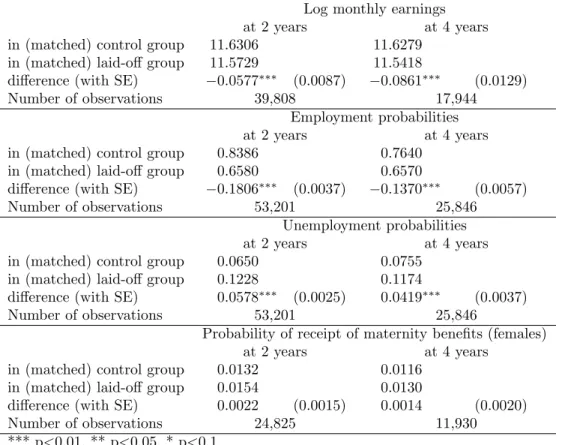
an odds ratio of 1.97 after two years and 1.49 after four years. For the sake of comparison, we show in Table B1 in the Appendix that mass lay-off decreases the probability of employment by 13−17% points and increases the probability of unemployment by 3.7−5.3% points over the two- and four-year time horizons, with no significant effect on the receipt of maternity benefits. Job loss decreases non-zero earnings by 16−17% over these time spans, which is in line with other results in the literature (Jacobson et al., 1993 and Stevens, 1997, among others).
Looking at the linear probability model with heterogenous effects in Table 2, the in- teraction terms of individual characteristics with mass lay-off show that job loss increases
the probability of receiving disability benefit particularly among individuals aged 45−54 and among those in bad health, as measured by the dummy for hospitalisation in the year preceding job loss. After adjusting for these differences, the interaction terms with gender, education level and micro-regional unemployment rate – a proxy for local labour market conditions – are statistically insignificant. These results imply that those who transit to disability benefit after mass lay-off were, on average, in worse health already before the mass lay-off. However, they could have continued working had the mass lay-off not occurred.
The lower panel of Table 2 displays the differences in baseline probabilities between groups. The above interaction terms should be interpreted in light of the fact that the older, the lower educated, those in bad health and those living in higher unemployment regions are more likely to transition to disability in the control group. Hence, for instance, local labour market conditions have an impact upon the transition to disability, but this impact does not seem to vary by treatment status (i.e. by being laid-off or not).
Figure 3 shows the three-month transition probabilities to disability and their differences in the two groups. The transition probability jumps high in the laid-off group after the expiry of unemployment benefit (at 6−12 months), while it increases slowly in the control group.
The difference of transition probabilities is statistically significantly positive in the first three years and reaches zero afterwards. Overall, around half of the total excess transitions of four years occur within the first year.
0.00.10.20.30.4per cent
0 12 24 36 48 60
months since mass lay-off
laid off control
transition probabilities
-0.2-0.10.00.10.20.30.4per cent
0 12 24 36 48 60
months since mass lay-off difference
difference
Figure 3: Effect of mass lay-off on the three-month transition probabilities to disability, with their difference (and the 95% confidence interval)
5.3 Health expenditures
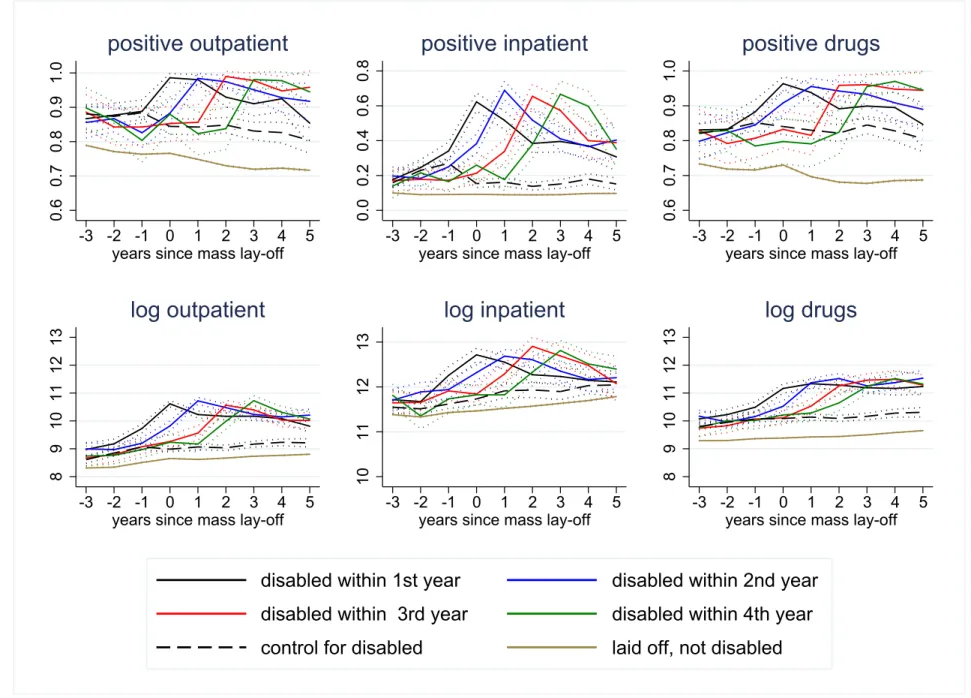
According to Figure 4, the uptake of disability benefit is associated with raised health expen- ditures, which decline after claiming the benefit but do not fall back to their pre-disability levels. At the same time, we do not observe a noteworthy pattern among the matched con- trol observations; i.e. among individuals who had similar pre-lay-off characteristics but were not laid off.7 Similarly, there is no jump in the health expenditures of the laid-off but not
7Initially, we have four different control groups for the four different disabled samples according to the time spent between mass lay-off and disability benefit uptake. Since the health expenditures of the four control groups do not differ significantly, we display only their average values in Figure 4.
disabled individuals. The lines for the latter group are consistently below those for the other groups, since the later disabled laid-off workers are in worse health even before the lay-off.
Specifically, the figures for the binary health expenditure outcomes show that the diver- gence between the laid-off and control groups are the strongest for the probability of positive inpatient care expenditures (i.e. hospitalisation). Since most people realise some outpatient and pharmaceutical expenditures irrespective of their disability status, the differences be- tween the treatment and control groups are not that strong in these two cases, albeit still statistically significant.
Turning to the logarithm of positive expenditures, the amount of non-zero outpatient and pharmaceutical expenditures starts to increase substantially a couple of years before the individual first receives disability benefit. A smaller increase is also observed for the amount of non-zero inpatient expenditures.
Probabilities of receiving disability benefit
at 2 years at 4 years
in (matched) control group 0.0121 0.0290
in (matched) laid-off group 0.0236 0.0426
difference (with S.E.) 0.0114∗∗∗ (0.0012) 0.0136∗∗∗ (0.0023) Logit model odds ratios on receving disability benefit
at 2 years at 4 years
coeff. (OR) S.E. coeff. (OR) S.E.
mass lay-off 1.971∗∗∗ (0.136) 1.492∗∗∗ (0.102)
constant 0.012∗∗∗ (0.001) 0.030∗∗∗ (0.002)
Linear probability models with controls and interactions
at 2 years at 4 years
coeff. S.E. coeff. S.E.
Interaction of mass lay-off with
male 0.0017 (0.0024) 0.0061 (0.0047)
age group (baseline = 35-39 years)
- 40-44 year 0.0043∗ (0.0022) −0.0034 (0.0046)
- 45-49 year 0.0069∗∗∗ (0.0026) 0.0052 (0.0055)
- 50-54 year 0.0180∗∗∗ (0.0033) 0.0288∗∗∗ (0.0062)
education (baseline = primary)
- lower secondary −0.0030 (0.0034) 0.0012 (0.0063)
- upper secondary 0.0054 (0.0039) 0.0198∗∗∗ (0.0075)
- tertiary −0.0023 (0.0043) 0.0110 (0.0089)
hospitalization in year before t= 0 0.0278∗∗∗ (0.0062) 0.0225∗∗ (0.0105) region specific unemployment rate −0.0225 (0.0295) 0.0899 (0.1070)
constant 0.0030 (0.0039) −0.0116 (0.0090)
Main effects (differences in probabilities in the control group)
male 0.0012 (0.0014) −0.0003 (0.0030)
age group (baseline = 35-39 years)
- 40-44 year 0.0024∗ (0.0012) 0.0129∗∗∗ (0.0031)
- 45-49 year 0.0073∗∗∗ (0.0015) 0.0268∗∗∗ (0.0036)
- 50-54 year 0.0199∗∗∗ (0.0019) 0.0390∗∗∗ (0.0038)
education (baseline = primary)
- lower secondary −0.0054∗∗∗ (0.0020) −0.0129∗∗∗ (0.0044) - upper secondary −0.0111∗∗∗ (0.0021) −0.0278∗∗∗ (0.0047)
- tertiary −0.0105∗∗∗ (0.0025) −0.0261∗∗∗ (0.0057)
hospitalization in year before t= 0 0.0228∗∗∗ (0.0035) 0.0365∗∗∗ (0.0066) region specific unemployment rate 0.0841∗∗∗ (0.0223) 0.1773∗∗ (0.0691) year att= 0 (baseline = 2005)
- 2006 −0.0059∗∗∗ (0.0022) −0.0057∗∗ (0.0029)
- 2007 −0.0073∗∗∗ (0.0023) −0.0111∗∗∗ (0.0028)
- 2008 −0.0107∗∗∗ (0.0020)
- 2009 −0.0156∗∗∗ (0.0024)
constant 0.0093∗∗∗ (0.0027) 0.0135∗∗ (0.0060)
Number of observations 53,114 25,760
With standard errors (S.E.), linear probability models: robust S.E.
*** p<0.01, ** p<0.05, * p<0.1
Table 2: Effects of mass lay-off on the probability of receiving disability benefit two and four years later
0.60.70.80.91.0
-3 -2 -1 0 1 2 3 4 5
years since mass lay-off
positive outpatient
0.00.20.40.60.8
-3 -2 -1 0 1 2 3 4 5
years since mass lay-off
positive inpatient
0.60.70.80.91.0
-3 -2 -1 0 1 2 3 4 5
years since mass lay-off
positive drugs
8910111213
-3 -2 -1 0 1 2 3 4 5
years since mass lay-off
log outpatient
10111213
-3 -2 -1 0 1 2 3 4 5
years since mass lay-off
log inpatient
8910111213
-3 -2 -1 0 1 2 3 4 5
years since mass lay-off
log drugs
disabled within 1st year disabled within 2nd year disabled within 3rd year disabled within 4th year control for disabled laid off, not disabled
Figure 4: Health expenditures of the laid-off, disabled workers by the time gap between the uptake of disability benefit and mass lay-off, in the matched control group and in the laid-off but not disabled sample, with 95% confidence intervals. The
23
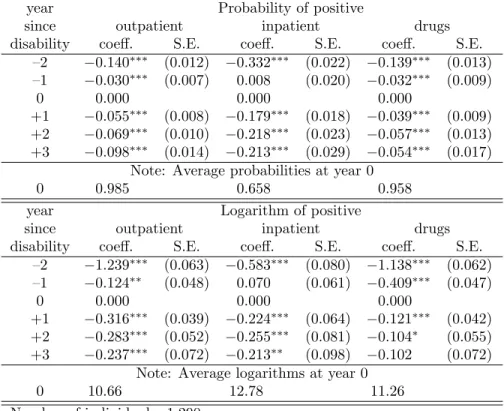
To estimate the magnitude of the peak and the subsequent decline of health expenditures observed in Figure 4, we report the results of the event study analysis of equation (1) in Table 3. As for the probabilities of non-zero expenditures, the peak is the strongest for inpatient care use (33% points in two years), but also substantial for the other two categories (14% points). It is also noteworthy that inpatient health expenditures reach their peak the year prior to the disability insurance enrolment. Turning to the logarithms of the positive expenditures, the magnitude of the peak is similar for the outpatient and the pharmaceutical categories (around 1.2 on the logarithmic scale, implying a greater than three-fold increase) and somewhat weaker for the inpatient category (0.6 on the log scale, slightly less than two-fold increase). If we combine the changes in logarithmic values with the changes in probabilities (calculated at the average values), we obtain that each expenditure category increases 3.5−4 times in the two years before disability insurance enrolment. Afterwards, all categories of health expenditures start to decline but do not reach their pre-disability levels.
From the peak, the probability of hospitalisation falls by around 20% points, the probabilities of the two other categories by 5− 10% points, the logarithm of positive outpatient and inpatient expenditures by 20−30%, while the positive pharmaceutical expenditures decrease the least. Altogether, the expenditure categories remain 2−3 times higher in the medium term compared to two years prior to claiming disability benefit.
6 Discussion and conclusions
Using individual level administrative panel data from Hungary, we analysed the effect of job loss on disability benefit uptake and its relationship with health expenditures. To establish
year Probability of positive
since outpatient inpatient drugs
disability coeff. S.E. coeff. S.E. coeff. S.E.
–2 −0.140∗∗∗ (0.012) −0.332∗∗∗ (0.022) −0.139∗∗∗ (0.013) –1 −0.030∗∗∗ (0.007) 0.008 (0.020) −0.032∗∗∗ (0.009)
0 0.000 0.000 0.000
+1 −0.055∗∗∗ (0.008) −0.179∗∗∗ (0.018) −0.039∗∗∗ (0.009) +2 −0.069∗∗∗ (0.010) −0.218∗∗∗ (0.023) −0.057∗∗∗ (0.013) +3 −0.098∗∗∗ (0.014) −0.213∗∗∗ (0.029) −0.054∗∗∗ (0.017)
Note: Average probabilities at year 0
0 0.985 0.658 0.958
year Logarithm of positive
since outpatient inpatient drugs
disability coeff. S.E. coeff. S.E. coeff. S.E.
–2 −1.239∗∗∗ (0.063) −0.583∗∗∗ (0.080) −1.138∗∗∗ (0.062) –1 −0.124∗∗ (0.048) 0.070 (0.061) −0.409∗∗∗ (0.047)
0 0.000 0.000 0.000
+1 −0.316∗∗∗ (0.039) −0.224∗∗∗ (0.064) −0.121∗∗∗ (0.042) +2 −0.283∗∗∗ (0.052) −0.255∗∗∗ (0.081) −0.104∗ (0.055) +3 −0.237∗∗∗ (0.072) −0.213∗∗ (0.098) −0.102 (0.072)
Note: Average logarithms at year 0
0 10.66 12.78 11.26
Number of individuals: 1,290 Number of person-years: 5,879
Cluster-robust standard errors (S.E.), *** p<0.01, ** p<0.05, * p<0.1 Individual fixed effects and calendar year fixed effects included.
Table 3: Event study analysis of health expenditures around the uptake of disability benefit (t= 0 denotes the year of first claiming disability benefit)
the causal effects of job loss, we made use of mass lay-offs, and matched laid-off individuals to non-laid-off workers with similar employment and health history. We then examined the uptake of disability benefits and health expenditures on the matched sample.
According to our results, job loss implies a 50−100% increase in the transition to disability insurance in 2−4 years. The large and statistically significant effects are in line with the conclusions of related studies from Norway (in between the effects estimated by Bratsberg et al., 2013 and Rege et al., 2009). To our knowledge, our study is the first that explicitly analyses the time-varying patterns of the transition rates. We obtain that around half of the excess transitions to disability occur within the first year, and transition rates become very
similar in the laid-off and control groups after three years.
Our models indicate that the effect of job loss on disability insurance utilisation is stronger among those in worse health. In addition, we found that the uptake of disability benefit after a job loss is associated with a surge in health expenditures. Compared to two years prior to claiming disability benefit, health expenditures increase 3.5−4 times, and start to decline afterwards but remain elevated in the medium term (at 2 −3 times the original values).
Altogether, the additional health expenditure as a share of annual disability payments reaches 40% in the first year of disability and 20−25% in the medium term.8
We have no information on the health status of the individuals; thus we cannot conclude on the causes behind the surge in health expenditure. In principle, the worsening health status, the diagnosis of previously undetected chronic diseases, or unnecessary healthcare visits in order to cheat the disability system, may all lead to expenditure increase. However, indirect evidence suggests that at least a substantial part of the surge is not due to a genuine worsening of health status. First, half of the excess transitions occur within the first year, in a time span when genuine health shocks are unlikely. Second, although the 3.5−4-fold surge in health expenditure seems large at first sight, its pattern, in fact, resembles that observed at the diagnosis of chronic diseases, such as diabetes or hypertension, with a somewhat smaller (two-fold – three-fold) increase. Based on individual-level administrative data, Appendix D shows event study results of the outpatient and inpatient expenditures around the time of diagnosis of selected chronic diseases in the 35−54-years old age group.
Overall, our results indicate large causal effects of job loss on disability insurance use,
8Compared to two years prior to claiming disability benefit, health expenditures are higher by 370 thou- sand HUF in the first year of disability insurance enrolment and by 220 thousand HUF two years later.
Meanwhile, the average annual disability benefit was 920 thousand HUF in the laid-off, disabled sample.
which are, in turn, associated with substantial increases in health expenditures. Out of 100 laid-off workers, roughly 1.4 claim disability benefit due to the job loss within four years of the lay-off. Compared to the pre-lay-off health expenditure levels, these individuals more than triple their annual health expenditure. These findings point to the importance of ensuring employment possibilities to workers affected by mass lay-offs. Otherwise, disability benefits serve as a substitute for employment which increases public expenditure not only due to benefit payments, but also due to the higher public health expenditure of the benefit claimants.
References
W. Arulampalam. Is unemployment really scarring? Effects of unemployment experiences on wages. The Economic Journal, 111(475):585–606, 2001. URL https://doi.org/10.
1111/1468-0297.00664.
P. C. Austin. Using the standardized difference to compare the prevalence of a binary variable between two groups in observational research. Communications in Statistics - Simulation and Computation, 38(6):1228–1234, 2009. URL https://doi.org/10.1080/
03610910902859574.
P. C. Austin. Optimal caliper widths for propensity-score matching when estimating dif- ferences in means and differences in proportions in observational studies. Pharmaceutical Statistics, 10(2):150–161, 2011. URL https://doi.org/10.1002/pst.433.
D. H. Autor and M. G. Duggan. The rise in the disability rolls and the decline in
unemployment. The Quarterly Journal of Economics, 118(1):157–206, 2003. URL https://doi.org/10.1162/00335530360535171.
J. Banks, R. Blundell, and C. Emmerson. Disability benefit receipt and reform: reconciling trends in the United Kingdom. Journal of Economic Perspectives, 29(2):173–90, 2015.
URLhttps://doi.org/10.1257/jep.29.2.173.
R. B¨oheim and M. P. Taylor. The search for success: do the unemployed find stable em- ployment? Labour Economics, 9(6):717–735, 2002. URL https://doi.org/10.1016/
S0927-5371(02)00074-X.
B. Bratsberg, E. Fevang, and K. Røed. Job loss and disability insurance. Labour Economics, 24:137–150, 2013. URL https://doi.org/10.1016/j.labeco.2013.08.004.
M. Browning, A. Moller Dano, and E. Heinesen. Job displacement and stress-related health outcomes. Health Economics, 15(10):1061–1075, 2006. URL https://doi.org/10.1002/
hec.1101.
Central Administration of National Pension Insurance. Statistical yearbooks. https://old.
onyf.hu/hu/dokumentumok/kiadvanyok.html, 2018. Accessed: 2018-12-14.
P. Elek, B. V´aradi, and M. Varga. Effects of geographical accessibility on the use of outpatient care services: Quasi-experimental evidence from panel count data. Health Economics, 24 (9):1131–1146, 2015. URLhttps://doi.org/10.1002/hec.3201.
M. Eliason and D. Storrie. Lasting or latent scars? Swedish evidence on the long-term effects of job displacement. Journal of Labor Economics, 24(4):831–856, 2006. URL https://doi.org/10.1086/506487.
P. Ga´al, S. Szigeti, M. Csere, M. Gaskins, and D. Panteli. Hungary: Health system re- view. Health Systems in Transition, 13(5):1–266, 2011. URL https://europepmc.org/
abstract/MED/22394651.
M. Gregory and R. Jukes. Unemployment and subsequent earnings: Estimating scarring among British men 1984–94.The Economic Journal, 111(475):607–625, 2001. URLhttps:
//doi.org/10.1111/1468-0297.00665.
L. S. Jacobson, R. J. LaLonde, and D. G. Sullivan. Earnings losses of displaced workers.
The American Economic Review, 83(4):685–709, 1993.
S. Jim´enez-Mart´ın, A. J. Mestres, and J. V. Castell´o. Great recession and disability insurance in Spain. Empirical Economics, 2018. URL https://doi.org/10.1007/
s00181-017-1396-1.
A. Kuhn, R. Lalive, and J. Zweim¨uller. The public health costs of job loss. Journal of Health Economics, 28(6):1099–1115, 2009. URL https://doi.org/10.1016/j.jhealeco.2009.
09.004.
J. B. Liebman. Understanding the increase in disability insurance benefit receipt in the United States. Journal of Economic Perspectives, 29(2):123–50, 2015. URL https://
doi.org/10.1257/jep.29.2.123.
N. Maestas, K. J. Mullen, and A. Strand. Disability insurance and the great recession.
American Economic Review, 105(5):177–82, 2015. URLhttps://doi.org/10.1257/aer.
p20151089.
MISSOC. Mutual information system on social protection. Comparative tables database, invalidity. http://www.missoc.org/, 2018. Accessed: 2018-01-24.
OECD. OECD Employment Outlook 2009: Tackling the Jobs Crisis. Organisation for Eco- nomic Co-operation and Development, 2009. URL https://doi.org/10.1787/empl_
outlook-2009-en.
OECD. OECD Economic Surveys: Hungary 2012. OECD Publishing, Paris, 2012. URL https://doi.org/10.1787/9789264127272-en.
M. Rege, K. Telle, and M. Votruba. The effect of plant downsizing on disability pension utilization. Journal of the European Economic Association, 7(4):754–785, 2009. URL https://doi.org/10.1162/JEEA.2009.7.4.754.
C. J. Ruhm. Are workers permanently scarred by job displacements? The American Eco- nomic Review, 81(1):319–324, 1991.
J. Schaller and A. H. Stevens. Short-run effects of job loss on health conditions, health insurance, and health care utilization. Journal of Health Economics, 43:190–203, 2015.
URLhttps://doi.org/10.1016/j.jhealeco.2015.07.003.
A. Scharle. A labour market explanation for the rise in disability claims. The Hungarian Labour Market Review and Analysis, pages 91–100, 2008. URL http://www.econ.core.
hu/english/publications/lmyb.html.
A. Scharle. Integrated employment and rehabilitation services: evidence from Hungary.´ Budapest Institute for Policy Analysis, http://www.budapestinstitute.eu/uploads/
BI_rehab_nontechnical_summary_08062011.pdf, 2011.