Development/Plasticity/Repair
Microglia Actively Remodel Adult Hippocampal Neurogenesis through the Phagocytosis Secretome
Irune Diaz-Aparicio,
1,2In˜aki Paris,
1,2Virginia Sierra-Torre,
1,2Ainhoa Plaza-Zabala,
1Noelia Rodríguez-Iglesias,
1,2Mar Ma´rquez-Ropero,
1,2Sol Beccari,
1,2Paloma Huguet,
1,2Oihane Abiega,
1,2Elena Alberdi,
1,2XCarlos Matute,
1,2Irantzu Bernales,
2Angela Schulz,
3Lilla Otrokocsi,
4Beata Sperlagh,
4Kaisa E. Happonen,
5,6Greg Lemke,
5,6Mirjana Maletic-Savatic,
7,8X Jorge Valero,
1,2,9and X Amanda Sierra
1,2,91Achucarro Basque Center for Neuroscience, Leioa, Bizkaia 48940, Spain,2University of the Basque Country UPV/EHU, Leioa, Bizkaia 48940, Spain,
3Rudolf-Scho¨nheimer-Institute of Biochemistry, Medical Faculty, University Leipzig 04109, Germany,4Laboratory of Molecular Pharmacology, Institute of Experimental Medicine, Hungarian Academy of Sciences, Budapest H-1083, Hungary,5Molecular Neurobiology Laboratory,6Immunobiology and Microbial Pathogenesis Laboratory, Salk Institute for Biological Studies, La Jolla, California 92037,7Jan and Dan Duncan Neurological Research Institute at Texas Children’s Hospital, Houston, Texas 77030,8Department of Pediatrics and Neuroscience, Program in Developmental Biology, Baylor College of Medicine, Houston, Texas 77030, and9Ikerbasque Foundation, Bilbao, Bizkaia 48013, Spain
During adult hippocampal neurogenesis, most newborn cells undergo apoptosis and are rapidly phagocytosed by resident microglia to prevent the spillover of intracellular contents. Here, we propose that phagocytosis is not merely passive corpse removal but has an active role in maintaining neurogenesis. First, we found that neurogenesis was disrupted in male and female mice chronically deficient for two phagocytosis pathways: the purinergic receptor P2Y12, and the tyrosine kinases of the TAM family Mer tyrosine kinase (MerTK)/Axl. In contrast, neurogenesis was transiently increased in mice in which MerTK expression was conditionally downregulated. Next, we per- formed a transcriptomic analysis of the changes induced by phagocytosis in microglia in vitro and identified genes involved in metabo- lism, chromatin remodeling, and neurogenesis-related functions. Finally, we discovered that the secretome of phagocytic microglia limits the production of new neurons both in vivo and in vitro. Our data suggest that microglia act as a sensor of local cell death, modulating the balance between proliferation and survival in the neurogenic niche through the phagocytosis secretome, thereby supporting the long- term maintenance of adult hippocampal neurogenesis.
Key words: adult neurogenesis; MerTK/Axl; microglia; P2Y12; phagocytosis; secretome
Introduction
Neurogenesis, or the formation of new neurons, is a complex process that extends throughout adulthood in specific regions
of the mammalian brain. Here we focus on the subgranular zone of the hippocampus, whose radial neural stem cells (rNSCs) generate newborn granule cells in rodents (Ehninger and Kemp-
Received May 2, 2019; revised Dec. 12, 2019; accepted Dec. 13, 2019.
Author contributions: I.D.-A., I.P., J.V., and A. Sierra designed research; I.D.-A., I.P., V.S.-T., A.P.-Z., N.R.-I., M.M.-R., S.B., P.H., O.A., E.A., I.B., L.O., K.E.H., J.V., and A. Sierra performed research; I.D.-A., I.P., I.B., J.V., and A.
Sierra analyzed data; C.M., B.S., G.L., and A. Sierra contributed unpublished reagents/analytic tools; I.D.-A., I.P., V.S.-T., A.P.-Z., N.R.-I., M.M.-R., S.B., A. Schulz, L.O., B.S., K.E.H., G.L., M.M.-S., J.V., and A. Sierra wrote the paper.
This work was supported by grants from the Spanish Ministry of Economy and Competitiveness (http://www.
mineco.gob.es) with FEDER funds to A.S. (BFU2012-32089 and RYC-2013-12817) to A.S. and J.V. (BFU2015-66689);
a Leonardo Award from the BBVA Foundation to A.S. (IN16,_BBM_BAS_0260); a Basque Government Department of Education project to A.S. (PI_2016_1_0011;http://www.euskadi.eus/basque-government/department-educa- tion/); Ikerbasque start-up funds to J.V.; a Hungarian Research and Development Fund Grant (K116654) to B.S.; a Hungarian Brain Research Program Grant (2017-1.2.1-NKP-2017-00002) to B.S.; a National Institutes of Health Grant (AG060748) to G.L. In addition, I.D.-A., N.R.-I., and M.M.-R. are recipients of pre-doctoral fellowships from the University of the Basque Country EHU/UPV (http://www.ehu.eus/en/en-home); I.P. is a recipient of a Gangoiti Foundation Fellowship; S.B. is recipients of pre-doctoral fellowship from the Spanish Ministry of Economy
Significance Statement
Microglia are the brain professional phagocytes and, in the adult hippocampal neurogenic niche, they remove newborn cells
naturally undergoing apoptosis. Here we show that phagocytosis of apoptotic cells triggers a coordinated transcriptional program
that alters their secretome, limiting neurogenesis both in vivo and in vitro. In addition, chronic phagocytosis disruption in mice
deficient for receptors P2Y12 and MerTK/Axl reduces adult hippocampal neurogenesis. In contrast, inducible MerTK downregu-
lation transiently increases neurogenesis, suggesting that microglial phagocytosis provides a negative feedback loop that is
necessary for the long-term maintenance of adult hippocampal neurogenesis. Therefore, we speculate that the effects of promot-
ing engulfment/degradation of cell debris may go beyond merely removing corpses to actively promoting regeneration in devel-
opment, aging, and neurodegenerative diseases.
ermann, 2008) and humans (Moreno-Jimenez et al., 2019). Now- adays, newly generated neurons are strongly suggested to contribute to hippocampus-dependent learning and memory, among other functions (Deng et al., 2010). Multiple endogenous factors regulate the proliferation, survival, differentiation, and integration of the new neurons in the adult hippocampus. In the cellular niche, one key element is microglia, the resident macro- phages of the nervous system that coordinate the brain inflam- matory response. The detrimental effect of neuroinflammation on neurogenesis is well described, and is mediated by inflamma- tory cytokines such as interleukin (IL)-1, tumor necrosis factor
␣
(TNF
␣), and IL-6 (Ekdahl et al., 2003; Monje et al., 2003).
Microglia also beneficially affect neurogenesis, as they are ca- pable of producing factors that modulate proliferation or survival of different cells within the neuronal lineage.
In vitrostudies dem- onstrate that cultured microglia promote differentiation of pre- cursor cells (Aarum et al., 2003), whereas microglia-conditioned media enhances neuroblast production and neuronal survival (Morgan et al., 2004; Walton et al., 2006). Furthermore, micro- glia were suggested to inhibit the proliferation of hippocampal rNSCs, as their number inversely correlates with adult hip- pocampal neurogenesis (Gebara et al., 2013). Recently, experi- ments using diphtheria toxin-induced ablation of microglia propose that microglia are essential for neuroblast survival (Kre- isel et al., 2019) but the mechanisms underlying the regulation of hippocampal neurogenesis by microglia are still unexplored both
in vitroand especially
in vivo(Sierra et al., 2014).
Here, we focus on another major role of microglia in the adult hippocampal neurogenic niche: the removal of apoptotic new- born cells through phagocytosis (Sierra et al., 2010). The majority of hippocampal newborn cells undergo apoptosis in the first few days of cells’ life through adulthood (Beccari et al., 2017) and are immediately recognized and degraded by “unchallenged” micro- glia (Sierra et al., 2010). Microglia are the brain professional phagocytes compared with other cell types (Sierra et al., 2013) and prevent the release of toxic intracellular contents (Nagata et al., 2010), and thus, this process is essential to avoid alterations of the surrounding tissue.
In this study, we propose that microglial phagocytosis does not conclude with the physical elimination of apoptotic cells, but is followed by a coordinated transcriptional program that triggers the production of neurogenic modulatory factors, which directly contribute to the maintenance and correct regulation of the adult hippocampal neurogenic cascade. We have used constitutive and inducible knock-out (KO) mice to abolish two phagocytosis- related receptors: the purinergic receptor P2Y12 and the Mer tyrosine kinase (MerTK) of the TAM (Tyro, Axl, and Mer) fam- ily. We discovered that chronic phagocytosis deficiency disrupts neurogenesis but acute phagocytosis impairment only transiently increases neurogenesis. In addition, using a combined
in vitroand
in vivobased experimental strategy, we found that the secre- tome of phagocytic microglia limits the production of new neu- rons to maintain the homeostasis of the adult hippocampal neurogenic niche.
Materials and Methods
Mice. All experiments were performed in fms-EGFP (MacGreen) mice, except where indicated, in which all microglia express the fluorescent reporter (Sasmono et al., 2003;Sierra et al., 2007). KO mice were pro- vided by Beata Sperlagh, Institute of Experimental Medicine (P2Y12 KO) and Greg Lemke, Salk Institute (MerTK/Axl KO). Microglial-specific, inducible MerTK/Axl mice were generated usingCx3cr1CreER(Parkhurst et al., 2013) andMertkfl/fl(Fourgeaud et al., 2016), described previously.
To induce deletion of theMertkfl/flallele inCx3cr1CreER/⫹Mertkfl/flmice, two doses of tamoxifen dissolved in corn oil (75 mg/kg) or corresponding volume of corn oil alone (control mice) were administered intraperito- neally at postnatal days (P)21 and P23. All mice used were in a C57BL/6 background. Mice were housed in 12 h light/dark cycle withad libitum access to food and water. Mice received a single dose of 5-bromo-2⬘- deoxyuridine (BrdU; 100 –150 mg/kg) at P28. At 24 h or 28 d after BrdU injection, mice were anesthetized with a mixture of ketamine and xyla- zine (100 mg/kg and 10 mg/kg, respectively), perfused with 20 U/ml heparin in PBS followed by 4% PFA in PBS. Brains were collected, im- mersion fixed for 4 h in 4% PFA in PBS, and stored in 30% sucrose, 30%
ethylene glycol at⫺20°C until analysis. All procedures followed the Eu- ropean Directive 2010/63/EU and NIH guidelines, and were approved by the Ethics Committees of the University of the Basque Country EHU/
UPV (Leioa, Spain; CEBA/205/2011, CEBA/206/2011, CEIAB/82/2011, CEIAB/105/2012).
SH-SY5Y cell line. SH-SY5Y (American Type Culture Collection), a human neuroblastoma cell line derived from the bone marrow of 4-year- old female was used for phagocytic assay experiments. SH-SY5Y cells were grown as an adherent culture in non-coated culture flasks covered with 10 –15 ml of medium. The medium consisted of DMEM (Invitro- gen), supplemented with 10% fetal bovine serum (FBS) and 1% antibi- otic/antimycotic (all from Invitrogen). When confluency was reached, cells were trypsinized and re-plated at 1:4.
BV2 cell line.BV2 (Interlab Cell Line Collection San Martino-Instituto Scientifico Tumori-Instituto Nazionale per la Ricerca sul Cancro), a cell line derived from raf/myc-immortalized murine neonatal microglia was used to obtain LPS-induced conditioned media. BV2 cells were grown as an adherent culture in non-coated culture flasks covered with 10 –15 ml of medium. The medium consisted of DMEM (Invitrogen), supple- mented with 10% FBS and 1% antibiotic/antimycotic (all from Invitro- gen). When confluency was reached, cells were trypsinized and replated at 1:4.
Primary microglia cultures.Primary microglia cultures were performed as previously described (Abiega et al., 2016;Beccari et al., 2018). P0 –P1 fms-EGFP mice pup brains were extracted and the meninges were peeled off. The olfactory bulb and cerebellum were discarded and the rest of the brain was then mechanically homogenized by careful pipetting and en- zymatically digested with papain (20 U/ml; Sigma-Aldrich), a cysteine protease enzyme, and DNase (150 U/l; Invitrogen) for 15 min at 37°C.
The resulting cell suspension was then filtered through a 40m nylon cell strainer (Fisher) and transferred to a 50 ml Falcon tube quenched by 5 ml of 20% FBS (Invitrogen) in HBSS. Afterward, the cell suspension was centrifuged at 200⫻gfor 5 min, the pellet was resuspended in 1 ml DMEM (Invitrogen) supplemented with 10% FBS and 1% antibiotic/
antimycotic (Invitrogen), and seeded in T75 poly-L-lysine-coated (15
l/ml; Sigma-Aldrich) culture flasks at a density of two brains per flask.
Medium was changed the day after and then every 3– 4 d, always enriched with granulocyte-macrophage colony stimulating factor (5 ng/ml GM- CSF; Sigma-Aldrich), which promotes microglial proliferation. After confluence (at 37°C, 5% CO2for⬃14 d), microglia cells were harvested by shaking at 100 –150 rpm, 37°C, 4 h. Isolated cells were counted and plated at a density of 80,000 cells/well on poly-L-lysine-coated glass cov- erslips in 24-well plates for immunofluorescence purposes or 1,000,000 cell/dish on coated Petri dishes for real-time quantitative PCR (qPCR).
Microglia were allowed to settle for at least 24 h before any experiment.
and Competitiveness; V.S.-T. and O.A. are recipients of pre-doctoral fellowship from the Basque Government; and A.P.-Z. is the recipient of a Juan de la Cierva postdoctoral fellowship from the Spanish Ministry of Economy and Competitiveness. The funders had no role in study design, data collection and analysis, decision to publish, or preparation of the manuscript; UPV/EHU SGIker technical and human support is gratefully acknowledged. We thank Victor Sa´nchez Zafra for technical support, and Isabel Farin˜as, María Domercq, and Ismael Galve-Roperh for thought- ful discussion of the data.
The authors declare no competing financial interests.
Correspondence should be addressed to Amanda Sierra at amanda.sierra@achucarro.org or Jorge Valero at jorge.valero@achucarro.org.
https://doi.org/10.1523/JNEUROSCI.0993-19.2019 Copyright © 2020 Diaz-Aparicio et al.
This is an open-access article distributed under the terms of the Creative Commons Attribution License Creative Commons Attribution 4.0 International, which permits unrestricted use, distribution and reproduction in any medium provided that the original work is properly attributed.
NPC culture.Neurosphere cultures were performed as previously de- scribed (Babu et al., 2011) with some modifications. Briefly, P0 –P1 fms- EGFP pups were decapitated and the brains extracted and placed in cold HBSS. The homogenization process was performed as detailed in the Primary microglia cultures section, except that no FBS was used in any step to avoid undesired neurosphere adhesion and differentiation. After- ward, the cell suspension was centrifuged at 200⫻gfor 5 min, the pellet was resuspended in 1 ml DMEM/F12 with GlutaMAX (Invitrogen) sup- plemented with 1% penicillin/streptomycin, 1% B27, EGF (12.5 ng/ml), FGF-2 (5 ng/ml;Xapelli et al., 2013). Cells were plated on uncoated Petri dishes (P60); each brain was plated in four Petri dishes with supple- mented DMEM/F12. After 6 d, neurospheres were then disaggregated into a single-cell suspension of neuroprogenitor cells (NPCs) using Neu- roCult chemical dissociation kit following the manufacturer’s instruc- tions and each Petri dish was plated in two 6-multiwell plates. To maintain replicability through the experiments, neurospheres were fro- zen until their use at⫺80°C in 15% DMSO after the first passage.
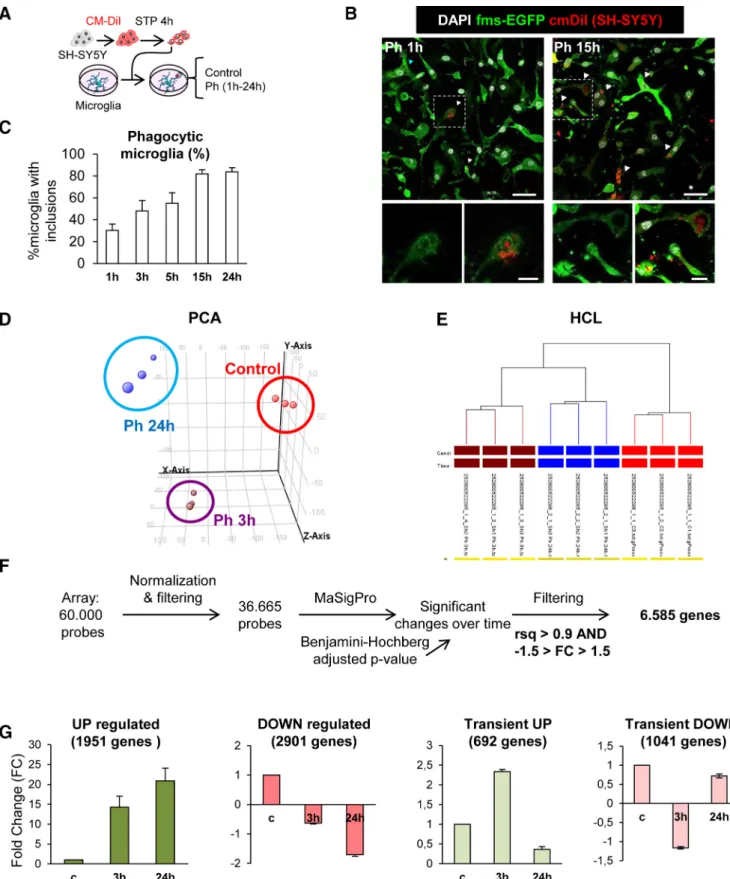
In vitrophagocytosis assay.The protocol was detailed previously (Bec- cari et al., 2018). In brief, microglia were allowed to rest and settle for at least 24 h before phagocytosis experiments. Phagocytosis experiments were performed in DMEM⫹10% FBS to ensure the presence of comple- ment molecules, which are related to microglial phagocytosisin vivo (Diaz-Aparicio and Sierra, 2019) and whose presence determines the immunomodulatory outcome of phagocytosis (Fraser et al., 2010). Pri- mary microglia cells were fed for different time points with SH-SY5Y.
The cell line was previously labeled with the membrane marker CM-DiI (5M; 10 min at 37°C, 15 min at 4°C; Invitrogen) and treated with staurosporine (STP; 3M, 4 h; Sigma-Aldrich) to induce apoptosis. Only the floating dead-cell fraction was collected from the supernatant and added to the primary microglia cultures in a proportion of⬃1:1. Apo- ptotic cells were visualized and quantified by trypan blue in a Neubauer chamber. Because cell membrane integrity is still maintained in early induced apoptotic cells, cells not labeled with trypan blue were consid- ered apoptotic. The media of naive and phagocytic (24 h) microglia was immediately stored at⫺80°C until its use as conditioned media for NPCs.
In some experiments, control and phagocytic microglia were treated with LPS. Three different LPS paradigms were used. In the low LPS concentration paradigm, media was removed and fresh medium with 150 ng/ml LPS or vehicle (PBS) was added for 18 h to primary microglia (Fraser et al., 2010). In the high LPS concentration paradigm, medium was removed and fresh medium with 1g/ml LPS or vehicle (PBS) was added for 24 h to primary or BV2 cells (Monje et al., 2003). To control for LPS presence in the phagocytic media, a third paradigm was performed in which primary microglia was treated with 1g/ml LPS or vehicle (PBS) for 6 h, then media was changed into fresh media for another 18 h.
All supernatants were collected and stored at⫺80°C until its use as conditioned media for NPCs, and all of them were filter-sterilized before adding to the NPC culture.
NPC proliferation and differentiation.Neurospheres of Passage 1 were thawed and expanded for 1 week before the experiment in proliferative conditions (2 passages were performed in total).The day of the experi- ment Passage 3 neurospheres were dissociated into NPCs, cells were counted and plated at a 80,000 cells/well density on poly-L-lysine-coated glass coverslips in 24-well plates in supplemented (Penicillin/streptomy- cin, B27, EGF, and FGF2) DMEM/F12. NPCs were allowed to proliferate for 48 h (Babu et al., 2011) and then washed with PBS before treatment with conditioned media (CM) from control or phagocytic (24 h) micro- glia. For the experimental group, DMEM was also added as a control because it is the media in which microglia were grown. NPCs were then fixed with 4% PFA for 10 min at 3 d, and 5 d of differentiation. For multipotency experiments, NPCs treated for 3 d with CM (control, 24 h phagocytosis or DMEM) were transferred back to DMEM/F12 (without trophic factors) medium and were allowed to differentiate for 5 and 9 d.
For late survival and differentiation assay, after the 48 h of proliferation, NPCs were allowed to differentiate in DMEM/F12 (no trophic factors) for 10 d and then were treated with CM from control or phagocytic (24 h) microglia or DMEM for another 3 and 5 d.
Calcium imaging.Intracellular calcium imaging experiments were per- formed as described previously (Alberdi et al., 2013). CM-treated NPCs were incubated and loaded with 5MFura-2 AM (Invitrogen) for 30 min at 37°C and then washed in HBSS containing 20 mMHEPES, pH 7.4, 10 mMglucose, and 2 mMCaCl2for 10 min at room temperature. The perfusion chamber was assembled on the platform of an inverted epiflu- orescence microscope (Zeiss Axiovert 35) equipped with a 150-W xenon lamp Polychrome IV (TILL Photonics) and a Plan Neofluar 40⫻oil- immersion objective (Zeiss). NPCs were treated with 50 mMKCl, 10M AMPA, 1 mMATP, and 100 M histamine, sequentially. Cells were allowed to recover their baseline before adding the next compound. Cells were visualized with a digital black/white CCD camera (ORCA;
Hamamatsu Photonics). Intracellular calcium signaling responses were calculated as the proportion of different cell phenotypes responding to the different stimuli. The baseline was calculated as the mean of the first 60 s of recording for each cell. Only peaks that increase or decrease three times the SEM of the baseline were considered as a significant response.
FACS sorting.Microglia cells were isolated from brains as described previously (Sierra et al., 2007;Abiega et al., 2016). The corresponding tissues from fms-EGFP mice were dissected and placed in enzymatic solution (in mM: 116 NaCl, 5.4 KCl, 26 NaHCO3, 1 NaH2PO4, 1.5 CaCl2, 1 MgSO4, 0.5 EDTA, 25 glucose, 1L-cysteine) with papain (20 U/ml) and DNase I (150 U/l; Invitrogen) for digestion at 37°C for 15 min. The homogenization process was also helped by careful pipetting. After ho- mogenization, tissue clogs were removed by filtering the cell suspension through a 40m nylon strainer to a 50 ml Falcon tube quenched by 5 ml of 20% FBS in HBSS. For further enrichment of microglia, myelin was removed by using Percoll gradients. For this purpose, cells were centri- fuged at 200⫻gfor 5 min and resuspended in a 20% solution of isotonic percoll (SIP; 20% in HBSS), obtained from a previous stock of SIP (9 parts Percoll per 1 part PBS 10⫻). Then, each sample was layered with HBSS poured very slowly by fire-polished pipettes. Afterward, gradients were centrifuged for 20 min at 200⫻gwith minimum acceleration and no brake so the interphase was not disrupted. Then the interphase was removed, cells were washed in HBSS by centrifuging at 200⫻gfor 5 min and pellet was resuspended in 500l of sorting buffer (25 mMHEPES, 5 mMEDTA, 1% BSA, in HBSS). Microglia cell sorting was performed by FACS Jazz (BD Biosciences), in which the population of green fluores- cent cells was selected, collected in Lysis Buffer (Qiagen) containing 0.7%
-mercaptoethanol and stored at⫺80°C until processing.
Administration of microglia CMin vivo. CM from control and phago- cytic (Ph24h) microglia was administrated via osmotic pumps for 6-d to 2-month-old fms-EGFP mice. Briefly, osmotic pump (flow rate 1l/h;
Model 2001, Alzet) and infusion catheter tubes (Alzet) were filled with the conditioned media (200l) and connected. Pumps were incubated overnight at 37°C in PBS before the surgery. Mice were anesthetized with ketamine/xylazine (10/1 mg/kg) and received a single dose of the analge- sic buprenorphine (1 mg/kg) subcutaneously. The infusion cannulae were inserted at anteroposterior:⫺1.7 mm, laterolateral:⫺1.6 mm, and dorsoventral:⫺1.9 mm from bregma. The injection site did not reach nor damage the DG in any of the mice included in the study. Afterward, a surface of dental cement was created from the cannulae to the screw to avoid any unwanted removal of the cannulae. Osmotic pumps were in- serted inside the skin of the mice. After 6 d, mice were intraperitoneally injected with BrdU (150 mg/kg, single injection), and transcardially per- fused 2 h later to assess proliferation. For differentiation experiments, CM-containing osmotic pumps were inserted for 6-d to 2-month-old fms-EGFP mice. Pumps were removed at 6 d and afterward, a single intraperitoneal injection of BrdU (150 mg/kg) was administered, and mice were killed 28 d later.
Gene expression arrays.Gene arrays analysis was performed following the recommendations of the MIAME (Minimum Information About a Microarray Experiment) consortium (Brazma et al., 2001). Cell samples from control, Ph3h, and Ph24h microglia (n⫽3 independent experi- ments) were lysed and kept at⫺80°C until processing. Total RNA was isolated using PureLink RNA Mini kit (Ambion), following the manu- facturer’s instructions. RNA amount was quantified in a UV/VIS Nano- Drop 1000 spectrophotometer (ThermoFisher Scientific), and its integrity was analyzed with Lab-chip technology in an Agilent 2100 Bio-
analyzer in combination with Agilent RNA 6000 Nano Chips. Eukaryote Total RNA Nano Assay was used as type of test. In all samples, RIN⬎9.3, and 28S/18S⬎1.3 values were obtained. Sample labeling, hybridization, and scanning gene expression profiling were performed at the Gene Ex- pression Unit of Genomics Core Facility of the University of the Basque Country UPV/EHU.
One-color microarray-based gene expression analysis was performed following the One-Color (p/n5190 –2305) protocol from Agilent Tech- nologies (Low Input Quick Amp Labeling kit) for the labeling of the samples. First, 50 ng of total RNA were retrotranscribed with the Affini- tyScript Reverse enzyme Transcriptase (AffinityScript RT), a thermo- stable modified enzyme derived from Moloney murine leukemia virus retrotranscriptase, using promoter-coupled T7 Oligo dT primers. The double-stranded cDNA synthesized by AffinityScript RT was transcribed in vitroby the T7 RNA pol in the presence of Cy3-CTP to generate labeled and amplified cRNA. The labeled samples were purified with columns of RNeasy Mini kit (Qiagen). Subsequently the labeled samples were quan- tified in the NanoDrop ND-1000 to determine the performance of the specific activity of the fluorochromes after labeling. All the hybridized samples met the following minimum requirements: yield⬎0.825g per reaction and cyanine 3-specific activity⬎6 pmol/g.
For the hybridization, 600 ng of labeled cRNA were fragmented and cohybridized to SurePrint G3 Mouse GE 8X60K Microarray Design ID:
028005. Each array/slide contained 8 identical subarrays of⬎60,000 60- mer oligonucleotides of high resolution and performance. It contained probes for 55,681 sequences or transcripts (biological features or non- control features). Several of these biological probes were replicated 10 times for the calculations and quality control measurements (QCMet- rics) of the microarrays. It also contained probes for internal positive controls (spike-ins), which were added to the RNA sample before label- ing and were used for evaluation and verification of the microarray pro- cessing. Manual washing method was performed following Agilent’s recommendations to prevent ozone-related problems.
Slides were scanned on a G2565CA Microarray DNA Scanner from Agilent Technologies with a resolution of 3m and a Tiff image size of 20bit, using the Scan software v8.5.1 with default settings (Scan profile Agilent, G3_GX_1color). The scanned TIFF images were processed and the fluorescence of the probes quantified using Agilent Feature Extrac- tion software 10.7.3.1. Feature Extraction protocol for data extraction:
GE1_107_Sep09; Design File: 28005_D_F_20140728. Software extracts information of the raw fluorescence signal (mean signal) for the fluoro- chrome or channel (Cy3: green channel) from the spot containing the probes (positive and negative controls and no controls or biological fea- ture) and the background, obtained from the negative controls (which contains sequences for which no hybridization is expected, nonspecific binding indicators).
Default parameters (Agilent Feature Extraction software 10.7.3.1) for one-color gene expression microarrays were used for flagging of non- uniform features, population outliers for replicated probes, and features with no significant intensities in Cy3 channel. Agilent Feature Extraction raw data were processed with software GeneSpring GX 13.0 (Agilent Technologies). Probes not present in any sample were filtered out. A list of the filtered 36,665 probes was used in the statistical analysis.
Tissue or cultured cells RNA isolation and retrotranscription.The corre- sponding tissue (P8 hippocampi for positive PCR controls) was rapidly isolated immediately under tribromoethanol overdose, and stored at
⫺80°C. Tissue was disrupted with a roto-stator homogenizer with Lysis Buffer (Qiagen) containing 0.7% -mercaptoethanol and stored at
⫺80°C until processed. Cultured cells (⬎500,000 cells) were lysed and stored at⫺80°C until processed. Total RNA was isolated using Qiagen RNeasy Mini Kit (Qiagen), following the manufacturer’s instructions, including a DNase treatment step to eliminate genomic DNA residues.
RNA was quantified in a NanoDrop 2000, and 1.5g were retrotrans- cribed using random hexamers (Invitrogen) and Superscript III Reverse Transcriptase kit (Invitrogen), following the manufacturer’s instructions in a Veriti Thermal Cycler (Applied Biosystems).
FACS-sorted cells RNA isolation and retrotranscription. RNA from FACS-sorted microglia (⬍500,000 cells) was isolated by RNeasy Plus micro kit (Qiagen) according to the manufacturer’s instructions, and the
RNA was retrotranscribed using an iScript Advanced cDNA Synthesis Kit (Bio-Rad) following the manufacturer’s instructions in a Veriti Thermal Cycler (Applied Biosystems).
Real-time qPCR. Real-time qPCR was performed following MIQE guidelines (Minimal Information for Publication of Quantitative Real Time Experiments;Bustin, 2010). Three replica of 1.5l of a 1:3 dilution of cDNA were amplified using Power SYBR Green (Bio-Rad) for tissue or cell culture experiments or SsoFast EvaGreen Supermix (Bio-Rad) for FACS-sorted microglia experiments in a CFX96 Touch Real-Time PCR Detection System (Bio-Rad). The amplification protocol for both en- zymes was 3 min 95°C, and 40 cycles of 10 s at 95°C, 30 s at 60°C.
Primers.Primers were designed to amplify exon– exon junctions using PrimerBlast (NIH) to avoid amplification of contaminating genomic DNA, and their specificity was assessed using melting curves and electro- phoresis in 2% agarose gels. Primer sequences are listed inTable 1. For each set of primers, the amplification efficiency was calculated using the software LinRegPCR (Ramakers et al., 2003) or standard curve of 1:2 consecutive dilutions, and was used to calculate the relative amount us- ing the following formula:
⌬⌬
Ct⫽共1
⫹eff䡠
target gene)共Ct sample⫺Ct control兲共
1⫹eff䡠
reference gene)共Ct sample⫺Ct control兲.Up to three independent reference genes were compared: L27A, which encodes a ribosomal protein of the 60S subunit (Sierra et al., 2007);
OAZ-1, which encodes ornithine decarboxylase antizyme, a rate-limiting enzyme in the biosynthesis of polyamines and recently validated as ref- erence gene in rat and human (Kwon et al., 2009); and HPRT, which encodes hypoxanthine guanine phosphoribosyl transferase (van de Moosdijk and van Amerongen, 2016). The expression of L27A, OAZ-1, and HPRT remained constant independently of time and treatments, validating their use as reference genes. In all experiments, the pattern of mRNA expression was similar using the assigned couple of reference genes, and in each experiment the reference gene that rendered lower intragroup variability was used for statistical analysis.
Immunofluorescence. Six series of 50-m-thick coronal sections of mouse brains were cut using a Leica VT 1200S vibrating blade microtome (Leica Microsystems). Fluorescent immunostaining was performed fol- lowing standard procedures (Sierra et al., 2010;Beccari et al., 2018).
Free-floating vibratome sections were blocked in permeabilization solu- tion (0.3% Triton X-100, 0.5% BSA in PBS; all from Sigma-Aldrich) for 3 h at room temperature (RT), and then incubated overnight with the primary antibodies diluted in the permeabilization solution at 4°C. For BrdU labeling an antigen retrieval procedure was performed by incubat- ing in 2MHCl for 30 min at 37°C and then washing with 0.1Msodium tetraborate for 10 min at RT before the blockade of the sections. After overnight incubation with primary antibodies, brain sections were thor- oughly washed with 0.3% Triton in PBS. Next, the sections were incu- bated with fluorochrome-conjugated secondary antibodies and DAPI (5 mg/ml; Sigma-Aldrich) diluted in the permeabilization solution for 3 h at RT. After washing with PBS, the sections were mounted on glass slides with Dako Cytomation Fluorescent Mounting Medium.
Primary microglial cultures were fixed for 10 min in 4% PFA and then transferred to PBS. Fluorescent immunostaining was performed follow- ing standard procedures (Abiega et al., 2016;Beccari et al., 2018). Cov- erslips with primary microglial cultures were blocked in 0.1% Triton X-100, 0.5% BSA in PBS for 30 min at RT. The cells were then incubated with primary antibodies in permeabilization solution (0.2% Triton X-100, 0.5% BSA in PBS) for 1 h at RT, rinsed in PBS and incubated in the secondary antibodies containing DAPI (5 mg/ml) in the permeabiliza- tion solution for 1 h at RT. After washing with PBS, primary cultures were mounted on glass slides with Dako Cytomation Fluorescent Mounting Medium.
For fluorouridine labeling, SH-SY5Y were treated with 2 mM 5⬘- fluorouridine (Sigma-Aldrich) for 30 min. Afterward, cells were fixed in 4% PFA with 0.5% Triton X-100. The immunofluorescence was per- formed as described with primary microglial cultures and anti-BrdU primary antibody was used to detect fluorouridine.
NPC cultures were fixed for 10 min in 4% PFA and then transferred to PBS. Coverslips containing the cells were blocked in blocking solution (0.5%
Triton X-100, 3% BSA in PBS) for 1 h at RT, and then incubated overnight with the primary antibodies diluted in the permeabilization solution (0.2%
Triton X-100, 3% BSA in PBS) at 4°C. After overnight incubation, coverslips were allowed to warm at RT and were thoroughly rinsed in PBS. Next, the coverslips were incubated with fluorochrome-conjugated secondary antibodies andDAPI(5mg/ml;Sigma-Aldrich)dilutedinthepermeabilizationsolutionfor 2 h at RT. After washing with PBS, the coverslips were mounted on glass slides with Dako Cytomation Fluorescent Mounting Medium.
Western blot.CM-treated NPCs were directly lysed in RIPA buffer containing protease and phosphatase inhibitor cocktail (100⫻; Thermo- Fisher Scientific). Cells were sonicated for 5 s and then centrifuged (10,000⫻g, 10 min). Solubilized protein was quantified in triplicates by BCA Assay Kit (ThermoFisher Scientific) at 590 nm using a microplate reader (Synergy HT, BioTek). Ten to 15g of protein (denatured with
-mercaptoethanol) were loaded onto Tris-glycine gradient polyacryl- amide gels (8 –16%; ThermoFisher Scientific) and run at 120 V for 90 min. Protein samples were then blotted to nitrocellulose membranes (0.45m pore size; ThermoFisher Scientific) at 220 mA for 2 h. Transfer efficiency was verified by Ponceau S (Sigma-Aldrich) staining. For im- munoblotting, membranes were rinsed in Tris-Buffered Saline contain- ing 0.1% Tween 20 (TBS-T; Sigma-Aldrich) and then blocked for 1 h in TBS-T containing 5% powder milk. Membranes were afterward incu- bated with rabbit primary antibodies for REST (1:500; EMD, Millipore), and phosphorylated Smad 1/5/9 (1:500; Cell Signaling Technology), and mouse primary antibodies for Smad 1 (1:500; Santa Cruz Biotechnol- ogy), Ascl1 (1:500; BD Biosciences), and -actin (1:5000; Sigma- Aldrich), in TBS-T containing 4% BSA overnight (4°C, shaker). Next day, membranes were rinsed and incubated with horseradish peroxidase- conjugated anti-rabbit (1:5000) and anti-mouse (1:5000) secondary an- tibodies (Cell Signaling Technology) in TBS-T containing 5% powder Table 1. qPCR primer sequences
Gene Gene Bank Amplicon size Sequence 5⬘-3⬘
Reference genes OAZ1 NM_008753 51 Fwd AGCGAGAGTTCTAGGGTTGCC
Rev CCCCGGACCCAGGTTACTAC
L27A BC086939 101 Fwd TGTTGGAGGTGCCTGTGTTCT
Rev CATGCAGACAAGGAAGGATGC
HPRT NM_013556.2 150 Fwd ACAGGCCAGACTTTGTTGGA
Rev ACTTGCGCTCATCTTAGGCT
Phagocytosis receptors P2Y12 NM_027571 88 Fwd GCAGAACCAGGACCATGGAT
Rev CTGACGCACAGGGTGCTG
MerTK NM_008587.1 131 Fwd AAGGTCCCCGTCTGTCCTAA
Rev GCGGGGAGGGGATTACTTTG
Axl NM_009465.4 86 Fwd GTTGGTGTCTGGAGGATGGG
Rev TGTGTGTCCTTATGGGCTGC
Peptides and hormones VGF NM_001039385.1 74 Fwd CACCGGCTGTCTCTGGC
Rev AAGGAAGCAGAAGAGGACGG
Cartpt NM_013732.7 106 Fwd GCGCTATGTTGCAGATCGAAG
Rev GCGTCACACATGGGGACTTG
FGF2 NM_008006.2 113 Fwd CGGCTGCTGGCTTCTAAGTG
Rev AGTGCCACATACCAACTGGAG
Trophic factors VEGFA NM_001025250.3 88 Fwd GGCCTCCGAAACCATGAACT
Rev CTGGGACCACTTGGCATGG
PDGF␣ NM_008808.3 94 Fwd TACCCCGGGAGTTGATCGAG
Rev TCAGCCCCTACGGAGTCTATC
IGF-1 NM_010512.4 122 Fwd TTACTTCAACAAGCCCACAGG
NM_184052.3 Rev GTGGGGCACAGTACATCTCC
NM_001111274.1 NM_001111275.1 NM_001111276.1
EGF NM_010113.3 136 Fwd GGACTGAGTTGCCCTGACTC
Rev CAATATGCATGCACACGCCA
GDNF NM_010275.2 145 Fwd CGCTGACCAGTGACTCCAA
Rev TGCCGATTCCTCTCTCTTCG
Matrix protein Mmp3 NM_010809.2 88 Fwd ACCCAGTCTACAAGTCCTCCA
Rev GGAGTTCCATAGAGGGACTGA
Surface ligands Jag1 NM_013822.5 119 Fwd TTCAGGGCGATCTTGCATCA
Rev CACACCAGACCTTGGAGCAG
Dll4 NM_019454.3 113 Fwd GGTTACACAGTGAGAAGCCAGA
Rev GGCAATCACACACTCGTTCC
Cytokines Csf3 NM_009971.1 70 Fwd GCAGCCCAGATCACCCAGAAT
Rev TGCAGGGCCATTAGCTTCAT
IL1 NM_000576.2 72 Fwd AGATGAAGTGCTCCTTCCAGG
Rev GGTCGGAGATTCGTAGCTGG
IL6 NM_000600.3 107 Fwd GAAAGCAGCAAAGAGGCACTG
Rev TTCACCAGGCAAGTCTCCTCAT
TNF␣ NM_000594.3 142 Fwd TGCACTTTGGAGTGATCGGC
Rev GCTTGAGGGTTTGCTACAACA
TGF NM_000660.5 112 Fwd TCCTGGCGATACCTCAGCAA
Rev CAATTTCCCCTCCACGGCTC List of primers used to amplify reference genes, phagocytosis receptors, peptides and hormones, trophic factors, matrix protein, surface ligands, and cytokines. The gene name, Gene Bank accession number, amplicon size, and sequence are listed.
milk. After rinsing membranes, protein was visualized by enhanced chemiluminescence using Supersignal West Femto Maximum Sensitivity Substrate (ThermoFisher Scientific) in a ChemiDoc imaging system (Bio-Rad). Band intensity was quantified using the Gel Analyzer method of Fiji software. Phospho-Smad 1/5/9 levels were normalized to total levels of Smad 1.-actin was used as loading control.
Image analysis.All fluorescence immunostaining images were col- lected using an Olympus FluoView or a Leica SP8 laser-scanning micro- scope using a 40⫻oil-immersion objective and az-step of 0.7m. All images were imported into Adobe Photoshop 7.0 in Tiff format. Bright- ness, contrast, and background were adjusted equally for the entire image using the “brightness and contrast” and “levels” controls from the “im- age/adjustment” set of options without any further modification. For tissue sections, two to three 20-m-thickz-stacks of the sections contain- ing the septal hippocampus from one vibratome series was analyzed (usually 6 slices, spanning from⫺1 to⫺2.5 mm in the AP axes, from bregma), to avoid variability due to the differential regulation of neuro- genesis in the septal and temporal regions of the hippocampus. For pri- mary cultures, over 4 –5z-stacks were obtained per coverslip.
Phagocytosis analysisin vivoandin vitro. The analysis of phagocytosis in vivowas performed as described in a series containing the six most
septal sections (Abiega et al., 2016;Beccari et al., 2018). Apoptotic cells were defined based on their nuclear morphology after DAPI staining as cells in which the chromatin structure (euchromatin and heterochroma- tin) was lost and appeared condensed and/or fragmented (pyknosis/
karyorrhexis). Phagocytosis was defined as the formation of an enclosed, three-dimensional pouch of microglial processes surrounding an apo- ptotic cell. In tissue sections, the number of apoptotic cells, phagocytosed cells, BrdU⫹cells, and microglia were estimated using unbiased stereol- ogy in the volume of the DG contained in thez-stack (determined by multiplying the thickness of the stack by the area of the DG at the center of the stack using ImageJ, Fiji). To obtain the absolute numbers, this density value was then multiplied by the volume of the septal hippocam- pus (spanning from⫺1 to⫺2.5 mm in the AP axes, from bregma;⬃6 slices in each of the 6 series), which was calculated using Fiji from a Zeiss Axiovert epifluorescent microscope images collected at 20⫻.In vitro, the percentage of phagocytic microglia was defined as cells with pouches containing apoptotic SH-SY5Y nuclei and/or CM-DiI particles (Beccari et al., 2018).
Neurogenesis analysisin vivoandin vitro. The analysis of neurogenesis in vivowas performed as described previously (Encinas and Enikolopov, 2008;Abiega et al., 2016;Beccari et al., 2018). Six sections from one series Table 2. Statistics forFigures 1and2
Figure Parameter Groups Statistical test Statistic p
1B Ph index WT vs P2Y12 KO (1 m⫹1 d) Unpairedttest t(6)⫽13.5 p⬍0.001
Ph capacity Unpairedttest t(6)⫽5.08 p⫽0.002
Apoptosis Unpairedttest t(6)⫽1.17 p⫽0.287
Microglia Unpairedttest t(6)⫽ ⫺0.05 p⫽0.964
1C Ph index WT vs MerTK/Axl KO (1 m) Unpairedttest t(4)⫽ ⫺3.97 p⬍0.001
Ph capacity Unpairedttest t(4)⫽2.90 p⫽0.044
Apoptosis Unpairedttest t(4)⫽ ⫺3.97 p⫽0.017
Microglia Unpairedttest t(4)⫽0.98 p⫽0.382
1E Neuroblasts WT vs P2Y12 KO (1 m⫹1 d) Unpairedttest t(6)⫽10.83 p⬍0.001
Proliferating Neuroblasts Unpairedttest t(6)⫽3.51 p⫽0.013
1F Neuroblasts WT vs MerTK/Axl KO (1 m) Unpairedttest t(4)⫽2.97 p⫽0.041
Proliferating Neuroblasts Unpairedttest t(4)⫽0.38 p⫽0.723
2B Newborn cells WT vs P2Y12 KO (1 m⫹4 w) Unpairedttest t(8)⫽2.72 p⫽0.026
Newborn neurons Unpairedttest t(8)⫽2.68 p⫽0.028
2C Ph index WT vs P2Y12 KO (1 m⫹4 w) Unpairedttest t(6)⫽7.45 p⬍0.001
Ph capacity Unpairedttest t(6)⫽9.93 p⬍0.001
Apoptosis Unpairedttest t(6)⫽1.17 p⫽0.287
Microglia Unpairedttest t(6)⫽ ⫺0.05 p⫽0.964
2E Ph index WT vs P2Y12 KO (7 m) Unpairedttest t(8)⫽4.21 p⫽0.003
Apoptosis Unpairedttest t(8)⫽ ⫺0.18 p⫽0.863
Microglia Unpairedttest t(8)⫽ ⫺0.95 p⫽0.375
2G Neuroblasts Unpairedttest t(8)⫽3.14 p⫽0.014
2I P2Y12 GFP⫹vs GFP⫺ Unpairedttest t(4)⫽552,3 p⬍0.001
MerTK Unpairedttest t(4)⫽14.91 p⬍0.001
Axl Unpairedttest t(4)⫽1.82 p⫽0.144
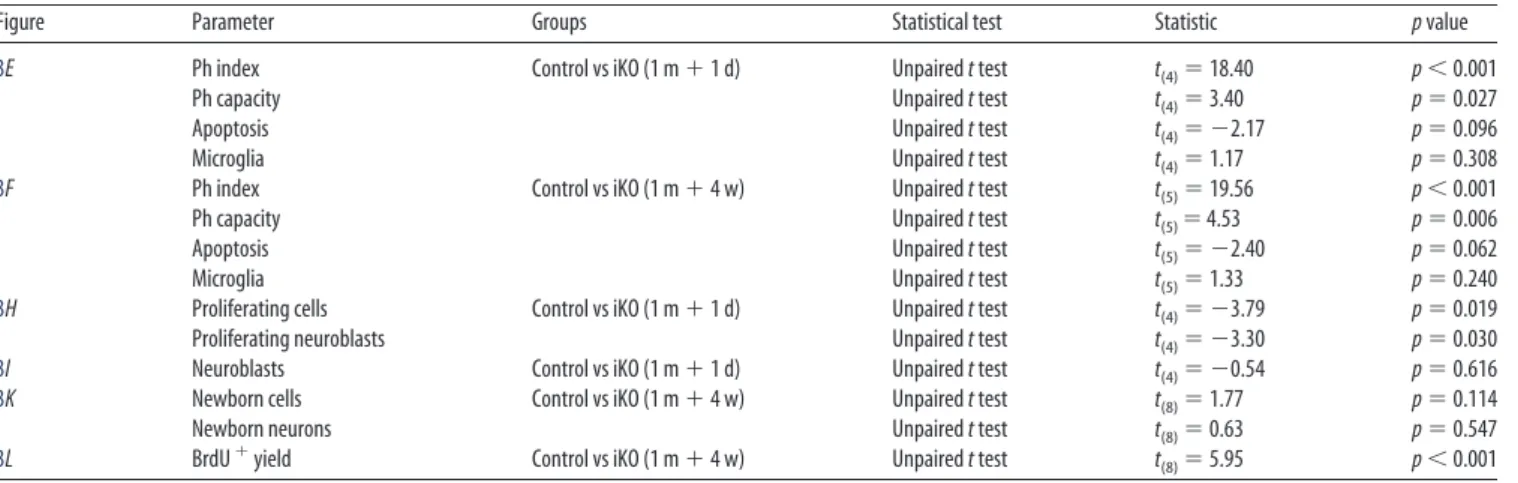
Table 3. Statistics forFigure 3
Figure Parameter Groups Statistical test Statistic pvalue
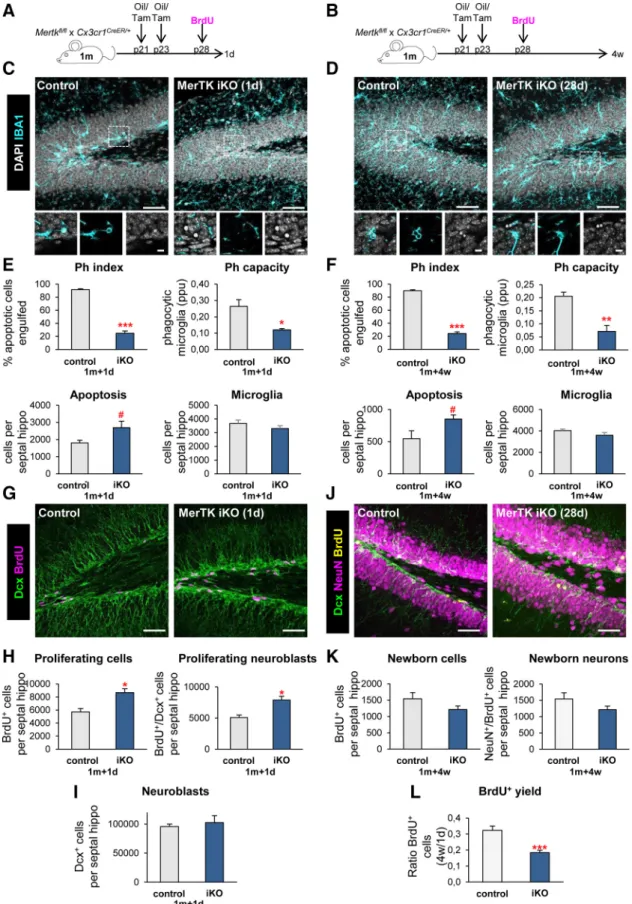
3E Ph index Control vs iKO (1 m⫹1 d) Unpairedttest t(4)⫽18.40 p⬍0.001
Ph capacity Unpairedttest t(4)⫽3.40 p⫽0.027
Apoptosis Unpairedttest t(4)⫽ ⫺2.17 p⫽0.096
Microglia Unpairedttest t(4)⫽1.17 p⫽0.308
3F Ph index Control vs iKO (1 m⫹4 w) Unpairedttest t(5)⫽19.56 p⬍0.001
Ph capacity Unpairedttest t(5)⫽4.53 p⫽0.006
Apoptosis Unpairedttest t(5)⫽ ⫺2.40 p⫽0.062
Microglia Unpairedttest t(5)⫽1.33 p⫽0.240
3H Proliferating cells Control vs iKO (1 m⫹1 d) Unpairedttest t(4)⫽ ⫺3.79 p⫽0.019
Proliferating neuroblasts Unpairedttest t(4)⫽ ⫺3.30 p⫽0.030
3I Neuroblasts Control vs iKO (1 m⫹1 d) Unpairedttest t(4)⫽ ⫺0.54 p⫽0.616
3K Newborn cells Control vs iKO (1 m⫹4 w) Unpairedttest t(8)⫽1.77 p⫽0.114
Newborn neurons Unpairedttest t(8)⫽0.63 p⫽0.547
3L BrdU⫹yield Control vs iKO (1 m⫹4 w) Unpairedttest t(8)⫽5.95 p⬍0.001
containing the septal hippocampus were analyzed in all experiments ex- cept in mice injected with microglia CM, in which only the three tissue sections closest to the injection site were analyzed. Proliferation was assessed by BrdU⫹cell quantification; neural stem cells were identified by the expression of the markers Nestin and glial fibrillary acidic protein (GFAP) and their radial morphology for cell quantification; neuroblast were assessed by doublecortin (DCX)⫹cell quantification and morphol- ogy to classify them in AB, CD, or EF neuroblasts (Plu¨mpe et al., 2006);
neurons were assessed by NeuN⫹cell quantification. The proliferation of either of these populations was assessed by their mentioned staining combined with BrdU. Numbers of cells were estimated using unbiased stereology in the volume of the DG of thez-stack, which was determined
by multiplying the thickness of thez-stack (12m) by the area of the DG at the center of the stack using the software ImageJ (Fiji).In vitro, the effect of microglia-derived conditioned media on neuroprogenitor cells was analyzed considering both their morphology and the expression of cell-specific markers. Percentages of the different morphologies present in the population were obtained as well as the percentages of the different cell markers (nestin, GFAP, DCX, S100) per morphology.
Statistical analysis.SigmaPlot (Systat Software) was used for statistical analysis. Data were tested for normality and homoscedasticity. When the data did not comply with these assumptions, a logarithmic transforma- tion was performed and the data were analyzed using parametric tests. In the case of IL-6 mRNA expression, normality was not achieved with the Table 4. Statistics forFigure 8
Figure Parameter Groups Statistical test Statistic p
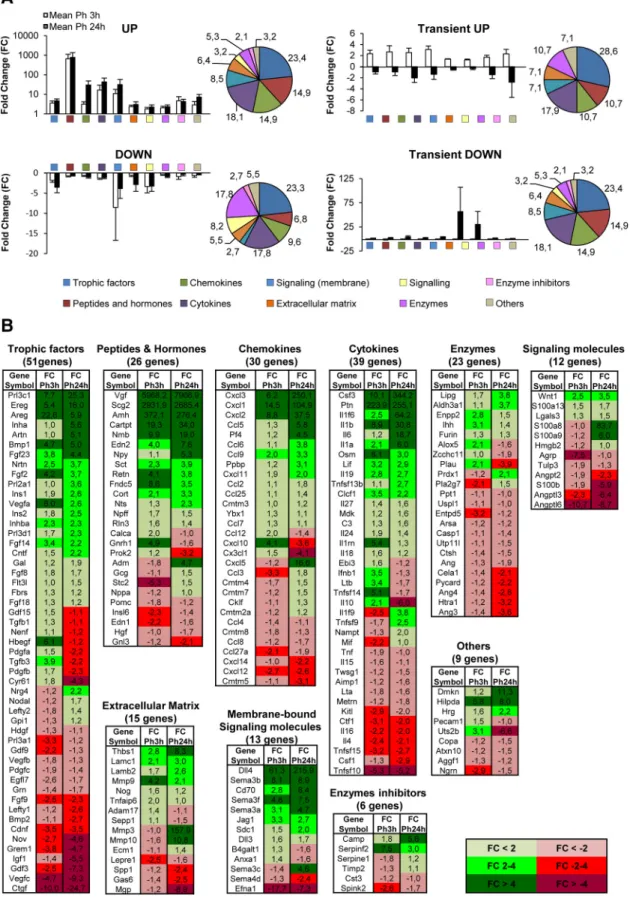
8C VGF (log10) C vs Ph3 h vs Ph24 h One-way ANOVA F(2,9)⫽527.4 p⬍0.001
Cartpt (log10) One-way ANOVA F(2,8)⫽19.37 p⬍0.001
FGF2 One-way ANOVA F(2,9)⫽5.55 p⫽0.027
VEGF (log10) One-way ANOVA F(2,9)⫽89.23 p⬍0.001
PDGFa (log10) One-way ANOVA F(2,9)⫽5.57 p⫽0.027
IGF1 (log10) One-way ANOVA F(2,9)⫽153.2 p⬍0.001
EGF (log10) One-way ANOVA F(2,9)⫽4.99 p⫽0.035
GDNF (log10) One-way ANOVA F(2,9)⫽128.8 p⬍0.001
Mmp3 (log10) One-way ANOVA F(2,9)⫽147.9 p⬍0.001
Jag1 One-way ANOVA F(2,9)⫽15.26 p⫽0.001
Csf3 (log10) One-way ANOVA F(2,9)⫽242.7 p⬍0.001
IL-1(log10) One-way ANOVA F(2,9)⫽86.82 p⬍0.001
IL-6 Kruskal–Wallis H(2)⫽0.20 p⫽0.011
TNF␣(log10) One-way ANOVA F(2,9)⫽25.50 p⬍0.001
TFG(log10) One-way ANOVA F(2,9)⫽29.04 p⬍0.001
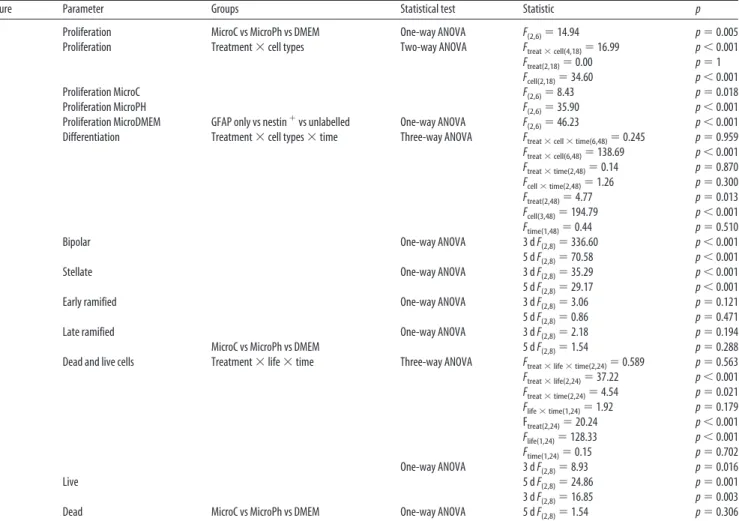
Table 5. Statistics forFigure 9
Figure Parameter Groups Statistical test Statistic p
9C Proliferation MicroC vs MicroPh vs DMEM One-way ANOVA F(2,6)⫽14.94 p⫽0.005
9D Proliferation Treatment⫻cell types Two-way ANOVA Ftreat⫻cell(4,18)⫽16.99 p⬍0.001
Ftreat(2,18)⫽0.00 p⫽1
Fcell(2,18)⫽34.60 p⬍0.001
Proliferation MicroC
GFAP only vs nestin⫹vs unlabelled One-way ANOVA
F(2,6)⫽8.43 p⫽0.018
Proliferation MicroPH F(2,6)⫽35.90 p⬍0.001
Proliferation MicroDMEM F(2,6)⫽46.23 p⬍0.001
9F Differentiation Treatment⫻cell types⫻time Three-way ANOVA Ftreat⫻cell⫻time(6,48)⫽0.245 p⫽0.959
Ftreat⫻cell(6,48)⫽138.69 p⬍0.001
Ftreat⫻time(2,48)⫽0.14 p⫽0.870
Fcell⫻time(2,48)⫽1.26 p⫽0.300
Ftreat(2,48)⫽4.77 p⫽0.013
Fcell(3,48)⫽194.79 p⬍0.001
Ftime(1,48)⫽0.44 p⫽0.510
Bipolar
MicroC vs MicroPh vs DMEM
One-way ANOVA 3 dF(2,8)⫽336.60 p⬍0.001
5 dF(2,8)⫽70.58 p⬍0.001
Stellate One-way ANOVA 3 dF(2,8)⫽35.29 p⬍0.001
5 dF(2,8)⫽29.17 p⬍0.001
Early ramified One-way ANOVA 3 dF(2,8)⫽3.06 p⫽0.121
5 dF(2,8)⫽0.86 p⫽0.471
Late ramified One-way ANOVA 3 dF(2,8)⫽2.18 p⫽0.194
5 dF(2,8)⫽1.54 p⫽0.288
9H Dead and live cells Treatment⫻life⫻time Three-way ANOVA Ftreat⫻life⫻time(2,24)⫽0.589 p⫽0.563
Ftreat⫻life(2,24)⫽37.22 p⬍0.001
Ftreat⫻time(2,24)⫽4.54 p⫽0.021
Flife⫻time(1,24)⫽1.92 p⫽0.179
Ftreat(2,24)⫽20.24 p⬍0.001
Flife(1,24)⫽128.33 p⬍0.001
Ftime(1,24)⫽0.15 p⫽0.702
One-way ANOVA 3 dF(2,8)⫽8.93 p⫽0.016
Live
MicroC vs MicroPh vs DMEM
5 dF(2,8)⫽24.86 p⫽0.001
3 dF(2,8)⫽16.85 p⫽0.003
Dead One-way ANOVA 5 dF(2,8)⫽1.54 p⫽0.306
logarithmic transformation and the data were analyzed using a Kruskal–
Wallis ranks test, followed by Tukey test as apost hoc. In the rest of the cases, two-sample experiments were analyzed by Student’sttest and more than two-sample experiments by ANOVA. In two-way and three- way ANOVA, when interactions between factors were found, the analysis of the relevant variable was split into several one-way ANOVAs and Holm–Sidak method was used as apost hoc. The transformation used (if any), the test used, the comparison performed, the value of the statistical and thepvalues are shown inTables 2–5and7–9. Onlyp⬍0.05 is reported to be significant. Data are shown as mean⫾SEM.
Statistical analysis of gene expression arrays.To analyze the differential expression between naive (t⫽0) and phagocytic (t⫽3 h andt⫽24 h) microglia groups over time the statistical analysis the maSigPro package of R/Bioconductor was used (R v3.0.3, Bioconductor release v2.13, maSigPro v1.34.1;Conesa et al., 2006). This method is based on a general regression approximation for the modeling and adjustment of the pa- rameters required according to the type of analysis. The parameter
“Time” is considered as a continuous variable, and creates a regression model of the gene response. The analysis was performed in three steps.
First, genes that exhibited changes in expression over time were selected based on ap-corrected Benjamini–Hochberg (FDR) value. Next, for each of the genes that presented a significant change in their expression over time a regression was applied to determine their model (R2⬎0.7) to identify patterns or models of change based on time variables, obtaining 20,800 probes. Finally, the probes were selected according to their fit to the regression model. Next, the number of genes with a very high differ- ential pattern was reduced by applying a more restrictive criterion (R2⬎ 0.9), obtaining 13,146. TheR2⬎0.7 list was used for the identification of neurogenesis related genes and theR2⬎0.9 list was used for the study of transcriptional profile of phagocytic microglia.
DAVID.The database for annotation, visualization, and integrated discovery (DAVID;https://david.ncifcrf.gov/) v6.8 provides a compre-
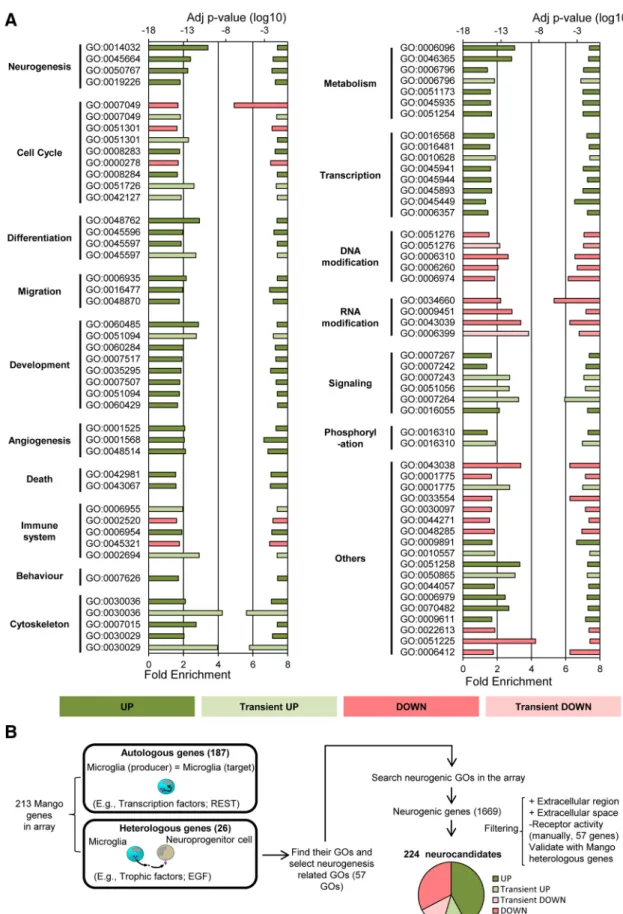
hensive set of functional annotation tools to understand biological meaning behind large list of genes. DAVID was used to generate a gene-GO term enrichment analysis that identified enriched biological themes and to highlight the most relevant GO terms associated with the array gene list. The array gene list ofR2⬎0.9 was used for this gene profile analysis. The analysis of each expression pattern was performed separately and only terms with an adjustedpvalue (Benjamini–Hoch- berg)⬎0.05 were considered significant.
ClueGO.ClueGO was used to generate protein pathways and to con- stitute the network of pathways based on the Gene Ontology and KEGG database (Bindea et al., 2013). ClueGO is a plugin of Cytoscape (http://
www.cytoscape.org/) that visualizes the non-redundant biological terms for large clusters of genes in a functionally grouped network. A ClueGO network is created withstatistics and reflects the relationships between the terms based on the similarity of their associated genes (Mlecnik et al., 2018). Gene ontology (GO) analysis of mouse array data were performed with ClueGO v1.4 (Bindea et al., 2013) using the following parameters:
enrichment/depletion two-sided hypergeometric statistical test; correc- tion method: Benjamini–Hochberg; GO term range levels: 3– 8; minimal number of genes for term selection: 10; minimal percentage of genes for term selection: 10%;-score threshold: 0.8; general term selection meth- od: smallestpvalue; group method:; minimal number of subgroups included in a group: 3; minimal percentage of shared genes between subgroups: 50%.
Results
Chronic impairment of microglial phagocytosis reduces adult hippocampal neurogenesis
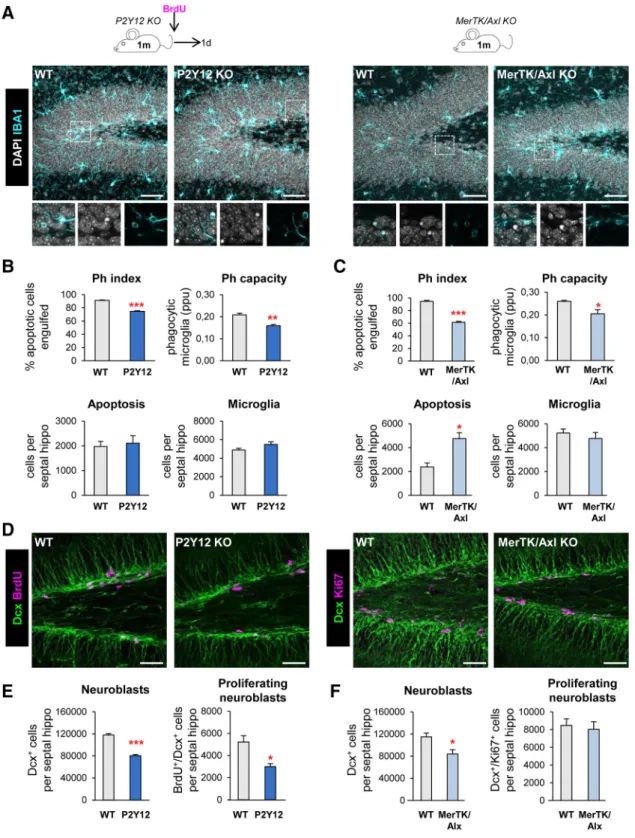
To examine the impact of microglial phagocytosis on adult hip- pocampal neurogenesis
in vivo, we focused on two signalingpathways involved on phagocytosis: P2Y12 (purinergic receptor type Y12), which mediates chemotaxis toward the “find-me” sig- nal ADP (Haynes et al., 2006); and the TAM family tyrosine kinases MerTK and Axl, which bind to phosphatidylserine adapt- er/bridging molecules: growth arrest specific factor 6 and protein S (Elliott et al., 2009; Fourgeaud et al., 2016). We used two trans- genic mouse models in which these proteins are constitutively knocked out (P2Y12 KO and MerTK/Axl KO). We decided to study the impact of phagocytosis in young mice (1 month old), as neurogenesis and apoptosis of newborn cells and subsequent phagocytosis by microglia rapidly declines with age (Sierra et al., 2010; Beccari et al., 2017). Apoptotic cells were defined as py- knotic/karyorrhectic nuclei labeled with the DNA dye DAPI, which we have previously characterized to express other apopto- sis markers such as activated caspase 3 and fractin (Sierra et al., 2010). First, we assessed phagocytosis in the hippocampus of the two KO models by quantifying the Ph index (the percentage of apoptotic cells engulfed by microglia), which is
⬃90% in physi- ological conditions (Abiega et al., 2016), and found significantly lower Ph index in the two KO models (74.8
⫾0.9% for P2Y12, 61.5
⫾1.6% for MerTK/Axl; Fig. 1A–C). In addition, the micro- glial Ph capacity (weighted average of the number of pouches containing apoptotic cells per microglia, i.e., the average number of phagocytic pouches per microglia) was significantly reduced in both KO models (Fig. 1A–C). Nonetheless, we found no changes in the number of microglia and the phagocytosis reduction was small, possibly because of compensatory mechanisms resulting from the chronic depletion, and we only detected the expected increase of apoptotic cells in MerTK/Axl KO mice (Fig. 1A–C), possibly indicating not a complete dysfunction but a slowdown of phagocytosis.
Next, we examined hippocampal neurogenesis in these phagocytosis impaired KO models and observed that the two showed a significant decrease in the population of neuroblasts and immature neurons, labeled with DCX, compared to wild-
Table 6. Functional analysis of the phagocytic microglia transcriptome revealschanges in apoptosis Gene
symbol
FC Ph3h
FC
Ph24 h Location
Effect on apoptosis
PRDX1 1,1 2 Autologous Anti-apoptotic
SIRT1 2 1,6 Autologous Anti-apoptotic
SMO 1 3,6 Autologous Anti-apoptotic
SOD2 1,2 2 Autologous Anti-apoptotic
SPHK1 4,4 1,6 Autologous Anti-apoptotic
UBE2B 1,4 1,5 Autologous Anti-apoptotic
XRCC5 2,1 3,8 Autologous Anti-apoptotic
PRNP 1,8 1,3 Auto/Hetero Anti-apoptotic
TGM2 5,5 4,5 Auto/Hetero Anti-apoptotic
CNTF 1,5 2,6 Heterologous Anti-apoptotic
FGF2 4,2 3,7 Heterologous Anti-apoptotic
FGF8 1,7 1,6 Heterologous Anti-apoptotic
VEGFA 4,5 1,8 Heterologous Anti-apoptotic
RARG 1,3 3 Autologous Pleiotropic
IL6 18,7 15,8 Heterologous Pleiotropic
BAD 1,8 2,2 Autologous Proapoptotic
FAS 1,5 1,5 Autologous Proapoptotic
FOXO3 21 38 Autologous Proapoptotic
GAS1 2,7 3 Autologous Proapoptotic
NLRP3 12 19 Autologous Proapoptotic
PPP2CB 1,5 1,6 Autologous Proapoptotic
PTEN 1,1 1,6 Autologous Proapoptotic
RHOA 1 1,7 Autologous Proapoptotic
SCRIB 1,9 2,4 Autologous Proapoptotic
STK3 1 1,5 Autologous Proapoptotic
TFPT 2,4 3 Autologous Proapoptotic
GAL 1,2 1,8 Heterologous Proapoptotic
IL1 8,9 30,7 Heterologous Proapoptotic
Classification of the genes related to cell death obtained from DAVID analysis. The genes were classified according to their FC, to the effects on microglia (autologous), or on the surrounding cells (heterologous) and to the positive or negative effect on apoptosis.
type (WT) controls. In addition, we assessed proliferation by quantifying the number of dividing cells using either BrdU, an analog of thymidine that gets incorporated into the DNA during S phase of dividing cells (mice were injected with 150 mg/kg and killed 24 h later); or the proliferation marker Ki67
⫹(Scholzen and Gerdes, 2000). P2Y12 KO mice had a decrease in both neu- roblasts (reduction of 31.7
⫾2.7%) and neuroblast proliferation (reduction of 39.3
⫾9.8%), and MerTK/Axl KO mice showed a reduction in neuroblasts (reduction of 26.2
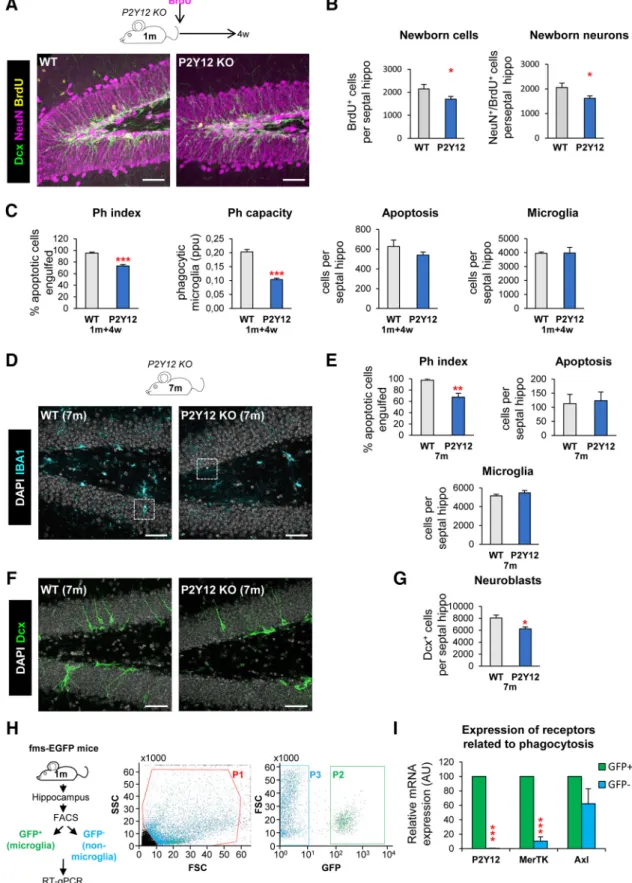
⫾9.4%) compared to WT mice (Fig. 1D–F ). We further studied the formation of new- born neurons using BrdU pulse-and-chase in the most robust model, the P2Y12 KO. Four weeks after the BrdU injection, when the mice were 2 months old, both total BrdU
⫹cells and newborn neurons (NeuN
⫹/BrdU
⫹) were reduced in P2Y12 KO mice compared to WT mice (reduction of 24.6
⫾9.7%; Fig. 2
A,B), inparallel to a decrease in phagocytosis (Ph index and Ph capacity) and no changes in apoptosis nor microglia (Fig. 2C). The defect in neurogenesis was maintained later in life, because at 7 months,
P2Y12 KO mice still showed a significant reduction in phagocy- tosis (Ph index) without alterations in apoptosis nor microglia (Fig. 2
D,E), in parallel to a reduction in neuroblasts compared toWT mice (Fig. 2
F,G).To confirm the specificity of these results, we analyzed the expression of P2Y12, MerTK, and Axl in FACS-sorted cells from 1-month-old fms-EGFP mice, in which microglia is labeled with EGFP. We found that, P2Y12 and MerTK, but not Axl, were highly expressed in microglia compared with other cells of the hippocampal parenchyma (Fig. 2H,I ), suggesting that the dis- ruption of neurogenesis in the KO models might be attributable to the lack of these receptors in microglia. These receptors regu- late multiple features of microglial physiology (Elliott et al., 2009;
Fourgeaud et al., 2016). In addition, constitutive MerTK/Axl KO mice show autoimmune diseases (Rothlin and Lemke, 2010), as both MerTK and Axl are highly expressed in peripheral macro- phages (http://rstats.immgen.org/Skyline/skyline.html). In addi- tion, in the brain Axl is also expressed in astrocytes (http://
Table 7. Statistics forFigure 10
10F Dead and live cells (log10) Treatment⫻life⫻time Three-way ANOVA Ftreat⫻life⫻time(4,18)⫽0.595 p⫽0.671
Ftreat⫻life(4,18)⫽4.656 p⬍0.009
Ftreat⫻time(2,18)⫽0.265 p⫽0.770
Flife⫻time(2,18)⫽1.481 p⫽0.254
Ftreat(2,18)⫽0.544 p⫽0.590
Flife(2,18)⫽50.494 p⬍0.001
Ftime(1,18)⫽0.695 p⫽0.415
Live MicroC vs MicroPh vs DMEM One-way ANOVA 5 d (log10)F(2,6)⫽8.774 p⫽0.017
9 dF(2,6)⫽14.103 p⫽0.005
Dead One-way ANOVA 5 dF(2,6)⫽1.476 p⫽0.301
9 dF(2,6)⫽8.563 p⫽0.017
10G Bipolar MicroC vs MicroPh vs DMEM Kruskal Wallis 5 dH(2)⫽7.624 p⫽0.071
9 dH(2)⫽7.624 p⫽0.071
Stellate Kruskal Wallis 5 dH(2)⫽5.956 p⫽0.025
One-way ANOVA 9 dF(2,6)⫽15.331 p⫽0.004
Early ramified One-way ANOVA 5 dF(2,6)⫽1.469 p⫽0.303
Kruskal Wallis 9 dH(2)⫽2.000 p⫽0.829
5 dF(2,6)⫽7.249 p⫽0.025
Late ramified One-way ANOVA 9 dF(2,6)⫽1.880 p⫽0.232
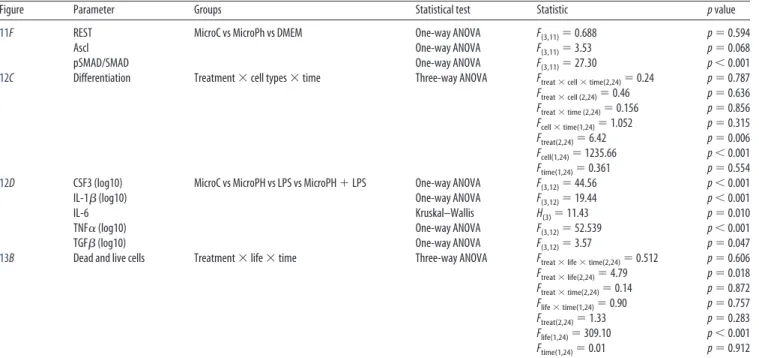
Table 8. Statistics forFigures 11–13
Figure Parameter Groups Statistical test Statistic pvalue
11F REST MicroC vs MicroPh vs DMEM One-way ANOVA F(3,11)⫽0.688 p⫽0.594
Ascl One-way ANOVA F(3,11)⫽3.53 p⫽0.068
pSMAD/SMAD One-way ANOVA F(3,11)⫽27.30 p⬍0.001
12C Differentiation Treatment⫻cell types⫻time Three-way ANOVA Ftreat⫻cell⫻time(2,24)⫽0.24 p⫽0.787
Ftreat⫻cell (2,24)⫽0.46 p⫽0.636
Ftreat⫻time (2,24)⫽0.156 p⫽0.856
Fcell⫻time(1,24)⫽1.052 p⫽0.315
Ftreat(2,24)⫽6.42 p⫽0.006
Fcell(1,24)⫽1235.66 p⬍0.001
Ftime(1,24)⫽0.361 p⫽0.554
12D CSF3 (log10) MicroC vs MicroPH vs LPS vs MicroPH⫹LPS One-way ANOVA F(3,12)⫽44.56 p⬍0.001
IL-1(log10) One-way ANOVA F(3,12)⫽19.44 p⬍0.001
IL-6 Kruskal–Wallis H(3)⫽11.43 p⫽0.010
TNF␣(log10) One-way ANOVA F(3,12)⫽52.539 p⬍0.001
TGF(log10) One-way ANOVA F(3,12)⫽3.57 p⫽0.047
13B Dead and live cells Treatment⫻life⫻time Three-way ANOVA Ftreat⫻life⫻time(2,24)⫽0.512 p⫽0.606
Ftreat⫻life(2,24)⫽4.79 p⫽0.018
Ftreat⫻time(2,24)⫽0.14 p⫽0.872
Flife⫻time(1,24)⫽0.90 p⫽0.757
Ftreat(2,24)⫽1.33 p⫽0.283
Flife(1,24)⫽309.10 p⬍0.001
Ftime(1,24)⫽0.01 p⫽0.912