An Attempt to Assess the Impact of Global Warming on Mountainous Regions Using
the Representation of Landscapes in Paintings
DEmETER, GáBoRa – NoVáK, TIBoRb – NéGyESI, GáBoRb
a: Research Centre for the Humanities 1097 Budapest, Tóth Kálmán u. 4.
E-mail: demeter.gabor@btk.mta.hu
b: University of Debrecen, Dept. of Physical Geography and GIS 4032 Debrecen, Egyetem tér 1.
Three topics comprise the focus of this short essay.1 The first question is a meth- odological one: is it possible to separate landscape-changes induced by anthro- pogenic processes from those that are triggered by climatic changes, and if so, to what extent? In this particular case, this is a question of whether it is possible to distinguish between the impact of grazing and any landscape changes occasioned by global warming (which is, in turn, in some degree due to human activity). In the absence of a deeper knowledge of ecology or an acquaintance with statistical and comparative methods, neither climatologists nor historians are able to answer this question. Research based on only one of these two pillars might give a biased result, and research into the history of the environment requires either a level of multidisciplinary training and skills which is nigh-on impossible for one individual to attain, or it requires teamwork.
The second question is also methodological, and concerns whether, in the absence of systematically sampled data series, it is possible to arrive at firm conclusions on the basis of sporadic data with the assistance of speculative thinking.
The third question is whether paintings can be used as sources for the climatic conditions prevailing at the time of their creation. In the case of sudden and dramatic events, climatic anomalies with global aspect, the answer is evidently yes. A well- known example is the prevalence of darker tones in Turner’s paintings after 1816, testifying to the effects of the Tambora eruption, and Mary Shelley’s Frankenstein was also influenced by this event. These two sources do not, however, add anything new to the history of the “year without summer”, as a wealth of serial sources is available to facilitate the examination of both the short and long-term effects of the event. The picture of Regensburg, showing the inhabitants skating on the frozen Danube – a rare
1 This study has been supported by the project NKFI FK 128 978, “Knowledge, Landscape, Nation and Empire”.
event – well illustrates the consequences of the cooling of 1877, confirming contem- porary meteorologic measurements.2
However, the aim here is not to seek pictures and other sources in order to confirm existing records; rather, it is to find alternative sources where more conventional ones are non-existent. Clearly, in this role, pictures have only local relevance (even if it is the consequences of global events that are illustrated in them); and as a consequence, regional comparisons are hard to carry out on the basis of paintings and before the era of aerial photographies (1930s) and satellite images (the 1960s). Photography can help trace events as far back to the end of the nineteenth century, but can not illustrate the situation prior to the 1860s. So we have to rely on paintings. Are they appropriate to the task? On the one hand landscape-painting had evolved as a separate discipline by the nineteenth century, but on the other, not all the styles employed were realistic.3 However, some painters leaving their studio for the countryside did depict conditions in a more literal way, and thus documented it. Explorers and travelers of the era – from Cook to Count István Széchenyi – took these painters on their journeys to illustrate their discoveries, including the landscape, flora and fauna or the coast line (to identify bays suitable for harbors, and recognisible landmarks).4
Thomas Ender was a painter of this kind, a sort of “documentarist” of the era.5 Critics agree that the quality of his work was highly consistent; he did not draw more what he saw,6 and romanticism, symbolism or impressionism were far removed from his oeuvre. He was indeed an “academic” painter.7 So, he is an adequate source for the analysis of changes in the landscape.
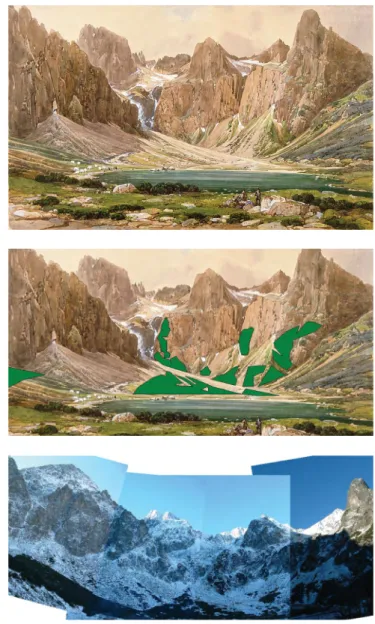
This introduction is necessary in order to establish Ender’s reliability. And from the perspective of the current investigation, the details are extremely impor- tant. In his picture illustrating the Zelené pleso (Green Lake, Zöld-tó) in the High Tatras, painted around 1850, Ender did not depict the shores of the lake as having any vegetation cover (Fig. 1), while the panoramic photo illustrating the same area in 2006 shows a rich, green cover of Pinus mugo (dwarf pine) (Fig. 3). Though the
2 See: Amman 2004: 175, 181. The paintings of Paul Krey and Robert Assmus.
3 In landscape painting, the art historian Anna Szinyei Merse differentiates between the following styles: idealistic (perfect) landscape, romantic landscape, naturalism, realism, plen-air, impressionism, expressionism, surrealism. Among the painters of idealistic landscapes one may find painters illustrating existing landscapes, that they considered as perfect and there were others who painted non-existent landscapes. Ender belonged to the first group. See: http://www.hung-art.hu/vezetes/tajkepek/index.
html.
4 The sketch notebooks of ‘gentlemen’ naturalists, is potentially the most productive source of all, and very probably the most realistic/accurate.
5 Ender won the grand prize of the Academy in Vienna in 1816. He came back from Brazil with more than 1000 paintings. He became professor at the Academy in 1828. His twin brother was a travelling companion of Count Széchenyi during his jouney in the East (1818–1820). It was also his twin, who painted the symbol (coat of arms) of the Hungarian Academy of Sciences – in classical, academic style. See: http://ender.mtak.hu/index_h3.html.
6 See details in Hungarian from Rozsondai 2001.
7 The Hungarian painter, László Mednyánszky was also taught by him. http://ender.mtak.hu/index_
h3.html.
two pictures alone do not allow to directly measure the vertical shift of vegetation zones, the digitization of the tourist map of the area and the overlay of the photo and the painting on a 3D model created from the map-contour lines (by ArcGIS 3.1) allows the measurement of the change. Based on that, the average vertical dif- ference between the abundance of Pinus mugo, that is, the tree line, in 1850, and in 2006 was estimated at 100–200 metres.
The question is, was this a natural reforestation process due to landuse changes, or is it a sign of global warming? Palynologic research did not really help in answering the question. The vertical shift in vegetation zones may give a clue to the measurement
Figure 1. The original painting by Thomas Ender on the surround- ings of the Zelené pleso http://
ender.mtak.hu/ender/index15e.
html / 316 x 495 mm / mTAK, ms 4409/152
Figure 2. The spread of Pinus mugo between 1850 and 2006 drawn on Ender’s painting based on Figure 3.
Figure 3. Panorama picture by the authors from 2006
of the rate of warming, as average temperature decreases by 0.5–0.6°C vertically in 100 metres. Thus the shift of 100–200 metres may correspond to an increase exceeding 1°C in 150 years, which seems to be reasonable.
This value, however, is subject to modification via the impact of other factors.
Furthermore, the area of Zelené pleso was grazed at that time; a herd may be seen in Ender’s painting, and other data from broader region also confirm this local evidence.
A comparison of historical maps reveals that the proportion of forest was highest in 1772 in the Tatras in the investigated period (1772–2010), exceeding 33%, while the share of pastures and bushes (scrubs) was smallest in extent at that time. By 1822 the extent of woodland had decreased by 10%, while the share of pasture increased to a level above 20%. In line with classical correspondence analysis, most of the growth was realized at the cost of forests (5500 ha out of 7400 ha). By 1900, the share of woodland had increased by only 3%, but by 1956 the proportion of pastures had fallen back to 9%, and between 1822 and 1900 half of the area of scrubs (or young forests) was located on abandoned pastures.8
So, as grazing was, according to the data, at its peak in the first half of the nineteenth century, and so before Ender’s painting (Fig. 1) was made, we cannot assess to what extent the painting represents the results of natural progression and to what extent it shows the consequences of grazing. The impact of grazing and climatic changes evidently interfered with each other after the 1870s, but the ques- tion arises of whether these two factors can be separated from each other in terms of their magnitude and exact location. Scholars say that the spread of the dwarf pine above the treeline, as in this case (circa 1500 metres in the Tatras), is caused mainly by climatic changes. This may, however, be modified by exposure, slope angles and microclimatic effects – while their spread below the treeline is mainly a consequence of the abandonment of grazing.9 But this is all theoretical and does not help us: as sheep are illustrated in Ender’s picture, it is necessary to take into account the effect of grazing over the treeline too (Zelené pleso is located around circa 1550 metres above sea level). In other words, the spread of Pinus mugo may also be the result of the abandonment of grazing even at these altitudes. Furthermore, a tourist guide from 1931 mentions another form of human activity widespread in this location at that time which must be taken into account, namely, the cutting down of Pinus mugo to meet the needs of the nearby resin factory.10 Just a few kilometers away from Zelené pleso, at Zadné Meďodoly, dozens of sheep and cattle were observed by the present researchers even in 2006. Furthermore, due to the high copper-ore content of the rocks there, the cutting down of forests was general as early as the eighteenth century. According to a Swiss study, reforestation usually takes place within a zone 300 metres below the treeline, while only 10% of forest aggradation takes place above the treeline. And it is also accepted that the latter phenomenon is caused by changing
8 Boltižiar–Olah 2009: 127–142; Boltižiar–Olah 2010.
9 Solár 2013: Chapter 18.
10 August 1931.
climatic conditions.11In other words, as Zelené pleso is located just above the treeline and the vertical aggradation of Pinus mugo far exceeds this 10%, the spread of the species can not be explained solely by the abandonment of grazing, and the climatic effect must also be appreciable.
Therefore a comparison of the changes observable in the painting and the photo with an investigation of other potentially relevant factors is required. Alas, the resolu- tion of historical military maps is not high enough to permit an accurate delineation of the treeline and establish the exact abundance of Pinus mugo, and cannot thus be used as a reference. Furthermore, the above statistics on land-use changes are derived from an area of 50,000 square kilometres, including the Poprad Basin, too.
High resolution aerial photos and satellite images are available only from 1965. As grazing in highland regions was also prohibited from this year in Slovakia, there was a change in the relative effect of grazing and climate from this point on. While earlier climatic change did not influence treeline (circa 1800–1870), and only grazing was responsible for the shifts, later grazing and climatic change cancelled/balanced each other effect (1870s–1960s), while from 1965 natural succession and climatic changes became the main factors.
One might ask why anyone would insist on attempting to gain any results from a painting which is, after all, artistically speaking, of mediocre quality. The key to the importance of this work is that it illustrates a mountainous environment, and the generally held view in scientific circles is that the quantification of the effects of climate change is easier and more reliable in mountains than on plains;12 and this is because changes both in the altitude of the treeline and in the abundance of relict species can be considered reliable indicators of climatic disturbance. What is more, Pinus mugo is sensitive not only to soil, but to temperature, too. According to Theu- rillat and Guisan the ecosystems of high mountains cannot tolerate climatic changes in excess of 1.5–2°C without a resultant shift in the treeline.13 In Slovakia, in general the average temperature increased by 1.7°C between 1881 and 2007, while average annual precipitation decreased by 24 millimetres, pushing the system to the limits of its tolerance.14 The average annual temperature also increased in the High Tatras between 1901 and 2005.15 Because of the southerly aspect of the slopes, climatically induced changes are much more easily triggered in Slovakia, where the inclination of Sun’s rays is greater, compared to slopes with a shady northerly exposure in Poland.
The difference between the snow-limits can be 500 meters (1800 vs. 2300 metres) due to this microclimatic effect.
According to Solár the progradation of the Pinus mugo between 1965 and 2013 in the High Tatras was 0.4% annually in terms of the surface cover; the spatial pattern of this change was, however, very specific: between 1965 and 1985 Pinus mugo ad-
11 Švajda 2008: 30–33; Gehrig-Fasel et al. 2007: 571–582.
12 Beniston 2003: 5–31; Beniston–Rebetez 1996: 231–243.
13 Theurillat–Guisan 2001: 77–109.
14 Lapin et al. 2005: 101–104; Lapin et al. 2009: 454–459.
15 Solár–Janiga 2014: 51–62.
vanced mainly below the treeline, that is, beneath 1550 metres, while later its advance was predominant on steep slopes above 1550 metres.16 Taking into consideration the previous assumption that succession beneath the treeline is usually the result of the abandonment of grazing, the advance in the last 20 years is evidently of climatic origin, while between 1965 and 1985 the abandonment of grazing also played a role in the advance of Pinus mugo. It is also important to emphasize that the magnitude of temperature change was not uniform over different regions of the mountains. The average temperature has increased by 0.7°C in the last 50 years in the higher regions of the Tatras according to meteorological measurements, whereas this figure was 1.4°C beneath treeline. This change of 0.7°C could cause a shift of 100–120 metres in the treeline even without the effect of the abandonment of grazing (0.5°C = a 100 meter-shift in the treeline or vegetation zone).17
But the difference between what is visible in Ender’s painting and the photo from 2006 is twice as great (Figs. 2–3), reaching 200 metres. The question naturally arises, then, whether it was the abandonment of grazing that was responsible for the other 50% of the difference. Related to this, the impact of climatic change on Pinus mugo before 1965 must also be determined. If an average increase of 1.7°C is accepted for the whole of Slovakia between 1881 and 2000, and this is also accepted as valid for the High Tatras, too,18 then up to 100% of the advance of Pinus mugo between 1850 and 2006 can be explained by climatic change only, while the role of grazing up to 1965 can be interpreted as merely having held off its further advance. A 1.7°C change in temperature between 1880 and 2000 could have caused even a 300 m shift. Since the actual change was only 200 meters, the difference can be explained by the role of grazing between 1850 and 1965.
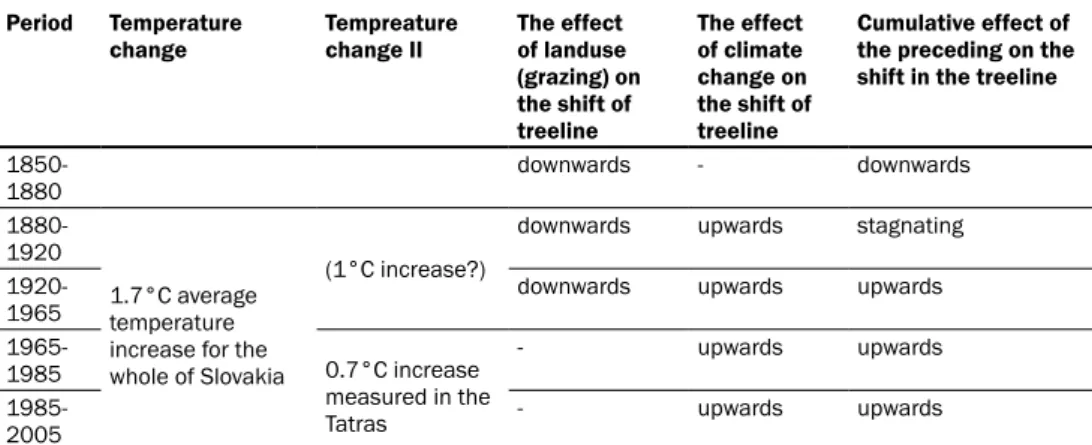
On the basis of these considerations, two methods may assist in the delinea- tion and dating of the direction of changes. (1) The partial data referring to different time periods may be summarized in a composite table (Table 1), and the direction of changes as the result of the interference of grazing effect and climatic changes on treeline may then be traced. Based on these data it may be supposed that Pinus mugo retreated between 1850 and 1880, a process which then turned stagnated between 1880 and 1950, and finally became the accelerating advance of the species after 1950.
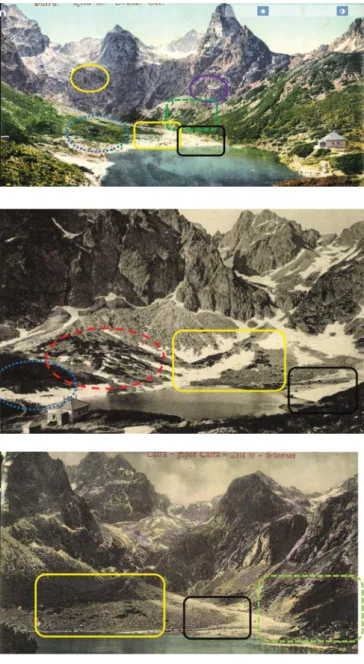
(2) Other illustrations of the same area between 1850 and 2006 may help test these assumptions. Although it is hard to find pictures illustrating the area from the same angle, there are some at the Zemplén Museum in Szerencs among the postcards, available online at the Hungaricana database.19 Most of these date from the years
16 Solár 2013: Chapter 18.
17 The 1.4°C temperature increase is irrelevant in this case, because beneath the treeline the abandonment of grazing and the increase in temperature both point in the same direction, that of densification – and Ender’s picture illustrates an area above the (moving) tree line.
18 This is an assumption. The 0.7°C mentioned earlier refers to a shorter period after 1965, and if the 1.7°C change for the whole timespan in the Tatras is accepted, this implies that the speed of warming was even, which is not evident.
19 www.hungaricana.hu
1906–1930 (a short timespan), but nonetheless provide details about the direction of changes. By 1930 reforestation was beginning to take place on the gentle slopes on debris material. These debris slopes were grazed in the time of Ender (compare Fig. 1 and Fig. 5) and were mostly bare, though not all, as some were not accessible to flocks of sheep. Steep slopes formed on base rocks, however, were still not characterized by the presence of Pinus mugo in the 1930s. Given that these areas were never grazed, the advancement of Pinus mugo to these surfaces after the 1930s is therefore evidently a climatically driven process (Figs 6–8). This, in turn, means that more than the half of the vertical shift took place after 1930. As the spread of dwarf pine may be very rapid, if conditions turn favorable – Mihai et al. measured 0.15 km2/year progradation in the Southern Carpathians – horizontal advance might take place within few years.20 In other words, the rate of change is not necessarily even all time, so a favourable turn in climatic conditions might be followed by the advance of Pinus mugo within a short time and the timespan is not necessarily prolonged.21
To sum up: while grazing can be documented around the lake in the 1850s, it was slowly abandoned after the 1930s, and officially prohibited after 1965. Thus, changes after 1930 – namely, the settling of Pinus mugo on base rocks, and therefore at least half of the vertical advance, 100–120 meters – are evidently climate change driven, indicating an increase in average temperatures of at least 1°C. Of this, 0.7°C took place after 1965, and 0.3°C between 1930 and 1965. For the “missing” 0.5–0.7°C22 and 100-meter vertical distance both grazing and climate are responsible together.
20 Mihai et al. 2007: 250–258.
21 Švajda 2008: 30–33.
22 If the 1.7°C measured for whole Slovakia is accepted.
period temperature
change tempreature
change ii the effect of landuse (grazing) on the shift of treeline
the effect of climate change on the shift of treeline
Cumulative effect of the preceding on the shift in the treeline 1850-
1880 downwards - downwards
1880- 1920
1.7°C average temperature increase for the whole of Slovakia
(1°C increase?)
downwards upwards stagnating 1920-
1965 downwards upwards upwards
1965-
1985 0.7°C increase
measured in the Tatras
- upwards upwards
1985-
2005 - upwards upwards
Table 1. The role of temperature changes and landuse changes on the position of the treeline
in the High Tatras. Reconstruction based on literature and calculations conducted as part of the research
Figure 4. The surroundings of the Zelené pleso in the 1930s.
Between 1920 and 1930 the reforestation of debris slopes is evident, while on base rocks the presence of Pinus mugo is relatively sporadic (compare:
Fig. 3)
Figure 5. The debris slope on the left functioning as pasture in Ender’s picture is covered by dwarf pine in 1925. The bare debris slope on the right (under the peak with the double cone) is the same as can be seen in figure 6 below (1935), and will also be covered by Pinus mugo by 2006
Figure 6. Compare the debris slope on Figure 5 and 6. It is bare in both pictures, thus the advancement of Pinus mugo must have taken place only after 1935. The debris slope on the right also did not change between 1906/1912 and 1935 (see Figures 7–8)
Figure 7. Karbunkulus tower 1906 / 1912: The reforestation of the debris slope under the glacial horn stagnated between 1906 and 1935 (see Figure 6), but by 2006 Pinus mugo even penetrated to the steeper slopes
Figure 8. Zelené pleso in 1917:
There’s no evident change within 10 years except the vegetation indicated by the blue ring – compare to Figure 4.
Bibliography Archival sources
Magyar Tudományos Akadémia Könyvtára, Budapest (Library of the Hungarian Academy of Sciences), Ms 4409/152: http://ender.mtak.hu/ender/index15e.html (316 x 495 mm).
Secondary literature
Amman, Wilhelm 2004: Eine Stadt im Spiegel der Malerei. Regensburg von 1800–1900.
Regensburg.
Beniston, M. – Rebetez, M. 1996: Regional Behavior of Minimum Temperatures in Switzerland for the Period 1979–1993. Theoretical and Applied Climatology (53.) 4. 231–243.
Beniston, M. 2003: Climatic Change in Mountain Regions: A Review of Possible Impacts. Climatic Change (59.) 1–2. 5–31.
Boltižiar, Martin – Olah, Branislav (2009): Land-Use Changes within the Slovak Biosphere Reserves’ Zone. Ekológia (Bratislava) (28.) 2. 127–142.
Boltižiar, Martin – Olah, Branislav 2010: Land-use Changes in the Selected Part of the Tatry Biosphere Reserve in 1772–2003. Nauka a zarządzanie obszarem Tatr i ich otoczeniem, Tom. I. Zakopane, 27–39.
Gehrig-Fasel, J., Guisan, A. – Zimmermann, N. E. 2007: Tree Line Shifts in the Swiss Alps: Climate Change or Land Abandonment? Journal of Vegetation Science (18.) 571–582.
Lapin, M. – Šťastný, P. – Chmelík, M. 2005: Detection of Climate Change in the Slovak Mountains. Croatian Meteorological Journal (40.) 101–104.
Lapin, M. et al. 2009: Possible Impacts of Climate Change on Hydrologic Cycle in Slovakia and Results of Observations in 1951–2007. Biologia (64.) 3. 454–459.
Mihai, B. – Savulescu, I. – Sandric, I. 2007: Change Detection Analysis (1986–2002) of Vegetation Cover in Romania. Mountain Research and Development (27.) 3. 250–258.
Otto, August 1931: Die Hohe Tatra, Grieben Reiseführer Band 47. 12. Auflage. Berlin.
Rozsondai Béla 2001: A Waldstein-gyűjtemény és az adományozó Waldstein János.
In: Fekete Gézáné (szerk.): Örökségünk, élő múltunk. Gyűjtemények a Magyar Tudományos Akadémia Könyvtárában. (A MTAK közleményei 37.) Budapest, 163–190.
Solár, Jaroslav 2013: Effect of Climate Change on Mountain Pine Distribution in Western Tatra Mountains. Chapter 18. http://dx.doi.org/10.5772/54724.
Solár, Jaroslav – Janiga, Marián 2013: Long-term Changes in Dwarf Pine (Pinus mugo) Cover in the High Tatra Mountains, Slovakia. Mountain Research and Development (33.) 1. 51–62. http://dx.doi.org/10.1659/MRD-JOURNAL- D-12-00079.1.
Švajda, J. 2008: Climate Change and Timber Line in the European Mountains – Cur- rent Knowledge And Perspectives. Oecologia Montana (17.) 30–33.
Theurillat, J-P. – Guisan, A. 2001: Potential Impact of Climate Change on Vegetation in the European Alps: A Review. Climatic Change (50.) 1–2. 77–109.
www.hungaricana.hu (last accessed: 11 November 2020)
A gloBális felmelegedés és A legeltetés hAtásAinAk vizsgálati lehetősége történeti tájképeken
Az esszé három témát jár körül. Egyrészt, hogy elkülöníthető-e az antropogén hatás mértéke a természetes folyamatoktól (esetünkben a direkt antropogén bolygatás – legel- tetés – növényzeti övek elhelyezkedésére gyakorolt hatása a részben szintén emberiség által indukált klímaváltozás generálta „természetesebb” változásoktól). Másrészt arra is rá kívánunk világítani, hogy szisztematikusan mintázott, szeriális adatsorok híján a sporadikus adatok is hozhatnak közel kielégítő eredményt spekulatív gondolkodással kiegészítve. Harmadik kérdésünk, hogy milyen mértékben (és hogyan) használhatók a korabeli festmények és fényképek klímatörténeti forrásként. Elsősorban olyan képi forrásokat keresünk, melyek nem alátámasztanak más forrástípusokkal is igazolható eseményeket, hanem pótolják a források hiányát, tehát olyan korból vagy helyről származnak, ahonnan nincs más ennél megbízhatóbb (esetleg kvantifikálható) adat.
E kérdésekre sem meteorológusként, sem történészként nem tudunk egyértel- mű választ adni ökológiai ismeretek, analóg vizsgálatok (komparatív módszerek) és statisztikai tudás nélkül. Egy módszertanilag nem multi- vagy interdiszciplináris kutatás tehát tévútra vezethet.
A kiválasztott, közel 180 éves festmény történeti értékének bizonyítása és az ökológiai-klimatológiai szakirodalom alapján a Pinus mugo mint erdőhatárt jelző faj vertikális elterjedésének több mint 200 méteres eltolódása alapján sikerült bizonyítani, hogy a Tátrában legalább 1,5 °C-os felmelegedés következett be 1850–2010 között, s ezt klimatológiai analógiák, a területről származó további illusztrációk és a terület- használat sajátosságainak felderítése révén sikerült tovább szakaszolni. Tehát speciális, kvalitatív történeti források segítségével sikerült pótolni a hiányzó kvantitatív adatokat.