Open Access : ISSN : 1848-7718
http://www.pub.iapchem.org/ojs/index.php/admet/index Original scientific paper
Physico-chemical Profiling of the ACE-inhibitor Lisinopril: Acid- base Properties
Krisztina Takács-Novák*
,Katalin Deák, Szabolcs Béni, Gergely Völgyi
Semmelweis University, Department of Pharmaceutical Chemistry H-1092 Hőgyes Endre street 9. Budapest, Hungary
*Corresponding Author: Krisztina Takács-Novák;
E-mail: novak.krisztina@pharma.semmelweis-univ.hu;
Tel.: +36 1 215 5241; Fax: +36 1 217 0891
Received: January 7th, 2013; Revised: February 1st, 2013; Published: February 15th, 2013 Abstract
The acid-base chemistry of a tetraprotic, ampholyte ACE inhibitor, lisinopril, was studied by different methods.
Potentiometry in aqueous medium and a co-solvent technique in methanol-water mixtures as well as 1H NMR-pH titration were applied for the highly precise measurement of protonation macroconstants. The log K values of lisinopril (at 25.0°C and 0.15 M ionic strength) were found: log K1 = 10.75 ± 0.01, log K2 = 7.13 ± 0.01, log K3 = 3.13 ± 0.01, log K4
= 1.63 ± 0.01, calculated as an average of the best two values obtained by independent methods. NMR-pH titration was used to assign the constants to the functional groups and for the examination of site-specific, submolecular basicities of the molecule (determination of protonation microconstants). In the first two well-separated protonation steps, the macro- and microconstants were identical and assigned to the primary amino group (log K1 = log kA) and to the secondary amine basicity (log K2 = log kBA), respectively. The two carboxylates exhibited overlapping protonation characterised first by microconstants (logkABD = 2.15 logkABC = 3.10), revealing that the carboxylate on the proline ring has nine times greater intrinsic basicity than the carboxylate on the side chain. The distribution of protonation species (Lis2-; HLis-; H2Lis; H3Lis+; H4Lis2+) and microspecies (ABC; ABD) as a function of pH was calculated and used to interpret the pharmacokinetic and pharmacodynamic properties of lisinopril.
Keywords
proton speciation; logK; potentiometry; NMR-pHtitration
Introduction
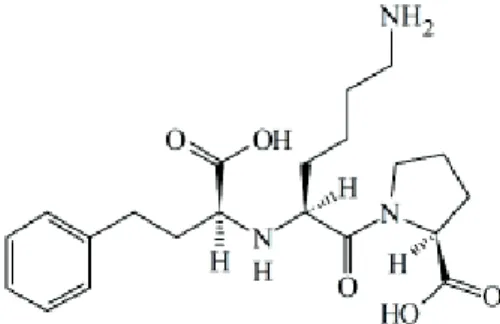
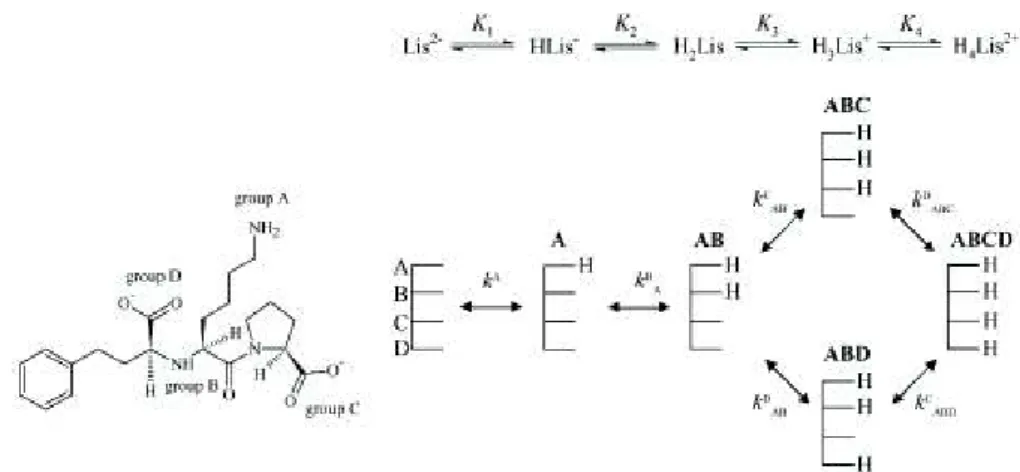
Angiotensin converting enzyme (ACE) inhibitors serve as fundamental medicines in the treatment of hypertension, one of the most prevalent chronic diseases nowadays. Out of the numerous currently available ACE-inhibitors, lisinopril – (2S)-1-[(2S)-6-amino-2[[(1S)-1-carboxy-3-phenylpropyl]amino]- hexanoyl]-pirrole-2-carboxylic acid (Fig. 1) – belongs to the proline-containing structures.
Figure 1. Chemical structure of the ACE inhibitor lisinopril
Due to its safe and effective properties, lisinopril is widely used in the therapy of essential hypertension, symptomatic and asymptomatic left ventricular systolic dysfunction, post-myocardial infarction, renal failure and diabetic nephropathy [1]. Lisinopril is administered orally usually in a daily dose of 2.5-40 mg. Its oral bioavailability is between 25-30 % [2]. Absorption from the gastrointestinal tract does not depend on nutrition. Six hours are needed to reach the maximum plasma concentration. It hardly binds to plasma proteins. Lisinopril is not metabolised, and the absorbed drug is primarily excreted invariably in the urine [3].
A vast literature describes the pharmacology, mechanism of action, pharmacokinetics and analytics of lisinopril [3-7]. However, surprisingly little information is available on its physico-chemical properties.
Lisinopril is a polyfunctional, ampholyte molecule, containing two basic and two acidic moieties. Various data have been published on its acid-base chemistry. The dissociation constants (pKa values) were reported by Bennion et al. [8] (1.68, 3.29, 7.01, 11.12) and Ip et al. [9] (2.5, 4.0, 6.7, 10.1), without an indication of the experimental error and with no assignment of basicities to moieties. Gonzalez et al. [10] assigned the measured pKa values (1.4 ± 0.1, 3.00 ± 0.01, 7.10 ± 0.01, 10.78 ± 0.01) to the functional groups, but only on the basis of chemical evidence. These three datasets of pKa values are significantly different, particularly the lowest and highest constants, which remain uncertain. The difference between them exceeds one order of magnitude.
The acid/base character determines the charge of a molecule in solution at a particular pH (characterised by the dissociation/protonation constant, pKa/log K). Further on in this paper, we use the log K term and consider the ionisation process as an association with a proton in all acid-base equilibria.
This information is important in the estimation of ADME (absorption, distribution, metabolism, excretion) parameters and the interpretation of pharmacokinetic (PK) properties. Log K values can be used to better understand the binding mechanism in therapeutic events and also for optimisation of chemical reactions and analytical methods.
Several analytical methods have been applied for the determination of lisinopril in biological samples and pharmaceutical preparations such as alkalimetry [11], spectrophotometry [12], high performance liquid chromatography (HPLC) [13], high performance thin-layer chromatography (HPTLC) [14], and capillary electrophoresis (CE) [15]. Obviously, upon the application of these methods, exact knowledge of acid-base chemistry is essential (for pharmacopoeial methods) or at least favourable (for chromatographic techniques and CE).
The acidity/basicity of monovalent compounds can be quantified in terms of macroscopic log K parameters (macroconstants). For multiprotic compounds, macroconstants characterise the basicity of the molecule as a whole. They refer to the stoichiometric composition of the species, but they fail to provide information on specific proton-binding sites. Site-specific, submolecular basicities can be obtained when
microconstants are determined. Microconstants measure the proton affinity of individual groups, while the protonation states of all other sites are definite in the molecule [16]. The macroscopic and microscopic basicities provide authentic information on propensities of intermolecular interactions both in pharmacokinetic (PK) and pharmacodynamic (PD) stages [17].
As a part of our studies on the physico-chemical properties of ACE inhibitors, we investigated the acid- base chemistry of lisinopril. We characterised both the overall and the group-specific basicities of lisinopril.
Validated potentiometric methods and 1H NMR spectroscopy resulted in more precise macroconstants than in previous investigations. Here, we first studied the site-specific (microscopic) protonation equilibria of lisinopril considering the overlapping protonation of carboxylates. The results were used to interpret the PK/PD properties of the compound.
Experimental
Materials and instrumentation
Lisinopril dihydrate was generously supplied by Gedeon Richter Ltd. (Budapest, Hungary) and used without further purification. Distilled water was of pharmacopoeial grade [11] and all other reagents of analytical grade were purchased from commercial suppliers.
Potentiometric titrations were carried out on a GLpKa automated pKa and log P analyser (Sirius Analytical Instr. Ltd. Forest Row, UK).
NMR measurements were carried out on a 600 MHz Varian Inova spectrometer (Palo Alto, CA), equipped with a broadband inverse detection pulse field gradient probehead.
Potentiometric logK determination Electrode calibration
The four-parameter procedure was used for electrode standardisation in both aqueous and semi- aqueous media [18]. HCl solutions of known concentration, containing 0–45.68 wt% methanol, were titrated with standardised KOH at 25.0 ± 0.1 oC, at 0.15 M ionic strength using KCl, under an N2
atmosphere, in the pH interval of 1.8-12.2. The operational pH reading was related to pcH values by the standard multiparametric equation:
pH = a + SpcH + jH[H+] + jOHKw/[H+] (1)
where a corresponds to the negative logarithm of the activity coefficient of [H+] at working temperature and ionic strength and S is the ratio between the electrode slope and the Nernst slope. The jH and jOH terms correct the electrode junction effects at low and high pH, respectively.
The parameters were determined by a weighted non-linear least squares procedure (Refinement ProTM 2.2 software - Sirius Analytical Instr. Ltd. Forest Row, UK).
Titration in aqueous medium
Six millilitres of 1.97–2.10 mM aqueous solutions of the sample were preacidified to pH 1.8 with 0.5 M HCl and then titrated alkalimetrically to pH 12. The titrations were carried out at 25.0 ± 0.1 °C, at 0.15 M ionic strength using KCl under an N2 atmosphere. Three separate titrations were performed. The initial
estimates of log K values were obtained from Bjerrum difference plots (n vs. pH, when n is the average number of bound protons) and were refined by a weighted non-linear least squares procedure using Refinement ProTM 2.2 software (Sirius Analytical Instr. Ltd. Forest Row, UK).
Titration in solvent mixtures
Three semi-aqueous solutions of lisinopril containing 14.21, 28.54 and 43.82 wt% methanol were titrated under the same experimental conditions as in aqueous medium. The apparent protonation constants (logs K) were calculated from the difference (Bjerrum) plot in a similar manner as the aqueous log K values. The Yasuda-Shedlovsky procedure was applied to estimate the aqueous log K values. The Yasuda-Shedlovsky extrapolation method is based on the linear relation between logs K and the dielectric constant (ε) of a solvent mixture:
logs K + log [H2O] = a / ε + b (2)
where a is the slope, b is the intercept (fitting constant) of the linear equation, ε is the dielectric constant of the methanol-water mixture and log [H2O] is the molar water concentration of the given solvent mixture. This method is a widely used procedure in co-solvent techniques [19,20].
1H NMR titration with in situ pH monitoring
A single NMR sample solution of 0.6 ml was prepared containing 8 mM lisinopril, 140 mM NaCl (to ensure a constant ionic strength of 0.15 M) in a 9/1 H2O/D2O solvent mixture. This sample also contained 2 mM of the following pH indicator molecules: dichloroacetic acid, chloroacetic acid, acetic acid, imidazole, tris(hydroxymethyl)-aminomethane (TRIS) and trimethylamine hydrochloride (TMA) in order to determine the actual pH of the sample in each titration step, according to the electrodeless single tube NMR titration method [21]. As an internal chemical shift reference, 0.5 mM of sodium 3-(trimethylsilyl)-1- propanesulfonate (DSS) was applied. The 1H NMR spectra were recorded at 25.0 ± 0.1 °C. The water signal was suppressed either by the double pulse field gradient spin echo (dpfgse) or the selective presaturation (presat) sequence. The in situ pH value was deduced from the chemical shift of the appropriate indicator by the following equation:
obs Ind Ind
HInd obs Ind Ind log log
pH δ δ
δ δ K
- - +
= (3)
where log KInd is the protonation constant of the indicator and dInd, dHind are the limiting chemical shifts of its non-protonated and protonated forms (determined in separate experiments) [22,23].
The NMR-pH datasets were fitted with the Opium computer program [24] to determine protonation macroconstants and chemical shift values specific to each macrospecies (dHiLis).
Results and Discussion
Among the ACE inhibitor drugs, lisinopril has the most interesting and complex acid-base chemistry.
There are four proton-binding sites in the molecule: two carboxylates as well as a primary and a secondary
amine group. The protonation processes of the two carboxylate groups are expected to be highly overlapping. For the investigation of the ionisation/protonation properties of the molecule, potentiometry in aqueous medium and in methanol-water mixtures as well as NMR-pH titration were applied.
Protonation macroconstants
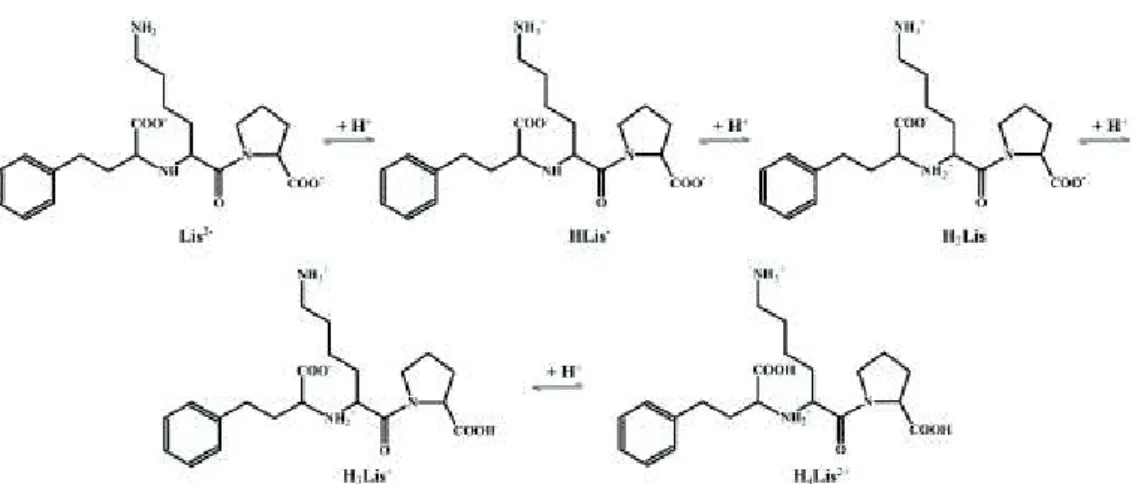
The stepwise protonation equilibria (Fig. 2) of the whole molecule are characterised in terms of protonation macroconstants, log K values.
Figure 2.Stepwise protonation equilibria of lisinopril
Generally, potentiometry in aqueous medium is the method of choice for logK determination for molecules with solubility greater than 0.8 mM in the entire pH interval of interest. The solubility of lisinopril (0.22 M, [9]) allows the determination of macroconstants by the standard method. The four obtained log K values along with the standard deviations calculated from three parallel titrations (3 x 15 points) are listed in Table 1.
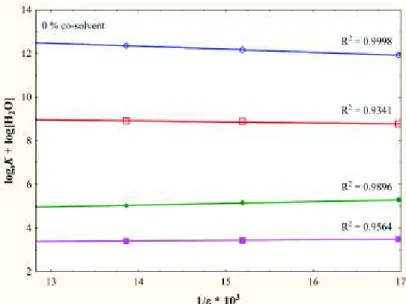
Since the log K4 value falls below to the lower applicability limit (log K < 2) of pH-metric titration, we also measured the protonation macroconstants using the co-solvent method. The effect of methanol on the protonation constant is known to depend on the charge of the basic site. For acids, the apparent logs K value increases with the increasing weight percent of methanol, while a decrease is usually observed for bases [25]. Using this co-solvent method, we obtained a more reliable value for logK4 since the logs K4
values in methanol-water mixtures shifted up to the measurable pH range. At the same time, this co- solvent method allows for assigning logK values to the acidic and basic moieties of the molecule. According to the slopes of the regression lines on the Yasuda-Shedlovsky plot (Fig. 3), log K1 and log K2 characterise amine functions, while log K3 and log K4 the carboxylate groups of the molecule, respectively.
For the exact proton speciation of lisinopril, 1H NMR-pH titrations were carried out using the most similar possible experimental conditions as in potentiometry. Fig. 4 shows the aliphatic part of one spectrum from the titration series.
Figure 3. Yasuda-Shedlovsky plot where open diamonds denote logs K1 (slope: -138.4, intercept: 14.271), open squares denote logs K2 (slope: -44.6, intercept: 9.532), filled diamonds denote logs K3 (slope: 82.6, intercept: 3.891) and
filled squares denote logs K4 (slope: 29.9, intercept: 2.976).
Figure 4. Representative 1H NMR spectrum of lisinopril at pH 5.07 in 9/1 H2O/D2O. The assignment is based on conventional 2D NMR techniques.
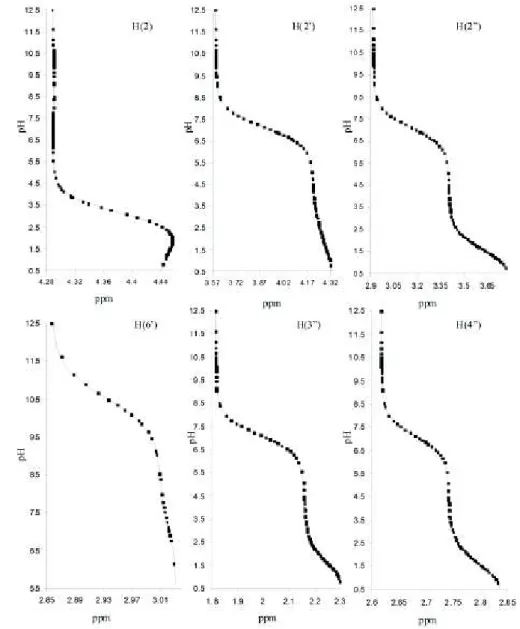
At certain pH values, the assignment of overlapping multiplets to methylene and methine protons was verified by TOCSY and HSQC experiments. In Fig. 5, the chemical shifts of the methine protons H(2), H(2’) and H(2”) along with the methylenes H(6’), H(3”) and H(4”) are depicted as functions of pH. These six datasets were fitted simultaneously to the tetraprotic macroscopic model function described elsewhere [26]. The obtained macroconstants are shown in Table 1.
Table 1. Protonation macroconstants measured by different methods.
Method Protonation macroconstants
log K1 ± SD log K2 ± SD log K3 ± SD log K4 ± SD potentiometry in aqueous medium 10.74 ± 0.01 7.14 ± 0.01 3.10 ± 0.01 1.54 ± 0.05 potentiometry in solvent mixtures 10.75 ± 0.01 7.22 ± 0.03 3.21 ± 0.02 1.62 ± 0.01 NMR-pH titration 10.53 ± 0.03 7.12 ± 0.01 3.15 ± 0.01 1.63 ± 0.01 average of the best two values* 10.75 ± 0.01 7.13 ± 0.01 3.13 ± 0.01 1.63 ± 0.01
* see details in text
Figure 5. NMR-pH titration curves with computer fitted solid line
The macroconstants (Table 1) obtained by different methods show generally good agreement. The average deviation between the log K values was 0.09 units. The ca. 0.2 unit discrepancy in log K1 between data acquired by the NMR and potentiometric methods may arise from the greater ambiguity of in situ pH values. Specifically, trimethylamine has a log KInd = 9.90 [23] and thus can monitor pH values higher than
10.9 with a lower precision (see the error estimations in [21] for details). In contrast, the log K4 = 1.63 value by NMR can be considered as more reliable than data obtained by potentiometry in aqueous medium, because below pH 2, the acidity error of the electrode is considerable, while here the NMR-pH titration as described above is an electrodeless technique. This constant could be determined with excellent precision from the extrapolation of semi-aqueous logs K values due to the reasons mentioned above.
However, we think it reasonable to make an average of the best two experimentally measured logK values based on the following principle. We omit the log K value with the highest uncertainty (the highest SD value). The calculated, most reliable protonation macroconstants are indicated in the last row of Table 1. Comparing the obtained logK values with those reported in [9], the difference was greater than 0.4 log units in all log K values. Both the log K1 determined by Benion et al. [8] and the log K4 reported by Gonzalez et al. [10] differ remarkably from our data. This is not surprising because those constants were deduced from conventional pH-potentiometry in aqueous medium, while the methods used in our study (potentiometry in methanol-water mixtures, 1H NMR-titration) give more reliable protonation constants at pH extremes.
Protonation microconstants
Nevertheless, macroscopic constants could not directly be assigned to functional groups, since the difference in their logarithms did not exceed 3. The microscopic protonation scheme in Fig. 6 should be considered for lisinopril instead, where the superscript on microconstant k indicates the group protonating in the equilibrium in question, whereas the subscript (if any) refers to already protonated group(s).
Figure 6. Site-specific (microscopic) protonation scheme of lisinopril
In the first two well-separated protonation steps, the macro- and microconstants are identical. Since the first protonation is reported most sensitively by H(6’), this protonation step can be assigned to the primary amino group (log K1 = log kA). Similarly, log K2 (= log kBA) accounts for the secondary amine basicity.
In the case of lisinopril, the carboxylates denoted by C and D exhibit overlapping protonation, so selective monitoring of at least one of them is a prerequisite for microconstant determination. According to the normalised NMR titration curves, H(3”) and H(4”) can be assumed as selective sensors of D carboxylate protonation. Thus, the experimental chemical shift profile of H(3”) was fitted to the following model equation:
2 2 obs
] [ ]
[ 1
] [ ]
) [
( + +
+ +
+ +
+
× - +
= +
H K K H K
H K K H k δ
δ δ
δ
4 3 3
4 3 D
AB Lis Lis H
Lis H
H 2 2
2 4
(4)
The microscopic evaluation resulted in logkABD = 2.15 ± 0.05 (n= 2) which, in turn could be converted to the remaining three microconstants, using the following Hessian constraints:
3 C AB D
AB k K
k + = (5)
4 3 D ABC C AB C
ABD D
ABk k k K K
k = = (6)
We obtained logkABDC = 2.63, logkABC = 3.10 and logkABCD = 1.68 (with estimated uncertainties of 0.05).
The main pathway of protonation includes the ABC microspecies, while its minor protonation isomer (ABD) has nine times lower abundance at all pH values. In other words, the carboxylate on the proline ring exhibits nine times greater intrinsic basicity than the carboxylate on the side chain with an adjacent, electron-attracting protonated secondary amine (-NH2
+-) group. The mutual basicity-modifying effect of these moieties is quantified by the interactivity parameter, defined as the difference in the corresponding microconstants: pECD = 2.15 – 1.68 = 3.10 – 2.63 = 0.47. This pE value suggests an interaction exceeding the random, Coulombic value of 0.2-0.3 [27]; presumably, these sites communicate through space with a simultaneous change in their geometric positions. A conformational change at pH < 4.5 is also substantiated by the changing multiplet patterns in the NMR spectra, but a detailed analysis of vicinal 3JHH
values holding conformational information is beyond the scope of this article.
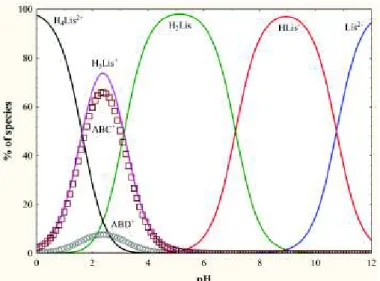
Distribution of protonation species
Using log K and log k values, the percentage of various protonated species can be calculated for any arbitrary pH value. The distribution ratios of each species as a function of pH are shown in Fig. 7.
Figure 7. Distribution curves of the macrospecies (HiLis) and microspecies (ABC and ABD) of lisinopril
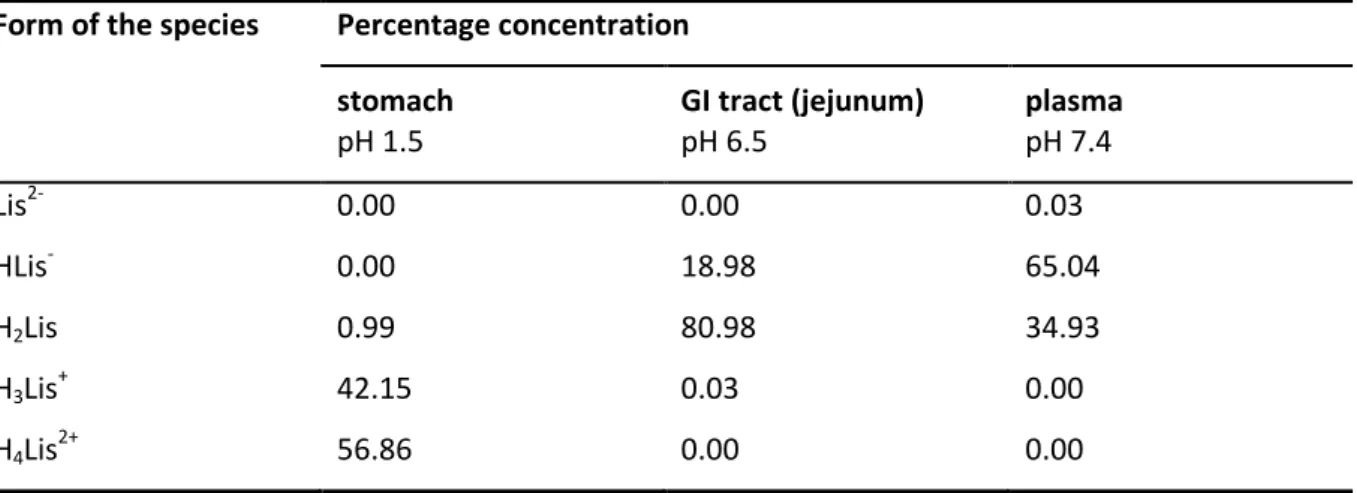
Table 2 summarises the relative concentration of lisinopril protonation species at the most relevant pH values in the body. In the stomach, the monocation (H3Lis+) and the dication (H4Lis2+) forms are present at about equal levels. In the gastrointestinal tract, the double protonated H2Lis form predominates, while at the pH of plasma, the monoanion (HLis-) is the dominant species.
Table 2. The percentage concentration of the species in the stomach (pH 1.5), gastrointestinal tract (jejunum pH 6.5) and plasma (pH 7.4).
Form of the species Percentage concentration stomach
pH 1.5
GI tract (jejunum) pH 6.5
plasma pH 7.4
Lis2- 0.00 0.00 0.03
HLis- 0.00 18.98 65.04
H2Lis 0.99 80.98 34.93
H3Lis+ 42.15 0.03 0.00
H4Lis2+ 56.86 0.00 0.00
Conclusions
In this study, the acid-base chemistry of tetraprotic lisinopril was characterised by protonation macro- and microconstants. The highly precise log K values obtained by two independent analytical methods provided a better interpretation of the PK/PD properties. As Fig. 7 indicates, under the pH conditions of the GI tract – the most likely site of oral absorption – lisinopril is predominantly present in the H2Lis form.
Although the net charge of this species is zero, the molecule exists in solution as a double zwitterion: the two amine functions are protonated while the two carboxylates are not. This structure represents a highly polar dipole that is unfavourable for passive transport through lipoid membranes, which explains the low bioavailability of the molecule. Recently, the intestinal dipeptide transporter system (DTS) has been reported to be involved in the active transport mechanism of oral absorption of ACE inhibitors [28].
At the pH of the plasma, the monoanion (HLis-) is the dominant form (more than 60%), which favours receptor binding. As is known, therapeutically useful ACE inhibitors exhibit three-point binding to the Zn ion-containing carbopeptidase ACE enzyme [2]. The proline C2-carboxylate of lisinopril binds to the positively charged Arg146, while the other carboxylate in the side chain participates in complex formation with the Zn ion. The third binding site is represented by Ser-OH where the C1’=O group forms an H-bond.
The species distribution revealed in this study explains the good receptor binding of lisinopril.
References
[1] J. Wong, R.A. Patel, P.R. Kowey, Progress in Cardiovascular Diseases 47 (2004) 116-130.
[2] M. Harrold, in: D.A. Williams, T.L. Lemke (Eds), Foye’s principal of medicinal chemistry, 5th edn.
Lippincott Williams & Wilkins, Philadelphia, 2002, p. 533.
[3] B. Beermann, American Journal of Medicine 85 (3B) (1988) 25-30.
[4] D.J. Eveson, T.G. Robinson, J.F. Potter, American Journal of Hypertension 20 (2007) 270-277.
[5] N.K. Hollenberg, D.A. Anzalone, B. Falkner, N.D.L. Fisher, P.N. Hopkins, W. Hsueh, H. Hutchinson, R.M. Krauss, D.A. Price, P. Raskin, G.M. Reaven, American Journal of Hypertension 14 (2001) 218- 223.
[6] C.M. White, Pharmacotherapy 18 (1998) 588-599.
[7] K.L. Goa, J.A. Balfour, G. Zuanetti, Drugs 52 (1996) 564-588.
[8] C. Bennion, R.C. Brown, A.R. Cook, C.N. Manners, D.W. Payling, D.H. Robinson, Journal of Medicinal Chemistry 34 (1991) 439-447.
[9] D.P. Ip, J.D. DeMarco, M.A. Brooks, Analytical Profiles of Drug Substances 21 (1992) 233-276.
[10] E.B. Gonzalez, E. Farkas, A.A. Soudi, T. Tan, A.I. Yanovsky, K.B. Nolan, Journal of Chemical Society Dalton Transactions (1997) 2377-2379.
[11] European Pharmacopoeia 7.0, Strasbourg.
[12] N. Rahman, N. Anwar, M. Kashif, Il Farmaco 60 (2005) 605-611.
[13] C.A. Beasley, J. Shaw, Z. Zhao, R.A. Reed, Journal of Pharmaceutical and Biomedical Analysis 37 (2005) 559-567.
[14] A. El-Gindy, A. Ashour, L. Abdel-Fattah, M.M. Shabana, Journal of Pharmaceutical and Biomedical Analysis 25 (2001) 923-931.
[15] S. Hillaert, W. Van den Bossche, Journal of Pharmaceutical and Biomedical Analysis 25 (2001) 775- 783.
[16] B. Noszál, in: K. Burger (Ed.), Biocoordination chemistry, coordination equilibria in biologically active systems. Ellis Horwood, Chichester, 1990, p. 18.
[17] K. Takács-Novák, B. Noszál, M. Tőkés-Kövesdi, Gy. Szász, Journal of Pharmacy and Pharmacology 47 (1995) 431-435.
[18] A. Avdeef, J.J. Bucher, Analytical Chemistry 50 (1978) 2137-2142.
[19] K. Takács-Novák, K.J. Box, A. Avdeef, International Journal of Pharmaceutics 151 (1997) 235-248.
[20] K. Deák, K. Takács-Novák, K. Tihanyi, B. Noszál, Medicinal Chemistry 2 (2006) 385-389.
[21] Z. Szakács, G. Hägele, R. Tyka, Analytica Chimica Acta 522 (2004) 247-258.
[22] Z. Szakács, Sz. Béni, Z. Varga, L. Örfi, Gy. Kéri, B. Noszál, Journal of Medicinal Chemistry 48 (2005) 249-255.
[23] M. Boros, J. Kökösi, J. Vámos, B. Noszál, Journal of Pharmaceutical and Biomedical Analysis 43 (2007) 1306-1314.
[24] M. Kyvala, I. Lukes, (1995) OPIUM computer program, http://www.natur.cuni.cz/~kyvala/opium.html
[25] A. Avdeef, J.E.A. Comer, S.J. Thomson, Analytical Chemistry 65 (1993) 42-49.
[26] Z. Szakács, M. Kraszni, B. Noszál, Analytical and Bioanalytical Chemistry 378 (2004) 1428-1448.
[27] B. Noszál, Z. Szakács, Journal of Physical Chemistry B 107 (2003) 5074-5080.
[28] V.A. Moore, W.J. Irwin, P. Timmins, P.A. Lambert, S. Chong, S.A. Dando, R.A. Morrison, International Journal of Pharmaceutics 210 (2000) 29-44.
©2013 by the authors; licensee IAPC, Zagreb, Croatia. This article is an open-access article distributed under the terms and conditions of the Creative Commons Attribution license (http://creativecommons.org/licenses/by/3.0/)