Interface stress measurements in an electrochemical environment
Gyözö G. Láng*
Eötvös Loránd University, Institute of Chemistry, Department of Physical Chemistry&Labor- atory of Electrochemistry and Electroanalytical Chemistry
H-1117 Budapest, Pázmány P. s. 1/A, Hungary
Abstract: The intensive parameter conjugate to surface area (often called the “surface stress”,
“surface tension”, “interfacial tension”, “interface stress” or “specific surface energy”) is an important parameter in the thermodynamic theory of solid electrodes, because any interaction between the bulk solid and the remainder of the system takes place via the interface region. The thermodynamic properties of this region (i.e. the electronic conductor|ionic conductor inter- face, for instance the interface between a metal and an electrolyte solution) directly influence the electrochemical processes, an understanding of the thermodynamics of interfaces is of im- portance to all surface scientists and electrochemists. Unfortunately, a study of the interface stress of a “solid electrode” (i.e. an electrode that contains an electronically conducting solid phase in contact with an ionically conducting liquid phase) is complicated by many factors, and with the exception of a few special situations the absolute interfacial tension at the solid|liquid interface is inaccessible by experimental methods. Nevertheless, during the past two centuries several attempts have been made to derive thermodynamic equations for the solid|liquid inter- face, and several methods were suggested (and were supposed to be suitable) for the determi- nation of changes in the interface stress of solid electrodes.
In the present study some of the methods developed for the experimental determination of (in- terfacial or film) stress changes in electrochemical systems containing solid-liquid interfaces are briefly reviewed, as well as the kind and quality of information that can be obtained using these methods are discussed. The “bending beam” (“bending cantilever”, “laser beam deflec- tion”, ”wafer curvature”) method and related techniques, the piezoelectric method, the exten- someter method, and the method based on the measurement of contact angle are discussed in detail. Special attention has been paid to problems related to the use of optical methods for position sensing.
*Tel.: +36 1 209 0555/1107; fax: +36 1 372 2592.
Keywords: bending cantilever method, cyclic voltammogram, electrocapillarity, electrode, ex- tensometer, intensive parameter conjugate to surface area, Kösters laser interferometer, multi- beam optical sensing technique, piezoelectric method, position sensitive detector, Schnell’s law, solid electrode, solid-liquid interface, Stoney’s equation, stress, strain, surface energy, voltdeflectogram
Introduction
Basic notions and concepts
Misinterpretations and misunderstandings in science are often caused by ignoring or marginalizing the importance of clear concepts and definitions, therefore careful description of its objects and clear-cut terms should be the basis of any “true” science. Consequently, the need for precise language and terminology cannot be overestimated. Since the next chapters deal with interfacial electrochemistry, it is necessary to clarify at least two of the fundamental con- cepts used throughout this work, namely “electrode” and “solid electrode”.
“Electrode”: There exist two quite different definitions of the term “electrode” in the electro- chemical literature. According to the first an electrode is an electronic conductor (e.g. a metal or a semiconductor) in contact with an ionic conductor (e.g. an electrolyte solution). According to the second definition the electrode is an electrochemical system in which at least two phases are in contact and one of them being electronic conductor, the other an ionic conductor. The latter version has usually been favored in classical electrochemistry. The most important con- clusion emerging from the above is, that there are really two quite different things covered by the term “electrode”: an electronic conductor phase (alone) and the entire assembly of an elec- tronic conductor in intimate contact with and ionic conductor. The term “half-cell” is often used instead of “electrode”. It may nevertheless seem strange to talk about an electrochemical cell consisting of three or four “half cells”. The electrode is sometimes defined as a material system in which the electrode reaction takes place at an interface. Obviously, this definition does not apply to “ideal polarized” (“ideally polarizable” or “perfectly polarizable”) electrodes (see later). By taking into account the above considerations, the following relatively simple defini- tion may be relevant: An electrode is a heterogeneous electrochemical system including one interface (or several joint interfaces, i.e. interfaces connected to each other in-plane) at which the type of electrical conduction changes (from electronic to ionic or to mixed, from ionic to electronic or to mixed, or vice versa).
It is known that the formation of an interface between an electronic conductor and an ionic conductor is accompanied by a spatial separation of charge, such that electric potential differences may appear between the adjacent phases. The whole array of charged species, neu- tral molecules or oriented dipoles existing at a metal|solution interface is called the “electro- chemical (or electrical) double layer”.
"Solid electrode": Although widely used, the term "solid electrode" remains unclear and con- fusing for those that are unfamiliar with electrochemical definitions. According to the above, the definition of a “solid electrode” can be given as follows: An electrode that contains an elec- tronically conducting solid phase in contact with an ionically conducting liquid phase. Concep- tually the most important conclusion of the above discussion is that a “solid electrode” is a multicomponent, multiphase electrochemical system. This means that it cannot be treated as a pure solid.
Some other important concepts: It is well known that thermodynamics usually deal not with matter at all, but with models of matter. This is also true for the thermodynamics of solids. The manifestation of properties of real solids is multiple and depends on the time of observation. If we are curious, for instance about whether a real solid, with numerous structural defects, is capable of distributing pressure uniformly and isotropically, the result will be different depend- ing on the period of time given for observation: the very short time typical for a laboratory experiment, or eternity. A possible, thermodynamically correct alternative choice is the model of a “completely elastic body” with the following properties:
i) There is at least a single “immobile” component in the system, the particles of which are firmly fixed (by a passive resistance) at their sites in a crystalline lattice, which makes their diffusion impossible. The introduction of “internal constraints” that operate selectively is a tool for creating a theory of a, strictly speaking, non-equilibrium system using the language of equi- librium thermodynamics.
ii) The mechanism of equalizing chemical potentials does not operate in this model with respect to the immobile component, and a chemical potential gradient can appear even for an “equilib- rium state”.
iii) The model may include any number of mobile components which are distributed with uni- form chemical potentials at equilibrium.
Surface, interface and interphase: In physical chemistry, the term “surface” usually means the termination of a solid or liquid phase bordering to vacuum. This condition is often emphasized by using the term “free surface”. In some cases the term “surface” is used in the macroscopic
normal external conditions by conventional methods like cutting, polishing and etching. This approach implies that the surface is in contact with the ambient atmosphere. The term “surface of a metal” usually means the top layer of atoms or ions and is used very often for an atomically clean and atomically smooth crystal plane. Ideal surfaces exhibit no surface lattice defects, real surfaces may have several types of defects (vacancies, grain boundaries, dislocations, impuri- ties, etc.). In electrochemistry the plane that ideally marks the boundary between two phases is called the “interface”. On the other hand, if attention is actually focused on only one of the two phases, this plane is often called the “surface” of the phase. This approach, however, may lead to confusion. The region between two phases where the properties vary (usually in the direction perpendicular to the surface) between those of the bulk is the interfacial region. It can also be regarded as a distinct, although not autonomous, phase, and be called the “interphase”. While the “interface” is two-dimensional, the “interphase” is assumed to be three-dimensional, which possesses volume. The term “ideally polarizable interface” (or “ideally polarizable interphase”) is used when no charged component is common to both phases adjoining the (electrified) inter- phase, i.e. the interface is impermeable to electric charge. Heterogeneous electrochemical sys- tems that possess this property are called “ideally polarizable” or “ideal polarized” electrodes.
The concept of ideal polarizability implies the total absence of charge transfer between the two adjacent phases. The term “perfectly polarizable electrode” is often used when the state of the electrode is uniquely defined by the amount of charge consumed. This concept is somewhat broader than that of ideal polarizability.
The intensive parameter conjugate to surface area (often called the “surface stress”,
“surface tension”, “interfacial tension”, “interface stress” or “specific surface energy”) is an important parameter in the thermodynamic theory of electrodes, because any interaction be- tween the bulk solid and the remainder of the system takes place via the interface region. The thermodynamic properties of this region (i.e. the electronic conductor|ionic conductor inter- face, for instance the interface between a metal and an electrolyte solution) directly influence the electrochemical processes, an understanding of the thermodynamics of interfaces is of im- portance to all surface scientists and electrochemists. Since the early days of electrochemistry, one of the main goals of research has been to find correlations between the structures formed by surface atoms and adsorbates and the macroscopic kinetic rates of electrochemical reactions.
Nevertheless, the understanding of fundamental aspects of interfacial electrochemistry is also important for other fields, such as materials science, nanoscience, biology, medical science, sensor and battery research, as well as for technologies based on electrochemical techniques.
Electrocapillarity
Electrocapillarity (or electrocapillary phenomena) are the phenomena related to the thermodynamics of charged interfaces, especially to changes in the interfacial energy (interfa- cial stress or tension) as the electrode potential or the composition (concentration) of the elec- trolyte solution changes. The term ‘electrocapillarity’ is often taken as synonymous with capil- larity, but emphasizes the electric aspects. On the other hand the term is also used in a restricted sense to mean the study of the equilibrium properties of metal/solution interfaces, such as the interfacial tension of mercury/electrolyte solution interfaces. However, the equilibrium proper- ties of many other interfaces fall within the scope of the theory of electrocapillarity, such as the interface between two immiscible electrolyte solutions (ITIES). Briefly, electrocapillarity is the study of the interfacial tension (stress) as a function of the electrode potential.
In many cases, precise quantitative measurements of interfacial tensions can obtained for liquid|liquid interfaces. The interpretation of electrocapillary data obtained with liquid met- als in contact with electrolyte solutions is greatly facilitated by the concept of ideal polarizabil- ity. For perfectly (ideally) polarizable electrodes the relationship between the interfacial ten- sion, the electrode potential and the surface charge density can be well described by the Lipp- mann equation. On the contrary, the study of the interface stress of a “solid electrode” (i.e. an electrode that contains an electronically conducting solid phase in contact with an ionically conducting liquid phase) is complicated by many factors, and with the exception of a few spe- cial situations the absolute interface stress (interfacial tension) at the solid|liquid interface is inaccessible by experimental methods. (It should be noted here that theoretical estimates of absolute surface tension of some relatively simple covalently bonded, ionic, rare-gas, and me- tallic crystals can be found sporadically in the literature. In a few specific situations, the surface tensions of some solid surfaces have been determined experimentally. These experimental methods are designed for the solid/gas interface, and are mostly incompatible for use at room temperature or in the presence of an electrolyte solution. Consequently, they cannot be applied to study the surface energetics of solid electrodes.)
As it is well known, a solid does not generally exhibit an “equilibrium” surface, and its surface is largely a frozen-in record of an arbitrary past history. Although the changes in the thermodynamic parameters may not result in full equilibrium, the system can escape from the constraint by optimization of the structure of the interface (e.g. the distribution of imperfections, surface waves and humps) in the rational time scale, or more generally, it will approach relative
minima of the Gibbs energy of the interface. From this point of view, the energetics of solid|liq- uid interfaces represents a very interesting theoretical problem, which can be considered as an extreme example of the equilibrium thermodynamic treatment of systems that are in fact non- equilibrium (and non-thermodynamic). It is not surprising, therefore, that during the past dec- ades, many attempts have been made to derive thermodynamic relations for the solid|liquid interface, but there is no general consensus on the validity of the proposed equations.
In principle, the quantitative predictions made by the theory can be tested experimen- tally. Unfortunately, for solid electrodes the interpretation of the results from various methods in terms of physicochemical properties of the system is not without problems. As discussed above, the absolute interface stress at the solid|liquid interface cannot be determined by direct measurements owing to the lack of reliable methods. Nevertheless, several methods were sug- gested (and were supposed to be suitable) for the determination of changes in the interface stress of solid electrodes. Attempts to determine the interface stress change of solid electrodes fall into two main categories: measurement of the variation in interface stress experienced by the solid as a function of potential and the measurement of the potential dependence of contact angle established by liquid phase on the solid surface. However, the latter method is of limited importance. Variation in the interface stress may either be measured “directly”, with a piezoe- lectric element, or be obtained “indirectly”, by measuring the potential dependence of the strain (i.e. electrode deformation) and then obtaining the variation in stress from the appropriate form of Hooke’s law. We would like to stress here again that the above methods only yield changes of surface stress as a function of various physicochemical parameters e.g. as a function of elec- trode potential, and in principle, if there are both “plastic” and “elastic” contributions to the total strain, the changes of the “generalized surface parameter” can be determined. Unfortu- nately, most of the proposed methods have drawbacks; i.e., they are technically demanding, they cannot be used to monitor changes continuously, they are semiempirical and depend on unverified assumptions, etc.
In the present work, a brief review is given of some techniques proposed for the deter- mination of changes of interface stress of “solid electrodes” (“bending beam”, “bending canti- lever”, “laser beam deflection”, ”wafer curvature” or “bending plate/disc” methods, laser inter- ferometry, piezoelectric method, extensometer method and its variants) as well as the kind and quality of information that can be achieved using these methods are discussed.
Experimental methods
Bending cantilever and bending plate methods
Measuring the bending of a plate or strip to determine interface stress change or the stress in thin films is a frequently used technique in electrochemistry. The electrochemical ap- plication of the “bending cantilever” (“bending beam”, “laser beam deflection”, “wafer curva- ture”, etc.) technique is based on the fact that the changes of the interface (surface) stress (s) for a thin metal film on one side of an insulator (e.g. glass) strip (or a metal plate, one side of which is coated with a thin insulator layer) in contact with an electrolyte solution can be esti- mated from the changes of the radius of curvature of the strip. Usually, in such experiments the strip or plate is rigidly clamped at one end in a fixed mount or holder to form a cantilever. If the potential of the electrode changes, electrochemical processes resulting in the change of s can take place exclusively on the metal side of the sample. The change in the surface stress induces a bending moment and the strip bends. The deflection of the free end is then measured by some means (see Figure 1a). In case of a thin metal film on a substrate if the thickness of the film tf is sufficiently smaller than the thickness of the plate, ds >> tf , the change of s can be obtained by an expression based on a generalized form of Stoney’s equation
R γski1 , [1]
where ki is sensitivity constant. In the simplest case (see Equation [6] given later in the text):
s
2 s s
i 6 1 ν
d k E
, [2]
where Es, s, and R are Young’s modulus (modulus of elasticity), Poisson’s ratio and radius of curvature of the substrate, respectively, ds is the substrate thickness.
The principles of the “bending cantilever” method were first stated by G.G. Stoney (1909), who exploited the stress-induced curvature of a thin plate (steel rule), which served as a substrate to investigate the stress of an electrodeposited Ni film. He derived an equation re- lating the film stress , film thickness tfto the radius of curvature (R) of the strip
R t d
σ 6
2 s s f
. [3]
This equation is sometimes rewritten by introducing the “isotropic surface stress” (s) as
R γ d
6
2 s s s
. [4]
Both Equations [3] and [4] are referred to as Stoney’s formula or Stoney’s equation. It should be noted here, that the original Stoney equation given above is not valid in general, as it de- scribes a one-dimensional stress-curvature scenario. This is not fulfilled in most applications.
In order to account for the biaxial nature of the stress we have to replace Es by Es /(1s). The film stress can be given by
f s
2 s s
) - 6(1 ν Rt σ d
, [5]
and the interface stress as
ν κ d ν R
γ d
) - 6(1 )
-
6(1 s
2 s s s
2 s s s
, [6]
where is the curvature of the strip. Consequently
κν R d
ν
γ d
1 6(1- )
) -
6(1 s
2 s s s
2 s s s
[6a]
in accordance with Equations [1]-[2].
Equations [6] and [6a] can be valid under the following conditions: (a) The substrate is homo- geneous, linearly elastic, and uniformly thick. (b) The stress is uniform throughout the film thickness. (c) The substrate thickness is much greater than the film thickness (the tf /ds ratio should be 10-3). (d) the radius of curvature of the substrate is much greater than the thickness of the composite structure, i.e. the bending displacement is small compared to the thickness of the substrate.
It should be noted that a number of authors have tried to modify Stoney's approach over the years, and several modified equations have been derived, however, these equations can usu- ally be written in a form equivalent to Equation [1], according to which the change of the re- ciprocal radius (1/R) of curvature of the plate (i.e. the change in the curvature) has to be known for the determination of s .
The values of (1/R) = s/ki can be calculated, if the changes of the deflection angle of a laser beam mirrored by the cantilever are measured using an appropriate experimental setup (Figure 1), or the deflection of the plate is determined directly using an atomic force microscope (AFM) (or a nanointender, a scanning tunneling microscope (STM), etc.). Of course, the de- flection of a strip or a plate can also be measured interferometrically.
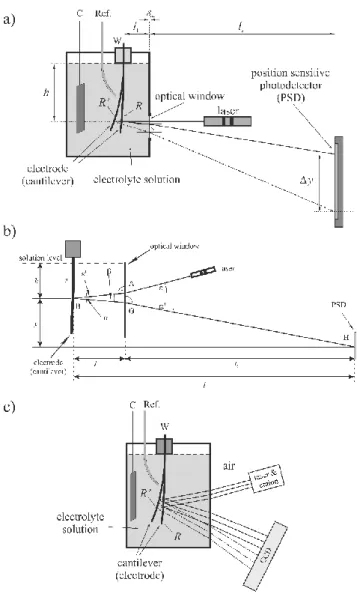
Figure 1 a) Schematic representation of a typical electrochemical (optical) bending beam setup (normal incidence of the light beam). Δy is the displacement of the light spot on the position sensitive (photo)detector (PSD) if the radius of curvature changes from R to R’, l1 is the distance between the clamped end of the probe (cantilever, electrode) and the optical window, l2 is the distance between the optical window and the photodetector, h is the distance between the solution level and the re- flection point, ow is the thickness of the optical window, respectively. C,W: connections to the working and counter electrodes, respectively, Ref.: Luggin capillary to the reference electrode. b) Optical configuration of the bending beam experimental setup in a system consisting a liquid phase (non-normal incidence of the light beam). : the angle of incidence of the light beam coming directly from the laser (in air), : angle of incidence at G, ' : the angle of refraction at A, ' : angle of refraction at G, H : light spot at H on the detector plane, l1 : the distance between the optical window and the reflection point (B) on the electrode, l2 : the distance between the optical window and the position sensitive detector (PSD), l : the distance between the electrode and the photodetector, s : the length of the electrode in the solution, h : the distance between the solution level and the reflec- tion point. y is the vertical distance between the light spot on the cantilever and the light spot on the
PSD. c) The MOS setup with CCD camera in electrochemical systems. C,W: connections to the working and counter electrodes, respectively, Ref.: Luggin capillary to the reference electrode.
Optical detection of the deformation with direct position sensing
Figure 1b shows a possible arrangement for electrochemical bending beam experiments with optical detection. Such a setup can be used mainly for the investigation of small deflec- tions, and several details may be different in special cases. As it can be seen in the Figure, l is the distance between the electrode and the photodetector, l1 is the distance between the optical window and the reflection point (B) on the electrode, l2 is the distance between the optical window and the detector plane, and s is the length of the electrode in the solution, respectively.
The angle of incidence of the light beam coming directly from the laser (in air) is . Because of the refraction at A the direction of the beam changes, the new direction of it (in the solution) is AB, the angle of refraction is '. The laser beam arriving from the direction AB is reflected at point B on the surface. The direction of the reflected beam (which strikes the surface of the optical window with an angle of incidence of ) is BG. Due to the refraction at G, the direction of the reflected beam changes again, the new direction of it (in air) is GH, and the angle of refraction is '. The reflected beam results in a light spot at H on the detector plane. According to the above considerations, if the radius of curvature of the electrode changes, a displacement of the light spot (Δy) on the position sensitive detector (PSD) can be observed.
Using the scheme shown in Figure 1b and Schnell’s law (sin sinns, where ns is the re- fractive index) it can be shown that in the small-angle approximation
s-2 2
12 s
s
2 2 3
s
2 , sin
1 sin 1
1 2 ξ n
lhn y lhn n
R y
[7]
The factor ξ
,ns
in square brackets in Equation [7], expressing the effect of the inci- dent angle, is a monotonously decreasing function . For ns (20 ºC) 1.333 (pure water) and for = 20 it has the value of ξ
30,1.333
= 0.859, for = 20 and ns (20 ºC) 1.420 (this is the refractive index e.g. of propylene carbonate) ξ
20,1.420
= 0.855, respectively. Note that if the deflection of the electrode is small and tends to zero (“normal incidence”) we arrive at the formula for perpendicularly incident light:
R lhny2 s1
[8]
or
2 s
1 lhn
R y
[9]
Comparing Equations [1], [6a] and [9] we get
R lhn ky ν
γ d 1
2 ) -
6(1 S s i
2 S S
s
. [10]
As it can be seen from Equation [10], for the calculation of s only the experimental determination of Δy is necessary, if the actual values of ki (or ds, Es, νs), l, h, and ns are known.
Unfortunately, in many studies concerning electrochemical bending beam experiments with optical detection, schemes of experimental arrangements can be found in which the direction of the reflected beam before and after passing the optical window or the air/solution boundary is indicated incorrectly, since the effect of refraction is ignored. It is even more problematic that the effect of refraction is often neglected in the data evaluation process as well, no reference is made to the refractive index of the solution, or the value of the refractive index of the solution is not indicated. Since refractive indices of aqueous solutions are about 1.33 1.48, it is evident from the above equations that the complete neglect of the bending of the laser beam due to refraction at the optical window may cause an error of about 25-32 % in the determination of
s (because of ns only!), and the error is more pronounced in the case of liquids of higher refractive index. The error is even greater if the incident angle is significantly different from zero.
It should be noted here that the so-called a multi-beam optical sensing (MOS) technique can also be used for the measurement of potential or temperature induced changes in the cur- vature of film/substrate assemblies. With this technique, the spacings between a one-dimen- sional array of multiple laser reflections off the cantilevered substrate can be continuously mon- itored with a charge coupled device (CCD) camera (Figure 1c). By using the small-angle ap- proximation the following equation can be used to calculate the sample curvature from the spacing between the beams:
0 0
2 s
cos
D D D n l
φ , [11]
where D is the distance between the laser spots and D0 is its initial value, is the reflection angle of the beam, and l is the optical path length from sample to the CCD camera, respectively.
The factor cos/2l, known as mirror constant, is specific to a setup and is obtained by calibrat- ing the system in Figure 1c with a reference mirror of known curvature in the sample plane.
Experimental results (examples)
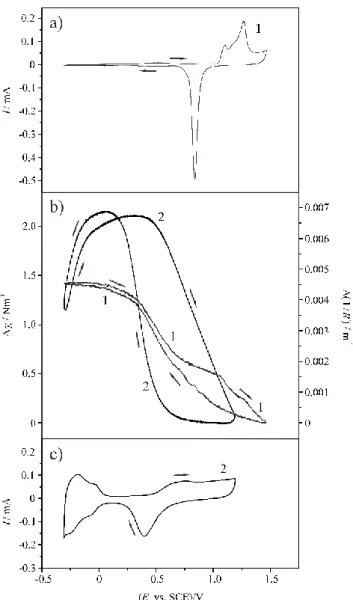
Noble metals like platinum and gold in contact with electrolyte solutions are frequently used to study electrode processes. The Pt | H2SO4(aq) electrode is assumed to be reversible with respect to the adsorption processes of hydrogen or oxygen, and the adsorption of other ions is also reversible. On the other hand, the Au | H2SO4 (aq) system can be treated as ideally polar- izable electrode in a certain potential region (“double layer region”). For these reasons, results of interface stress measurements obtained for Au and Pt in contact with aqueous sulfuric acid solutions are presented as illustrative examples. Cyclic voltammograms (CV-s) of gold and platinum in 0.1 M H2SO4 solution and simultaneously recorded voltdeflectograms ((1/R) vs.
E curves) or voltstressograms (γs vs. E curves) are shown in Figures 2a-c. The cantilever probes used for the measurements presented here were prepared by evaporating 150 nm thick gold or 80 nm thick platinum layer on a very thin layer of titanium evaporated on one side of a glass strip after careful cleaning of the surface.
As it can be seen from Figure 2b, the change in the radius of curvature in case of gold is about 0.0046 m-1, in the potential range from –0.3 V to 1.5 V vs. the KCl-saturated calomel electrode (SCE), while in case of platinum the changes are greater, the difference between the maximum and minimum value in the potential range from –0.3 V to 1.2 V vs. SCE is about 0.0069 m-1. Hysteresis can be observed both in the hydrogen and oxygen adsorption/desorption regions.
Figure 2 a) Cyclic voltammogram (CV) of gold (1) recorded in c = 0.1 mol·dm-3 aqueous H2SO4 solution at 25 °C (sweep rate: ν = 50 mVs-1). b) Interfacial stress change (γs) vs. electrode potential (E) (or curvature change (1/R) vs. electrode potential E) curves for gold (1) and platinum (2) in c = 0.1 mol·dm-3 aqueous H2SO4 solutions at 25 °C, recorded simultaneously with the CV-s pre- sented in Figures 2a and 2c (sweep rate: ν = 50 mVs-1). c) Cyclic voltammogram of platinum (2) recorded in c = 0.1 mol·dm-3 aqueous H2SO4 solution at 25 °C (sweep rate: ν = 50 mVs-1).
E: electrode potential, I: current, R: radius of curvature of the cantilever, SCE: saturated calomel electrode (KCl);
Cantilever probes: 150 nm thick gold or 80 nm thick platinum layers deposited on glass strips by vacuum evaporation, surface area; Dimensions and physical properties of the glass substrate: total length: ls = 60.0 mm, width: ws = 5.0 mm, thickness: ts = 147 μm, Poisson’s ratio: νs = 0.230, Young’s modulus: Es = 7.09·1010 Nm-2, and refractive index of the solution: ns = 1.522, i.e.
ki·tf = 331.6 N; The geometrical area of the electrodes (the area of the metal layer in contact with the electrolyte solution): A = 2.0 cm2.
Interferometric detection
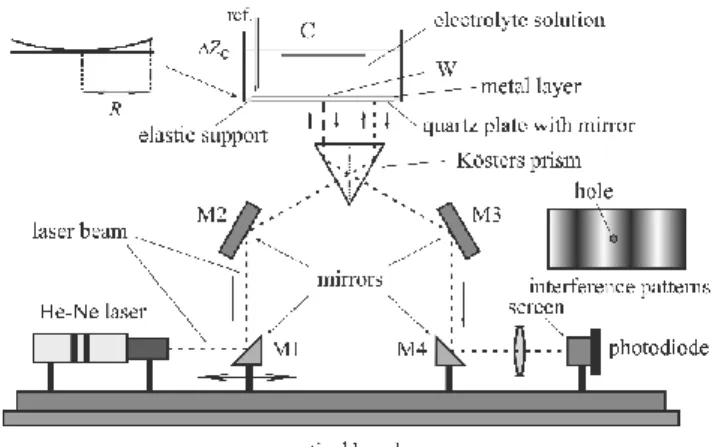
The deflection of a strip or a plate can also be measured interferometrically. Figure 3 shows the principle of the electrochemical Kösters laser interferometer, which can be used for the determination of the deformation of an elastic plate. (Not shown in the Figure are the ad- justment devices for rotating and turning the optical components in three dimensions, and tilting the electrochemical cell with the quartz plate at its bottom with respect to the prism, and the damping elements.) The Kösters laser interferometer (Kösters-prism interferometer) is a laser- illuminated double-beam interferometer. The main advantage of this type of interferometer is its high immunity to environmental noise due to the close vicinity of the two interfering beams.
This immunity makes it an ideal tool for high-precision measurements. The central constituent of the interferometer is the Kösters-prism beam splitter, which produces two parallel coherent beams. The two reflected beams recombine in the prism, and an interference pattern can be observed. Usually, the Kösters prisms are constructed of two halves of fused silica joined to- gether along a coated surface, which acts as a beam splitter. The angles of the prism halves are 30°-60°-90°, with high angular accuracy, and one long cathetus side is semi-transparent (the reflection and transmission coefficients are equal). The semi-transparent layer performs an equal intensity division of the beam, reflecting half and transmitting half, imparting a 90 degree phase lag in the transmitted beam. This division and phase shift gives the Kösters prism its interferometric properties: the beam reflected from one side of the prism interferes construc- tively or destructively with the beam transmitted from the other side.
As it can be seen in Figure 3, the light from the laser is reflected by mirrors M1 and M2 in the direction perpendicular to the entrance side of the prism. The point of entrance determines the distance of the two beams emerging from the base of the prism. They are reflected at a nearly zero angle of incidence from the plate. The interfering light leaves the Kösters prism through the exit side, and it is projected (using the mirrors M3 and M4) onto a screen with a hole of a given diameter and a photodiode behind it. The deformation of the plate causes sinus- oidal changes of the light intensity at the point of measurement in the interference pattern
The difference between the optical path lengths (2ΔZC) can be determined from the change in light intensity detected by the photodiode. The height ΔZC of the center of the plate with respect to a plane at a given radius yields s from the appropriate form of Hooke's law
C
S k Z
γ
[12]
The sensitivity is of the order 0.1 nm with respect to ZC and 1 mN/m with respect to s. The constant k in Equation [12] is determined by the mechanical properties of the quartz plate (ra- dius R) and by the type and quality of the support at the edge of the plate.
Choosing a circular AT-cut quartz plate with a thin metal layer on it in contact with the solution being the working electrode in an electrochemical cell provides the advantage to meas- ure simultaneously surface energy, mass and charge. (If the metal layers on both sides of the quartz disc are connected to an appropriate oscillator circuit, the device can be used as an elec- trochemical quartz crystal nanobalance.) In addition, since the light beams do not pass the air/solution interface, the effects of light refraction at the surface are excluded. Even though there are great advantages of the interferometric detection, there are several problems connected with this method. For instance, the shape and the magnitude of the deformation Z(r,) as a function of the radial distance r and the angle depends on the type of support at the edge of the circular plate. The largest deformation and thus the highest sensitivity for measurements of the surface stress change is expected for the “unsupported” plate. A plate is also unsupported if a mounting is present but exerts no forces on the edge. Evidently, the design and realization of such a device is very difficult. In the case of evaporated/sputtered metal layers the high surface stress changes may cause problems with the adhesion of the films. In addition, no absolutely satisfactory solution has been found for the problem of making reliable electrical connections to the metal layers on the quartz crystal.
Figure 3 Interferometric setup for electrochemical purposes with He-Ne laser and Kösters prism.
W: working electrode, C: counter electrode, ref.: reference electrode, M1, M2, M3, M4: mirrors.
Detection of the deformation by microscopy
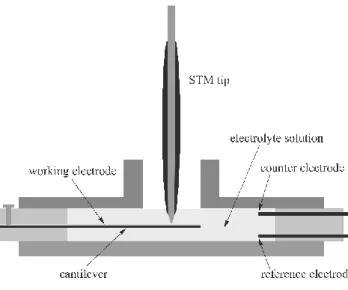
A possible method to measure the bending of a strip or a plate is to use atomic force or scanning tunneling microscopy (AFM, STM) systems. The STM may be used then as a means to simultaneously investigate the structure of the surface (Figure 4). Unfortunately, even this method is not without pitfalls. In electrolyte solutions there is double layer like structure also around the STM tip. Consequently, there are some interactions between the tip of the STM and the sample that seem to be unavoidable. These are: long range electrostatic interactions between electrical (electrochemical) double layers, and structural/dispersion/hydration forces that dom- inate the interaction at very short ranges. Some of these contributions have been widely studied but some are marginally understood. Another source of error, which can be important, arises because the exact elastic behavior of membranes is strongly dependent on the boundary condi- tions, which are not well defined in many experiments.
Figure 4 Schematic illustration of a typical arrangement for STM studies at the solid/liquid inter- face which allows simultaneously to measure the bending of the cantilever when the electrode po- tential is varied.
Piezoelectric method
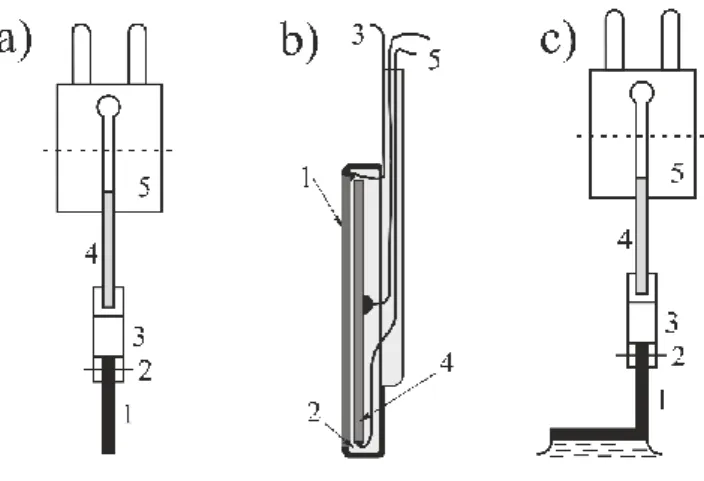
According to our knowledge, A. Ya. Gokhshtein (1966) was the first who used a piezo- electric element to measure changes of the interface stress with the electrode potential E at platinum electrodes in sulfuric acid solutions. The method is “direct” in the sense that it is the variation in the electrode deformation that is “registered” directly by a piezoelectric element. A metal plate is rigidly connected, in a special manner, to a highly sensitive piezoelectric element (see Figure 5).
Figure 5 Different designs of devices for the “piezoelectric method”. a: Piezoelement unit with plunger. 1: metal plate, rod or filament; 2: holder; 3: rib; 4: piezoelement; 5: plug; b: Unit with a metal foil rigidly connected to a highly sensitive piezoelectric element; 1: metal foil; 2: epoxy ce- ment; 3: lead to potentiostat; 4: piezoelectric ceramic disk or plate; 5: leads to amplifier or analyzer;
c: Piezoelement unit with foot. 1: metal plate, rod or filament; 2: holder; 3: rib; 4: piezoelement; 5:
plug;
The applied potential consists of a mean (DC) component upon which is superimposed a high-frequency (AC) component (usually a sinusoidal signal is superimposed on a linear po- tential sweep). Electrode potential oscillation with the amplitude E result in oscillation with an amplitude s in the interface stress, which in turn set up forces of inertia that excite vibra- tions in the entire electrode-piezoelement unit. The piezoelectric element converts the mechan- ical oscillations to alternating electric signals, which can be detected by using a lock-in ampli- fier, an oscilloscope or a frequency response analyzer. In fact, this is some kind of electrome- chanical immittance measurement. The geometry of the electrode and its oscillation is of no fundamental importance. The metal in contact with the electrolyte solution may be made in the form of a tight filament which can make length-wise oscillations, a straight rectangular rod which can make bending oscillations, etc. The alternating surface stress sets in motion not only the electrode, but the whole electrode&piezoelement system, since the inertia forces are essen- tial.
The oscillations of surface stress can also be excited by the application of high-frequency current. In this case the amplitude of the surface charge density (q) is kept constant by specify- ing the amplitude of the alternating current. Under such conditions s will be proportional to the derivative s/E. If the electric variable is the potential, and the measurement is carried out with a constant amplitude E, the amplitude of the piezoelectric voltage |A| is proportional to the derivative of the surface stress with respect to the electrode potential /E, and the phase
angle () contains information about the change in the sign of s/E. The s/q value is related to s/E by
E C q E E
q
s s 1 s
, [13]
where C is the electrode capacitance.
By applying the piezoelectric method s/E is measured at high frequencies and the quantitative determination of interface stress changes requires a sophisticated calibration pro- cedure (the transfer function of the mechanical coupling is rather complicated). However, the potentials of extrema of the function interface stress vs. potential can be obtained directly. The relation between the piezoelectric signals (|A| and ) and the s vs. E curve is shown schemat- ically in Figure 6.
Figure 6 Measured quantities in a typical piezoelectric experiment: the amplitude of the piezoe- lectrical signal |A|, the phase angle , and the change of interface stress s, as a function of the electrode potential E. Numerical integration of the experimentally determined |A| curve with respect to the electrode potential, yields a quantity proportional to s.
Obviously, because of the dynamic features of the method, the recorded variation in interface stress does not always correspond to equilibrium conditions. For nearly ideally polar- izable electrodes, e.g. Au in contact with aqueous sodium-sulfate solution in a certain electrode potential range, equilibrium may be reached during the measurement, because the time for charging/discharging of the electrochemical double layer is shorter than the period of oscillation of the interfacial tension. In case of platinum the period of oscillation is shorter than the time necessary for adsorption of hydrogen or oxygen to reach equilibrium, thus the results depend on the frequency of oscillation as well as on the rate on the scan rate of the linear sweep. On the other hand, an important advantage of the piezoelectric method is the selective separation of surface energy contributions from other side effects, such as changes in bulk stress due to diffusion or Joule heating of the electrolyte solution.
The extensometer method and related techniques
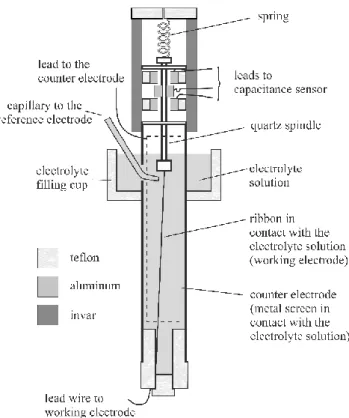
In the extensometer device a ribbon in contact with an electrolyte solution serves as a working electrode in an electrochemical cell. The ribbon is kept under an approximately con- stant force (a mechanically applied tensile stress) throughout the experiment by mounting it axially inside a glass tube.
As depicted in Figure 7, the upper end of the ribbon or wire is attached to a spring. The spring constant of the spring should be small compared with the stiffness of the ribbon. The lower end of the ribbon is attached to the glass tube through a Teflon plug. An aluminum bobbin mounted on the quartz spindle forms two capacitors with fixed plates mounted in the head.
Small changes in the two capacitances due to length changes of the ribbon are measured with an electronic capacitance sensor. The output voltage V(ΔL) and the change in the length of the ribbon is described by the relationship:
C C
K LK L
V( ) 1 (1 1)(1 2) 2 , [14]
where C1 and C2 are the two capacitances and K1 and K2 are proportionality constants.
The variation in surface stress, γs, can be obtained from the change in the ribbon length L by the equation derived by T.R. Beck (1969):
PL L γ AE
s r , [15]
where A and P are the cross-sectional area and periphery of the ribbon and Er is Young’s mod- ulus.
Figure 7 Schematic design of an extensometer
Unfortunately, thermal expansion constitutes a serious problem in the extensometer method. The error due to thermal expansion can be reduced, but unless the effect on thermal expansion can be quantitatively accounted for, the results of the extensometer method cannot be conclusively interpreted.
Acknowledgement: Support from the Hungarian Scientific Research Fund (OTKA) under Grant Agreement num- ber K 109036 is acknowledged.
Nomenclature
Symbols and Units
A area, cross-sectional area of the ribbon in the extensometer
C capacitance
ds thickness of the substrate (plate)
E electrode potential
Er Young’s modulus of the ribbon in the extensometer
Es Young’s modulus (modulus of elasticity) of the substrate (cantilever) h distance between the solution level and the reflection point
ki sensitivity constant
l distance between the electrode and the photodetector
l1 distance between the clamped end of the probe and the optical window l2 distance between the optical window and the photodetector
L length of the ribbon in the extensometer
L change of the ribbon length in the extensometer ns refractive index of the solution
P periphery of the ribbon in the extensometer
q surface charge density
R radius of curvature of the substrate s length of the electrode in the solution
y vertical distance between the light spot on the cantilever and the light spot on the PSD
Δy displacement of the light spot on the position sensitive detector
tf film thickness
V voltage
s interface (surface) stress
s changes of the interface (surface) stress
angle of incidence
' angle of refraction
curvature of the substrate
s Poisson’s ratio
film stress
Abbreviations and Acronyms
AC alternating current
AFM atomic force microscope
CCD charge coupled device
CV cyclic voltammogram
DC direct current
ITIES interface between two immiscible electrolyte solutions MOS multi-beam optical sensing
PSD position sensitive (photo)detector
SCE saturated calomel electrode
STM scanning tunneling microscope
Further Reading
Beck TR (1969) "Electrocapillary curves" of solid metals measured by extensometer instru- ment. Journal of Physical Chemistry 73 (2): 466-468.
Bikerman JJ (1978) Surface Energy of Solids. In: Topics in Current Chemistry 77, Inorganic and Physical Chemistry, pp. 1-66. Berlin: Springer-Verlag.
Fredlein RA, Bockris JO’M (1974) An “electrocapillary” study of the gold-perchloric acid so- lution interface. Surface Science 46 (2) 641-652.
Girault H, Schiffrin D (1989) Electrochemistry of liquid-liquid interfaces. In: Bard AJ (ed) Electroanalytical Chemistry, Vol. 15. New York: Marcel Dekker.
Gokhshtein AYa (1970) The estance method. Elektrokhimiya 6: 979-985.
Gokhshtein AYa (1976) Surface Tension of Solids and Adsorption. Moscow: Nauka.
Grahame DC (1947) The electrical double layer and the theory of electrocapillarity. Chemical Reviews 41 (3): 441-501.
Haiss W, Sass JK (1995) Adsorbate-induced surface stress at the solid electrolyte interface measured with an STM. Journal of Electroanalytical Chemistry 386 (1-2): 267-270.
Haiss W (2001) Surface stress of clean and adsorbate-covered solids, Reports on Progress in Physics 64 (5): 591-648.
Heusler KE, Láng G (1997) Surface energies of solid electrodes. Electrochimica Acta 42 (5):
747-756.
Horányi G, Láng GG (2006) Double-layer phenomena in electrochemistry: Controversial views on some fundamental notions related to electrified interfaces. Journal of Colloid and In- terface Science 296 (1): 1-8.
Ibach H, Bach CE, Giesen M, Grossmann A (1997) Potential-induced stress in the solid-liquid interface: Au(111) and Au(100) in an HClO4 electrolyte. Surface Science 375 (1): 107- 119.
Jaeckel L, Láng GG, Heusler KE (1994) A new interferometric method to investigate surface energies at solid electrodes. Electrochimica Acta 39 (8-9): 1031-1038.
Kongstein OE, Bertocci U, Stafford GR (2005) In situ stress measurements during copper elec- trodeposition on (111)-textured Au. Journal of the Electrochemical Society 152 (3):
C116-C123.
Kramer D, Viswanath RN, Weissmüller J (2004) Surface-Stress Induced Macroscopic Bending of Nanoporous Gold Cantilevers. Nano Letters 4: 793-796.
Láng G, Heusler KE (1994) Problems related to the specific surface energy of solid electrodes.
Journal of Electroanalytical Chemistry 377 (1): 1-7.
Láng G, Heusler KE (1997) Surface energies of an electrode in equilibrated partially miscible electrolytes. Journal of the Chemical Society Faraday Transactions 93 (4): 583-589.
Láng GG, Seo M (2000) On the electrochemical applications of the bending beam method Jour- nal of Electroanalytical Chemistry 490 (1-2): 98-101.
Láng GG, Seo M, Heusler KE (2005) Simultaneous oscillations of surface energy, superficial mass and electrode potential in the course of galvanostatic oxidation of formic acid. Jour- nal of Solid State Electrochemistry 9 (5): 347–353.
Láng GG (2009) Application of the Koesters Interferometer in Electrochemistry. In: Halsey D, Raynor W (eds.) Handbook of Interferometers: Research, Technology and Applications, pp. 591-604. Hauppauge: Nova Science Publishers.
Láng GG, Barbero C (2012). Laser Techniques for the Study of Electrode Processes, Mono- graphs in Electrochemistry. Scholz F (ed.). Heidelberg, New York: Springer.
Láng GG (2016) Comment on “In Situ Measurements of Stress-Potential Coupling in Lithiated Silicon” [J. Electrochem. Soc., 157, A1253 (2010)], “On Plastic Deformation and Frac- ture in Si Films during Electrochemical Lithiation/Delithiation Cycling” [J. Electrochem.
Soc., 160, A1885 (2013)], and “Real-Time Stress Measurements in Germanium Thin Film Electrodes during Electrochemical Lithiation/Delithiation Cycling” [J. Electrochem.
Soc., 162, A2840 (2015)]. Journal of the Electrochemical Society 163 (7): Y15-Y16.
Láng GG, Kovács N, Vesztergom S, Ujvári M, Zalka D, Szekeres K (2017) Experimental meth- ods for the determination of stress changes at electrified solid-liquid interfaces. tm - Tech- nisches Messen 84.
Lin KF, Beck TR (1976) Surface stress curves for gold. Journal of the Electrochemical Society 123 (8): 1145.
Malpas RE, Fredlein RA, Bard AJ (1979) The piezoelectric detection of electrode surface pro- cesses. Journal of Electroanalytical Chemistry 98: 171-180.
Morcos I (1978) The Interfacial Tension of Solid Electrodes. In Thirsk HR (ed) Specialist Pe- riodical Reports Electrochemistry, Vol 6, pp. 65-97. London: The Chemical Society, Bur- lington House.
Parsons R (1954) Equilibrium properties of electrified interfaces. In: Bockris JO’M, Conway BE (eds) Modern Aspects of Electrochemistry, Vol. 1. New York: Academic Press.
Raiteri R, Butt HJ, Grattarola M (1998) Changes in surface stress measured with an atomic force microscope. Scanning Microscopy 12: 243-253.
Rokob TA, Láng GG (2005) Remarks on the electrochemical application of optical methods for the determination of stress in electrodes. Electrochimica Acta 51 (1): 93-97.
Sahu SN, Scarminio J, Decker F (1990) A laser beam deflection system for measuring stress variations in thin film electrodes. Journal of the Electrochemical Society 137 (4): 1150- 1154.
Stoney GG (1909) The tension of metallic films deposited by electrolysis. Proceedings of the Royal Society. London A32 (82): 172-175.
Trasatti S, Parsons R (1986) Interphases in systems of conducting phases. Pure&Applied Chem- istry 58 (3): 437-454.
Ueno K, Seo M (1999) Study of adsorption of iodide ions on gold electrode by a laser-beam deflection method compared with a piezoelectric technique. Journal of the Electrochem- ical Society 146 (4): 1496-1499.
Ujvári M, Vesztergom S, Pénzes CsB, Láng GG (2013) Changes of the interfacial stress with electrode potential in the Ru|0.1 M perchloric acid system. Electrochemistry Communi- cations 28: 111-113.
Van Overmeere Q, Vanhumbeeck JF, Proost J (2010) On the use of a multiple beam optical sensor for in situ curvature monitoring in liquids. Review of Scientific Instruments 81:
045106.
Vanhumbeeck JF, Proost J (2007) Electrochemical processing of ultrathin metallic oxides fea- turing in-situ monitoring of growth stress transitions. ECS Transactions 2 (6): 281-294.