This is the accepted manuscript made available via CHORUS. The article has been published as:
β-decay half-lives of neutron-rich nuclides in the A=100–110 mass region
A. C. Dombos, A. Spyrou, F. Naqvi, S. J. Quinn, S. N. Liddick, A. Algora, T. Baumann, J.
Brett, B. P. Crider, P. A. DeYoung, T. Ginter, J. Gombas, E. Kwan, S. Lyons, W.-J. Ong, A.
Palmisano, J. Pereira, C. J. Prokop, D. P. Scriven, A. Simon, M. K. Smith, and C. S.
Sumithrarachchi
Phys. Rev. C 99, 015802 — Published 10 January 2019
DOI: 10.1103/PhysRevC.99.015802
A. C. Dombos,1, 2, 3,∗ A. Spyrou,1, 2, 3F. Naqvi,1, 3 S. J. Quinn,1, 2, 3S. N. Liddick,1, 4, 3 A. Algora,5, 6 T. Baumann,1 J. Brett,7B. P. Crider,1, 8 P. A. DeYoung,7 T. Ginter,1 J. Gombas,7 E. Kwan,1 S. Lyons,1, 3 W.-J. Ong,1, 2, 3 A.
Palmisano,1, 2, 3J. Pereira,1, 3 C. J. Prokop,1, 4D. P. Scriven,2A. Simon,9M. K. Smith,1, 3and C. S. Sumithrarachchi1
1National Superconducting Cyclotron Laboratory, Michigan State University, East Lansing, Michigan 48824, USA
2Department of Physics and Astronomy, Michigan State University, East Lansing, Michigan 48824, USA
3Joint Institute for Nuclear Astrophysics, Michigan State University, East Lansing, Michigan 48824, USA
4Department of Chemistry, Michigan State University, East Lansing, Michigan 48824, USA
5Instituto de F´ısica Corpuscular, CSIC-Universidad de Valencia, E-46071, Valencia, Spain
6Institute of Nuclear Research of the Hungarian Academy of Sciences, Debrecen H-4026, Hungary
7Department of Physics, Hope College, Holland, Michigan 49422-9000, USA
8Department of Physics and Astronomy, Mississippi State University, Mississippi State, Mississippi 39762, USA
9Department of Physics and Joint Institute for Nuclear Astrophysics, University of Notre Dame, Notre Dame, Indiana 46556, USA
(Dated: December 11, 2018)
β-decay half-lives of neutron-rich nuclides in the A = 100-110 mass region have been measured using an implantation station installed inside of the Summing NaI(Tl) (SuN) detector at the National Superconducting Cyclotron Laboratory. Accurate half-lives for these nuclides are important for nuclear astrophysics, nuclear structure, and nuclear technology. The half-lives from the present work are compared with previous measurements, showing overall good agreement.
I. INTRODUCTION
In the field of nuclear astrophysics, the rapid neutron- capture process, or rprocess, is the mechanism cited to explain the abundance of roughly half of the stable nu- clides beyond the iron peak that are observed in the solar system [1]. Reaction network calculations of the r pro- cess rely on accurate nuclear properties, such asβ-decay half-lives andβ-delayed neutron emission probabilities, of the participating nuclides in order to calculate the final abundance pattern, which is then compared with obser- vations from the solar system and metal-poor halo stars [2]. Accurate half-life measurements in the intermediate mass region of A = 100-110 can help constrain half-life predictions for very neutron-rich nuclei on ther-process path, for which little experimental data exist.
Recently, a kilonova has been observed by various ob- servatories [3] in coincidence with the detection of gravi- tational waves from the merger of two neutron stars [4].
A kilonova is the electromagnetic counterpart to gravi- tational waves from certain mergers of compact objects, and is powered by the radioactive decay of the newly created r-process nuclides [5]. The nuclear properties of the decaying nuclides will have a direct impact on the observed electromagnetic emission from a kilonova [6].
In the field of nuclear structure, β decay is a tool to study the shapes of certain nuclides. By compar- ing theoretical and experimental Gamow-Teller transi- tion strength, B(GT), distributions, the shape of the ground state of a nuclide can be identified as oblate, spherical, or prolate [7] in particular cases. Since the experimentalB(GT) depends inversely on the half-life of
∗dombos@nscl.msu.edu
the nuclide, an accurate half-life is necessary for a proper comparison to the theoreticalB(GT). This is especially true for many neutron-rich nuclides in the A = 100-110 mass region, for which theB(GT) is predicted to be sen- sitive to the deformation [8,9].
In the field of nuclear technology, calculating the decay heat of fission products is important for the operation of a nuclear reactor [10]. These summation calculations rely on a large amount of nuclear data of the fission prod- ucts in a reactor, one being the half-life. A report by the Nuclear Energy Agency [11] has requested a reeval- uation of nuclear data for certain nuclides in order to more accurately calculate the decay heat. Many of these neutron-rich nuclides are around the A = 100-110 mass range [12].
In this paper, we provide half-life measurements for neutron-rich nuclides in the A = 100-110 mass region.
Half-lives for many nuclides in this paper were measured decades ago in experiments that performed chemical sep- aration of fission fragments. Both the separation and identification of fragments in these past experiments were challenging and authors often reported possible contami- nation issues. For this reason, the present work provides new measurements of half-lives in the A = 100-110 mass region using a consistent technique. The experimental details are presented in Sec. II, the analysis procedure is described in Sec. III, the half-life measurements are reported in Sec. IV, and conclusions are given in Sec. V.
II. EXPERIMENTAL DETAILS
The experiment was performed at the National Super- conducting Cyclotron Laboratory (NSCL) at Michigan State University. The Coupled Cyclotron Facility pro- duced a primary beam of 124Sn45+ with an energy of
2 120 MeV/u, which impinged upon a9Be production tar-
get with a thickness of 403 mg/cm2. The resulting ions from the fragmentation reaction were filtered with the A1900 fragment separator [13], using a 60 mg/cm2 alu- minum wedge, to produce a secondary cocktail beam that consisted of neutron-rich nuclides with atomic numbers ranging from 39 to 43 and mass numbers ranging from 100 to 110. Due to the use of the full momentum ac- ceptance (5%) of the separator, a thin, plastic (BC-400), position-sensitive scintillator at the intermediate disper- sive image was used to provide information about the mo- mentum (and time of flight) of an ion. After the A1900 fragment separator, the ions were delivered to the exper- imental end station, which, ordered along the beam line, consisted of two silicon PIN detectors, an implantation station, and the Summing NaI(Tl) (SuN) detector. The implantation station consisted of a double-sided silicon- strip detector (DSSD) and a silicon surface barrier detec- tor. Signals from all of the detectors in the end station were recorded with the NSCL Digital Data Acquisition System (DDAS) [14].
The two silicon PIN detectors were installed upstream from SuN and provided information about the energy loss and time of flight of an ion. The first and second PIN de- tectors, which had thicknesses of 488µm and 503µm, re- spectively, were rotated 40◦to create effective thicknesses of approximately 637µm and 657µm, respectively. The angle of rotation was chosen so that, after energy deposi- tion in the PIN detectors, the ions of interest would stop, or implant, at the center of the DSSD.
After the PIN detectors, there was a collimator (3.8 cm diameter) to collect ions that would have otherwise been deposited on the inside of the beam pipe and not arrive at the downstream implantation station. A wall of lead bricks was built between the collimator and SuN to prevent random coincidences betweenγ rays from ac- cumulated activity on the collimator andγ rays fromβ decays in the implantation station.
The implantation station was installed in the center of the borehole of SuN. The DSSD was positioned at the geometric center of SuN, and was used to detect high- energy ion implantations and subsequent low-energy β- decay electrons, which were spatially and temporally cor- related to one another [15]. The correlation procedure is described in Sec. III A. Simultaneous detection of im- plantations (depositing energy on the order of GeV in the DSSD) andβ-decay electrons (depositing energy on the order of keV and MeV in the DSSD) was achieved with dual-gain preamplifiers. The low-gain stage was used for detecting implantations, while the high-gain stage was used for detecting β-decay electrons. Manufactured by Micron Semiconductor Ltd. [16], the DSSD was designed to fit inside the borehole of SuN using the BB8 design.
The silicon chip of the DSSD had a thickness of 1030µm, dimensions of 21.8 mm by 21.8 mm, and an active area of 20.0 mm by 20.0 mm. There were 16 horizontal strips on the front side and 16 vertical strips on the back side, effectively creating 256 pixels. All strips had a pitch of
1250µm. Roughly 25 mm downstream from the DSSD was a silicon surface barrier detector that acted as a veto detector to detect any ions (particularly light, charged particles) that did not stop in the DSSD. The veto de- tector was manufactured by ORTEC with model number BU-014-300-500 (active area of 300 mm2 and depletion depth of 500µm).
An external trigger, which was a “front-back coin- cidence” and configured in hardware, was required to record signals in the DSSD. For a given side of the DSSD, an or signal was generated whenever a strip produced a signal above threshold. Whenever an or from the front side and anor from the back side overlapped in time, anandsignal was created and used as a validation window for recording the raw signals that originally pro- duced theor signals. The external trigger reduced the recording of random noise, which enabled the lowering of trigger thresholds and therefore increased the detection efficiency of low-energyβ-decay electrons.
Surrounding the implantation station was the SuN de- tector [17] to employ the total absorption spectroscopy (TAS) technique [18]. SuN is a right-circular cylinder di- vided into eight segments of NaI(Tl), with each segment containing three photomultiplier tubes. The segmenta- tion of SuN is powerful in that both the total energy deposited in SuN as well as the energy deposited in each segment is recorded for a given event. For β-decay ex- periments with SuN [19,20], this translates to knowing the level populated in the daughter nucleus and also the possible subsequent electromagnetic deexcitation of that level in the form ofγ rays. Adding the histograms from all eight segments together produces the sum-of-segments spectrum in which individual γ rays can be identified, while adding together the energies of all eight segments on an event-by-event basis produces the TAS spectrum in which sum peaks that correspond to levels can be iden- tified.
This experiment was the first-ever application of the TAS technique with a fast beam produced via projec- tile fragmentation. Results from later experiments with roughly the same experimental setup have already been published [20–22]. The extractedβ-decay feeding inten- sity distributions for the nuclides in the present work will be presented in forthcoming papers. Here, we used the TAS and sum-of-segments spectra to apply stringent conditions for identifying the nuclides of interest and ex- tracting their half-life.
III. ANALYSIS A. Correlations
In software, events were created using a 2 µs coinci- dence time window and classified as either an implanta- tion or decay.
Events were classified as an implantation if there was a signal in both of the silicon PIN detectors, there was
a measurement of the time of flight and momentum of an ion, there was at least one strip that fired on both sides of the DSSD in the low-gain stage, and there was no signal in the veto detector. The strips of the DSSD in the low-gain stage were gain matched with secondary beam. The pixel in which the implantation occurred was defined by the strip that received the maximum energy deposition on each side. The secondary beam was de- focused to try to illuminate as much of the surface of the DSSD as possible, which resulted in an average time between consecutive implantations for a given pixel near the center of the DSSD of approximately 12 seconds.
Events were classified as a decay if neither silicon PIN detector had a signal, there were no signals in the low- gain stage of the DSSD, there was at least one strip that fired on both sides of the DSSD in the high-gain stage, and there was no signal in the veto detector. The pixel in which the decay occurred was defined in the same way as described for an implantation. The strips of the DSSD in the high-gain stage were calibrated with sources of228Th,
241Am, and 249Cf. The thresholds for the strips in the high-gain stage ranged from 150 keV to 200 keV.
Decays were correlated to an implantation according to the following logic. First, when a decay was identified, implantations that previously occurred were searched for in the correlation field, and whichever implantation was closest in time to the decay was selected as a candidate to be correlated to the decay. In the present work, a single-pixel correlation field was used, meaning the im- plantation and decay had to have occurred in the same pixel. Second, there had to have been a sufficient amount of time that passed between the candidate implantation and the previous implantation in the same pixel. This condition helps to remove ambiguity of the decay origi- nating from the most recent implantation in the correla- tion field. Third, the decay had to have happened within a certain amount of time of the implantation known as the correlation time window. Within this correlation pro- cedure, not all decay events will be correlated to the correct implantation event, resulting in random correla- tions. These random correlations were characterized by performing correlations backward in time [23].
B. Decay Curve
A decay curve was created for each nuclide of interest by histogramming the time difference between the im- plantation of an ion and its subsequentβ decay and was used to extract the half-life. Isolating events in the decay curve from the nuclide of interest was obtained by simul- taneously gating on a sum peak in the TAS spectrum and aγray in the sum-of-segments spectrum. This technique is detailed for a specific nuclide in Sec. IV B.
In addition to any random correlations, in this tech- nique there possibly are additional sources of background that must be considered. If the nuclide of interest to be isolated is the parent, these potential background sources
include events from the decay of future descendants (for example, the daughter) and also from possible charge- state contaminants. Consulting the decay schemes of the parent, future descendants, and charge-state contam- inant enabled the selection of events that included an es- tablished level and γ ray from the decay of the nuclide of interest. In addition, sum peaks andγ rays of higher energies were favored in order to reduce the possibility of including events from incomplete summation in the TAS spectrum and events from Compton-scatteredγ rays in the sum-of-segments spectrum.
If applicable to certain nuclides, the ground-state-to- ground-stateQvalues forβ decay [24] were used to iden- tify appropriate gating regions in the TAS spectrum. For example, the ground-state-to-ground-state Q value for the parent104Nb is 8531 keV, the daughter104Mo is 2153 keV, and the charge-state contaminant101Nb40+is 4628 keV [24]. Therefore, counts in the TAS spectrum above approximately 4628 keV should only originate from the decay of104Nb.
Two decay curves were created for each gating com- bination, with the only difference being that one was created using forward-time correlations and the other using backward-time correlations. The distribution of backward-time correlations, representing random corre- lations between implantations and decays, was fit with an exponential function, the results of which were used and held fixed as a background component while fitting the forward-time correlations with an appropriate form of the Bateman equations [25].
IV. RESULTS
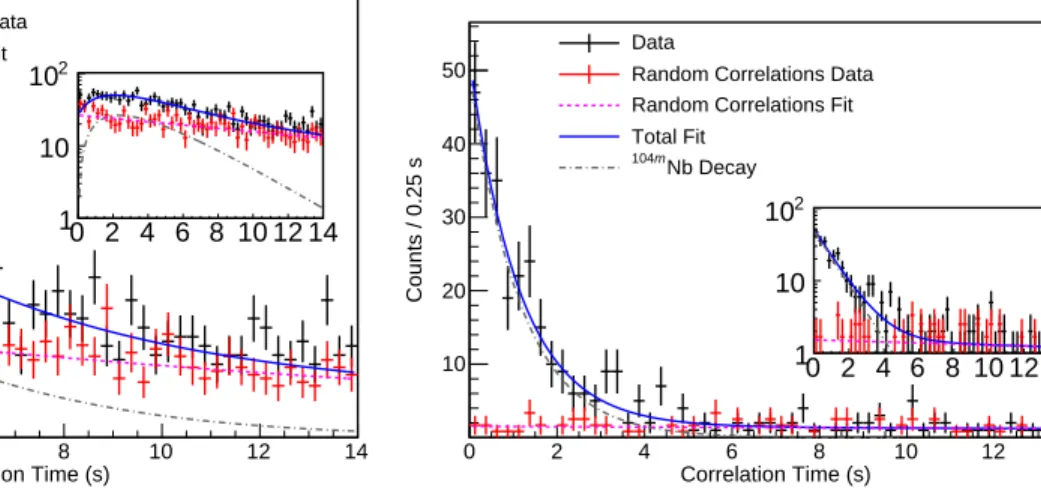
In this section, we discuss eachβ decay separately. In Figs. 1, 3, 4, 5, 6, 7, and 8, “Data” refers to forward- time correlations, “Random Correlations Data” refers to backward-time correlations, “Random Correlations Fit”
refers to the exponential fit of backward-time correla- tions, and “Total Fit” refers to the fit of forward-time correlations with the Bateman equations and an expo- nential background with fixed parameters from the fit of backward-time correlations. TableI contains a descrip- tion of the selection of events in the decay curve and a comparison of the half-life from the present work with previous measurements.
A. 9939Y60→9940Zr59
The half-life of 99Y has been previously measured in fission-based experiments [28–32], experiments using the isotope separator on-line (ISOL) technique [27], and fragmentation-based experiments [26]. The decay curve from the present work is shown in Fig. 1 and resulted in a half-life of 1.27 ± 0.25 s, in good agreement with previous measurements.
4
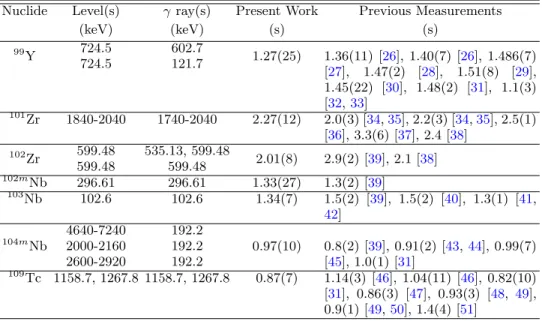
TABLE I. Half-lives from the present work along with previous measurements. The selection of events in the TAS spectrum (“Level(s)”) and sum-of-segments spectrum (“γray(s)”) to extract the half-life are listed for each nuclide. If a reference cited in the ENSDF file could not be obtained, the ENSDF file is cited along with the original reference. A previous measurement that does not contain any uncertainty will have no uncertainty in this table.
Nuclide Level(s) γ ray(s) Present Work Previous Measurements
(keV) (keV) (s) (s)
99Y 724.5 724.5
602.7
121.7 1.27(25) 1.36(11) [26], 1.40(7) [26], 1.486(7) [27], 1.47(2) [28], 1.51(8) [29], 1.45(22) [30], 1.48(2) [31], 1.1(3) [32,33]
101Zr 1840-2040 1740-2040 2.27(12) 2.0(3) [34,35], 2.2(3) [34,35], 2.5(1) [36], 3.3(6) [37], 2.4 [38]
102Zr 599.48 599.48
535.13, 599.48
599.48 2.01(8) 2.9(2) [39], 2.1 [38]
102mNb 296.61 296.61 1.33(27) 1.3(2) [39]
103Nb 102.6 102.6 1.34(7) 1.5(2) [39], 1.5(2) [40], 1.3(1) [41, 42]
104mNb
4640-7240 2000-2160 2600-2920
192.2 192.2 192.2
0.97(10) 0.8(2) [39], 0.91(2) [43,44], 0.99(7) [45], 1.0(1) [31]
109Tc 1158.7, 1267.8 1158.7, 1267.8 0.87(7) 1.14(3) [46], 1.04(11) [46], 0.82(10) [31], 0.86(3) [47], 0.93(3) [48, 49], 0.9(1) [49,50], 1.4(4) [51]
Correlation Time (s)
0 2 4 6 8 10 12 14
Counts / 0.25 s
2 4 6 8 10 12 14 16
18 Data
Random Correlations Data Random Correlations Fit Total Fit
Y Decay
99
0 2 4 6 8 10 12 14 1
10
FIG. 1. (Color online) Decay curve for99Y. The selection of events in this decay curve is described in TableI. The inset shows the decay curve on a logarithmic scale.
B. 10140Zr61→10141Nb60
The half-life of 101Zr has been previously measured in fission-based experiments [34, 36–38]. Refs. [36, 38]
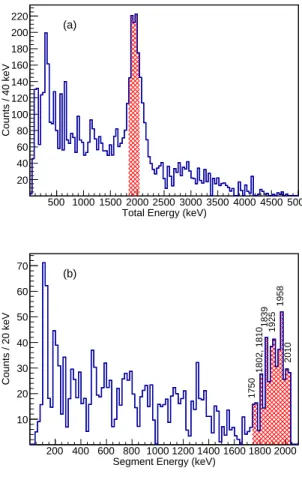
both reported a large β-decay feeding intensity to levels in101Nb around 2 MeV. These measurements have been compiled in the decay scheme from ENSDF [35], which shows a group of nearby levels around 2 MeV (specifi- cally, those levels between 1878.1 keV and 2030.65 keV, inclusive) that collectively have a relatively largeβ-decay feeding intensity. In the present work, the TAS spectrum contains a prominent sum peak around 2 MeV [see Fig.
2(a)]. Examining the sum-of-segments spectrum while gating on this sum peak shows the high-energy γ rays (between roughly 1.8 MeV and 2 MeV within the en- ergy resolution of SuN) that have a large probability to be emitted during the deexcitation of these levels that form the sum peak [see Fig. 2(b)]. Gating on the sum peak from these levels in the TAS spectrum andγrays in the sum-of-segments spectrum produced the decay curve shown in Fig. 3 and resulted in a half-life of 2.27±0.12 s, in good agreement with previous measurements.
C. 10240Zr62→10241Nb61
The half-life of102Zr has been previously measured in fission-based experiments [38, 39]. One of those experi- ments only indirectly measured the half-life of102Zr by following the growth and decay of the daughter 102Nb [39]. A decay curve from the present work is shown in Fig. 4 and the half-life from the present work is 2.01 ± 0.08 s, in good agreement with one of the two previous measurements.
D. 102m41 Nb61→10242Mo60
The half-life of 102mNb has been previously measured in fission-based experiments [39]. For the decay of102Zr in the present work, there is an intense sum peak in the TAS spectrum at approximately 296 keV and a very in- tense peak with the same energy in the sum-of-segments spectrum. However, the decay schemes for the parent
102Zr [52] and the charge-state contaminant99Zr39+ [33]
Total Energy (keV)
500 1000 1500 2000 2500 3000 3500 4000 4500 5000
Counts / 40 keV
20 40 60 80 100 120 140 160 180 200
220 (a)
Segment Energy (keV)
200 400 600 800 1000 1200 1400 1600 1800 2000
Counts / 20 keV
10 20 30 40 50 60
70 (b)
1750 1802, 18101839 1925 1958 2010
FIG. 2. (Color online) β-delayed γ-ray spectra for decay events correlated to 101Zr implantations with a correlation time window of one second. The backward-time correlations (random background) have been subtracted from the forward- time correlations. The top panel, labeled (a), shows the TAS spectrum, and the red, cross hatches indicate the selection of events used to examine the individual γ rays in the sum-of- segments spectrum in the bottom panel. The bottom panel, labeled (b), shows the sum-of-segments spectrum only for cer- tain events in the TAS spectrum as indicated in the top panel.
Individual γ rays identified within the energy resolution of SuN are labeled. In (b), the red, cross hatches indicate the selection of events used to create the decay curve for 101Zr, which is shown in Fig. 3.
do not list, around this energy, any levels that could be populated orγrays that could be emitted during their re- spectiveβ decays. Meanwhile, a decay scheme exists for the ground state but not the β-decaying isomeric state of the daughter 102Nb [52]. No evidence was found in the TAS spectrum for the decay of the ground state of the daughter, which agrees with Ref. [53] in terms of theβ decay of 102Zr populating levels in 102Nb that are built on top of theβ-decaying isomeric state. The origin of the peaks at approximately 296 keV in the TAS and sum-of-segments spectra was assigned to be from theβ- decaying isomeric state populating the first excited state in 102Mo at 296.61 keV. Gating on both this sum peak
Correlation Time (s)
0 2 4 6 8 10 12 14
Counts / 0.25 s
20 40 60 80 100 120 140 160 180 200
Data
Random Correlations Data Random Correlations Fit Total Fit
Zr Decay
101
0 2 4 6 8 10 12 14 1
10 102
FIG. 3. (Color online) Decay curve for101Zr. The selection of events in this decay curve is described in TableIand shown in Fig. 2. The inset shows the decay curve on a logarithmic scale.
Correlation Time (s)
0 2 4 6 8 10 12 14
Counts / 0.25 s
20 40 60 80 100
120 Data
Random Correlations Data Random Correlations Fit Total Fit
Zr Decay
102
0 2 4 6 8 10 12 14 1
10 102
FIG. 4. (Color online) Decay curve for102Zr. The selection of events in this decay curve is described in TableI. The inset shows the decay curve on a logarithmic scale.
in the TAS spectrum and γ ray in the sum-of-segments spectrum produced the decay curve in Fig. 5and resulted in a half-life of 1.33±0.27 s, in good agreement with the previous measurement. In fitting the decay curve with the Bateman equations that described the growth and decay of 102mNb, the half-life of102Zr as determined in Sec. IV Cwas held constant.
E. 10341Nb62→10342Mo61
The half-life of 103Nb has been previously measured in fission-based experiments [39–41]. The decay curve from the present work is shown in Fig. 6 and resulted in a half-life of 1.34 ± 0.07 s, in good agreement with previous measurements.
6
Correlation Time (s)
0 2 4 6 8 10 12 14
Counts / 0.25 s
20 40 60 80
100 Data
Random Correlations Data Random Correlations Fit Total Fit
Nb Decay
m 102
0 2 4 6 8 10 12 14 1
10 102
FIG. 5. (Color online) Decay curve for102mNb. The selection of events in this decay curve is described in TableI. The inset shows the decay curve on a logarithmic scale.
Correlation Time (s)
0 2 4 6 8 10 12 14
Counts / 0.25 s
50 100 150 200 250
300 Data
Random Correlations Data Random Correlations Fit Total Fit
Nb Decay
103
0 2 4 6 8 10 12 14 1
10 102
FIG. 6. (Color online) Decay curve for103Nb. The selection of events in this decay curve is described in TableI. The inset shows the decay curve on a logarithmic scale.
F. 104m41 Nb63→10442Mo62
The half-life of 104mNb has been previously measured in fission-based experiments [31, 39, 43, 45]. There are two β-decaying states in 104Nb [39, 45]: a longer- lived ground state and shorter-lived isomeric state. The shorter-lived isomeric state predominately emits γ rays with energies of 368.4 keV, 477.5 keV, 519.2 keV, 555.3 keV, and 771.4 keV [45]. Theseγ rays are visible in the sum-of-segments spectrum. The decay curves gated on each of these γ rays were fit individually and the ex- tracted half-lives were consistent with the half-life of the shorter-lived isomeric state [44]. Ref. [45] identified the 192.2 keVγray as originating from both the longer-lived ground state and shorter-lived isomeric state. A fit of the decay curve gated on only this γ ray produced a half-life consistent with the half-life of the shorter-lived
Correlation Time (s)
0 2 4 6 8 10 12 14
Counts / 0.25 s
10 20 30 40 50
Data
Random Correlations Data Random Correlations Fit Total Fit
Nb Decay
m 104
0 2 4 6 8 10 12 14 1
10 102
FIG. 7. (Color online) Decay curve for104mNb. The selection of events in this decay curve is described in TableI. The inset shows the decay curve on a logarithmic scale.
isomeric state. No component for the longer-lived ground state was necessary for the fit of the decay curve. Ref.
[45] identified a γ ray with an energy of 693.9 keV as originating from predominately the longer-lived ground state. In the present work, this γ ray has no signifi- cant peak in the sum-of-segments spectrum. With little evidence found for the longer-lived ground state in the decay curves and sum-of-segments spectrum, the conclu- sion was made that the fragmentation reaction in the experiment of the present work populated primarily the shorter-lived isomeric state, unlike all the previous ex- periments that produced both states of 104Nb through fission. A decay curve from the present work is shown in Fig. 7 and the half-life from the present work is 0.97 ± 0.10 s, in good agreement with previous measurements.
G. 10943Tc66→10944Ru65
The half-life of 109Tc has been previously measured in fission-based experiments [31, 47, 48, 50, 51] and fragmentation-based experiments [46]. The decay curve from the present work is shown in Fig. 8 and resulted in a half-life of 0.87 ± 0.07 s, in good agreement with previous measurements.
V. CONCLUSIONS
Using the capabilities of an implantation station in- side of a segmented total absorption spectrometer, the β-decay half-lives of neutron-rich nuclides in the A = 100- 110 mass region were measured. Accurate half-lives in this mass region are important for nuclear astrophysics, nuclear structure, and nuclear technology. Many of these nuclides had their half-life measured decades ago and were produced by the separation of fission products,
Correlation Time (s)
0 2 4 6 8 10 12 14
Counts / 0.25 s
20 40 60 80
100 Data
Random Correlations Data Random Correlations Fit Total Fit
Tc Decay
109
0 2 4 6 8 10 12 14 1
10 102
FIG. 8. (Color online) Decay curve for109Tc. The selection of events in this decay curve is described in TableI. The inset shows the decay curve on a logarithmic scale.
which may cause uncertainty to surround the origin ofγ rays that were gated on to produce decay curves. There is overall good agreement between the half-lives in the present work and the previous measurements, and the present work is in better agreement with one of the two disparate half-life values for102Zr.
There are multiple ways to improve the technique so that the half-life uncertainties are reduced in future ex- periments. One way to improve the technique is to reduce the background from random correlations. This could be achieved by lowering the beam rate during the ex- periment in order to increase the amount of time be- tween consecutive implantations for a given pixel in the DSSD. Unfortunately, this approach would also reduce
the statistics in the decay curves. Another way to im- prove the technique is in the future to measure the total kinetic energy of each ion implanted in the DSSD so that charge-state separation may be performed. With the po- tential background from possible charge-state contami- nants removed, deciding where to simultaneously gate on the TAS spectrum and sum-of-segments spectrum would likely be more straightforward.
Regarding the nuclides studied in the present work, many questions concerning nuclear structure and nuclear astrophysics can be found in Refs. [8, 9]. One question from these references is how well the experimentalB(GT) distribution will compare to the theoretical B(GT) dis- tributions for different deformations. This is an impor- tant and sensitive input when comparing to theoretical calculations used inr-process models, which goes beyond the simple half-life comparisons. However, extracting the B(GT) distribution experimentally requires an accurate value for the half-life. A comparison of the theoretical B(GT) distributions from those references with the ex- perimentalB(GT) distribution (using the half-lives from the present work) will be the subject of a forthcoming paper.
ACKNOWLEDGMENTS
A. A. acknowledges support from the Spanish Minis- terio de Econom´ıa y Competitividad under Grants No.
FPA2011-24553 and No. FPA2014-52823-C2-1-P. This work was supported by the National Science Foundation under Grants No. PHY 1565546 (NSCL), No. PHY 1430152 (JINA-CEE), and No. PHY 1350234 (CA- REER). This material is based upon work supported by the Department of Energy National Nuclear Security Ad- ministration through the Nuclear Science and Security Consortium under Award Number(s) DE-NA0003180 and/or DE-NA0000979.
[1] M. Arnould, S. Goriely, and K. Takahashi,Physics Re- ports450, 97 (2007).
[2] M. R. Mumpower, R. Surman, G. C. McLaughlin, and A. Aprahamian,Progress in Particle and Nuclear Physics 86, 86 (2016).
[3] D. A. Coulter, R. J. Foley, C. D. Kilpatrick, M. R. Drout, A. L. Piro, B. J. Shappee, M. R. Siebert, J. D. Simon, N. Ulloa, D. Kasen, B. F. Madore, A. Murguia-Berthier, Y.-C. Pan, J. X. Prochaska, E. Ramirez-Ruiz, A. Rest, and C. Rojas-Bravo,Science358, 1556 (2017).
[4] B. P. Abbott et al.(LIGO Scientific Collaboration and Virgo Collaboration), Phys. Rev. Lett. 119, 161101 (2017).
[5] B. D. Metzger,Living Reviews in Relativity20, 3 (2017).
[6] J. Barnes, D. Kasen, M.-R. Wu, and G. Mart´ınez- Pinedo,The Astrophysical Journal829, 110 (2016).
[7] E. N´acher, A. Algora, B. Rubio, J. L. Ta´ın, D. Cano- Ott, S. Courtin, P. Dessagne, F. Mar´echal, C. Mieh´e, E. Poirier, M. J. G. Borge, D. Escrig, A. Jungclaus, P. Sarriguren, O. Tengblad, W. Gelletly, L. M. Fraile,
and G. Le Scornet,Phys. Rev. Lett.92, 232501 (2004).
[8] P. Sarriguren and J. Pereira, Phys. Rev. C81, 064314 (2010).
[9] P. Sarriguren, A. Algora, and J. Pereira, Phys. Rev. C 89, 034311 (2014).
[10] A. L. Nichols, “Nuclear Data Requirements for Decay Heat Calculations,” Lectures given at the Workshop on Nuclear Reaction Data and Nuclear Reactors: Physics, Design and Safety, Trieste, Italy, 25 February - 28 March 2002.
[11] T. Yoshida and A. L. Nichols, Assessment of Fission Product Decay Data for Decay Heat Calculations: A Report by the Working Party on International Evalua- tion Co-operation of the Nuclear Energy Agency Nuclear Science Committee (Nuclear Energy Agency, Organiza- tion for Economic Co-operation and Development, Paris, 2007).
[12] A. Algora, D. Jordan, J. L. Ta´ın, B. Rubio, J. Agra- munt, A. B. Perez-Cerdan, F. Molina, L. Caballero, E. N´acher, A. Krasznahorkay, M. D. Hunyadi, J. Guly´as,
8 A. Vit´ez, M. Csatl´os, L. Csige, J. ¨Aysto, H. Pent-
til¨a, I. D. Moore, T. Eronen, A. Jokinen, A. Nieminen, J. Hakala, P. Karvonen, A. Kankainen, A. Saastamoinen, J. Rissanen, T. Kessler, C. Weber, J. Ronkainen, S. Ra- haman, V. Elomaa, S. Rinta-Antila, U. Hager, T. Son- oda, K. Burkard, W. H¨uller, L. Batist, W. Gelletly, A. L.
Nichols, T. Yoshida, A. A. Sonzogni, and K. Per¨aj¨arvi, Phys. Rev. Lett.105, 202501 (2010).
[13] D. J. Morrissey, B. M. Sherrill, M. Steiner, A. Stolz, and I. Wiedenhoever, Nuclear Instruments and Methods in Physics Research Section B: Beam Interactions with Ma- terials and Atoms 204, 90 (2003), 14th International Conference on Electromagnetic Isotope Separators and Techniques Related to their Applications.
[14] C. J. Prokop, S. N. Liddick, B. L. Abromeit, A. T.
Chemey, N. R. Larson, S. Suchyta, and J. R. Tompkins, Nuclear Instruments and Methods in Physics Research Section A: Accelerators, Spectrometers, Detectors and Associated Equipment741, 163 (2014).
[15] J. I. Prisciandaro, A. C. Morton, and P. F. Mantica, Nuclear Instruments and Methods in Physics Research Section A: Accelerators, Spectrometers, Detectors and Associated Equipment 505, 140 (2003), proceedings of the tenth Symposium on Radiation Measurements and Applications.
[16] “Micron Semiconductor Ltd.” available online athttp:
//www.micronsemiconductor.co.uk/.
[17] A. Simon, S. J. Quinn, A. Spyrou, A. Battaglia, I. Beskin, A. Best, B. Bucher, M. Couder, P. A. DeYoung, X. Fang, J. G¨orres, A. Kontos, Q. Li, S. N. Liddick, A. Long, S. Lyons, K. Padmanabhan, J. Peace, A. Roberts, D. Robertson, K. Smith, M. K. Smith, E. Stech, B. Ste- fanek, W. P. Tan, X. D. Tang, and M. Wiescher,Nuclear Instruments and Methods in Physics Research Section A:
Accelerators, Spectrometers, Detectors and Associated Equipment703, 16 (2013).
[18] C. L. Duke, P. G. Hansen, O. B. Nielsen, and G. Rud- stam,Nuclear Physics A151, 609 (1970).
[19] A. C. Dombos, D.-L. Fang, A. Spyrou, S. J. Quinn, A. Si- mon, B. A. Brown, K. Cooper, A. E. Gehring, S. N. Lid- dick, D. J. Morrissey, F. Naqvi, C. S. Sumithrarachchi, and R. G. T. Zegers,Phys. Rev. C93, 064317 (2016).
[20] A. Spyrou, S. N. Liddick, F. Naqvi, B. P. Crider, A. C.
Dombos, D. L. Bleuel, B. A. Brown, A. Couture, L. Cre- spo Campo, M. Guttormsen, A. C. Larsen, R. Lewis, P. M¨oller, S. Mosby, M. R. Mumpower, G. Perdikakis, C. J. Prokop, T. Renstrøm, S. Siem, S. J. Quinn, and S. Valenta,Phys. Rev. Lett.117, 142701 (2016).
[21] S. N. Liddick, A. Spyrou, B. P. Crider, F. Naqvi, A. C. Larsen, M. Guttormsen, M. Mumpower, R. Sur- man, G. Perdikakis, D. L. Bleuel, A. Couture, L. Cre- spo Campo, A. C. Dombos, R. Lewis, S. Mosby, S. Nikas, C. J. Prokop, T. Renstrøm, B. Rubio, S. Siem, and S. J.
Quinn, Phys. Rev. Lett.116, 242502 (2016).
[22] A. Spyrou, A. C. Larsen, S. N. Liddick, F. Naqvi, B. P.
Crider, A. C. Dombos, M. Guttormsen, D. L. Bleuel, A. Couture, L. Crespo Campo, R. Lewis, S. Mosby, M. R. Mumpower, G. Perdikakis, C. J. Prokop, S. J.
Quinn, T. Renstrøm, S. Siem, and R. Surman,Journal of Physics G: Nuclear and Particle Physics 44, 044002 (2017).
[23] T. Kurtukian-Nieto, J. Benlliure, and K.-H. Schmidt, Nuclear Instruments and Methods in Physics Research Section A: Accelerators, Spectrometers, Detectors and
Associated Equipment589, 472 (2008).
[24] Meng Wang, G. Audi, F. G. Kondev, W. J. Huang, S. Naimi, and Xing Xu,Chinese Physics C 41, 030003 (2017).
[25] H. Bateman, Proceedings of the Cambridge Philosophical Society15, 423 (1910).
[26] M. Quinn, A. Aprahamian, J. Pereira, R. Surman, O. Arndt, T. Baumann, A. Becerril, T. Elliot, A. Estrade, D. Galaviz, T. Ginter, M. Hausmann, S. Hennrich, R. Kessler, K.-L. Kratz, G. Lorusso, P. F. Mantica, M. Matos, F. Montes, B. Pfeiffer, M. Portillo, H. Schatz, F. Schertz, L. Schnorrenberger, E. Smith, A. Stolz, W. B.
Walters, and A. W¨ohr,Phys. Rev. C85, 035807 (2012).
[27] G. Rudstam, K. Aleklett, and L. Sihver,Atomic Data and Nuclear Data Tables53, 1 (1993).
[28] P. L. Reeder and R. A. Warner,Phys. Rev. C 28, 1740 (1983).
[29] H. A. Seliˇc, G. Sadler, T. A. Khan, W.-D. Lauppe, H. Lawin, K. Sistemich, E. Monnand, J. Blachot, J. P.
Bocquet, and F. Schussler, Zeitschrift f¨ur Physik A Atoms and Nuclei289, 197 (1979).
[30] M. Asghar, J. P. Gautheron, G. Bailleul, J. P. Bocquet, J. Greif, H. Schrader, G. Siegert, C. Ristori, J. Crancon, and G. I. Crawford,Nuclear Physics A247, 359 (1975).
[31] T. Mehren, B. Pfeiffer, S. Schoedder, K.-L. Kratz, M. Huhta, P. Dendooven, A. Honkanen, G. Lhersonneau, M. Oinonen, J.-M. Parmonen, H. Penttil¨a, A. Popov, V. Rubchenya, and J. ¨Ayst¨o,Phys. Rev. Lett.77, 458 (1996).
[32] H.-D. Sch¨ussler and G. Herrmann,Radiochim. Acta18, 123 (1972).
[33] E. Browne and J. K. Tuli,Nuclear Data Sheets145, 25 (2017).
[34] N. Trautmann, N. Kaffrell, H. W. Behlich, H. Folger, G. Herrmann, D. H¨ubscher, and H. Ahrens,Radiochim.
Acta18, 86 (1972).
[35] J. Blachot,Nuclear Data Sheets83, 1 (1998).
[36] H. Ohm, M. Liang, U. Paffrath, B. De Sutter, K. Sis- temich, A. -M. Schmitt, N. Kaffrell, N. Trautmann, T. Seo, K. Shizuma, G. Moln´ar, K. Kawade, and R. A.
Meyer,Zeitschrift f¨ur Physik A Hadrons and Nuclei340, 5 (1991).
[37] J. Eidens, E. Roeckl, and P. Armbruster, Nuclear Physics A141, 289 (1970).
[38] M. Graefenstedt, U. Keyser, F. M¨unnich, F. Schreiber, H. R. Faust, and H. Weikard, Zeitschrift f¨ur Physik A Atomic Nuclei327, 383 (1987).
[39] H. Ahrens, N. Kaffrell, N. Trautmann, and G. Her- rmann,Phys. Rev. C14, 211 (1976).
[40] K. Shizuma, H. Ahrens, J. P. Bocquet, N. Kaffrell, B. D.
Kern, H. Lawin, R. A. Meyer, K. Sistemich, G. Tittel, and N. Trautmann, Zeitschrift f¨ur Physik A Atoms and Nuclei315, 65 (1984).
[41] U. Paffrath, H.-J. Wadenpohl, H. Ohm, and K. Sis- temich, The Level Scheme of10341Nb62, Tech. Rep. JUL- Spez-442, p. 28 (1988).
[42] D. De Frenne,Nuclear Data Sheets110, 2081 (2009).
[43] G. Battistuzzi, K. Kawade, B. D. Kern, T. A. Khan, W. D. Lauppe, H. Lawin, H. A. Seliˇc, K. Sistemich, and A. Wolf, Studies at the Fission Product Separator JOSEF, Tech. Rep. NEANDC(E)-212U, Vol V, p. 35 (1980).
[44] J. Blachot,Nuclear Data Sheets108, 2035 (2007).
[45] B. D. Kern, K. Sistemich, W.-D. Lauppe, and H. Lawin,
Zeitschrift f¨ur Physik A Atoms and Nuclei 306, 161 (1982).
[46] J. Pereira, S. Hennrich, A. Aprahamian, O. Arndt, A. Be- cerril, T. Elliot, A. Estrade, D. Galaviz, R. Kessler, K.-L.
Kratz, G. Lorusso, P. F. Mantica, M. Matos, P. M¨oller, F. Montes, B. Pfeiffer, H. Schatz, F. Schertz, L. Schnor- renberger, E. Smith, A. Stolz, M. Quinn, W. B. Walters, and A. W¨ohr,Phys. Rev. C79, 035806 (2009).
[47] H. Penttil¨a,Studies of Very Neutron-Rich Odd-Mass Nu- clei with 109 ≤ A ≤ 119, Ph.D. thesis, University of Jyv¨askyl¨a (1992).
[48] J. B. Wilhelmy, High-Resolution Gamma and X-Ray Spectroscopy on Unseparated Fission Products, Ph.D.
thesis, University of California, Berkeley (1969).
[49] S. Kumar, J. Chen, and F. G. Kondev, Nuclear Data Sheets137, 1 (2016).
[50] T. Altzitzoglou, J. Rogowski, M. Sk˚alberg, J. Alstad, G. Herrmann, N. Kaffrell, G. Skarnemark, W. Talbert, and N. Trautmann,Radiochim. Acta51, 145 (1990).
[51] N. Trautmann, N. Kaffrell, H. Ahrens, and P. F. Dittner, Phys. Rev. C13, 872 (1976).
[52] D. De Frenne,Nuclear Data Sheets110, 1745 (2009).
[53] S. Rinta-Antila, T. Eronen, V.-V. Elomaa, U. Hager, J. Hakala, A. Jokinen, P. Karvonen, H. Penttil¨a, J. Ris- sanen, T. Sonoda, A. Saastamoinen, and J. ¨Ayst¨o,The European Physical Journal A31, 1 (2007).