Frequent pattern mining in
multidimensional organizational networks
László Gadár 1,2 & János Abonyi 3
Network analysis can be applied to understand organizations based on patterns of communication, knowledge flows, trust, and the proximity of employees. A multidimensional organizational network was designed, and association rule mining of the edge labels applied to reveal how relationships, motivations, and perceptions determine each other in different scopes of activities and types of organizations. Frequent itemset-based similarity analysis of the nodes provides the opportunity to characterize typical roles in organizations and clusters of co-workers. A survey was designed to define 15 layers of the organizational network and demonstrate the applicability of the method in three companies. The novelty of our approach resides in the evaluation of people in organizations as frequent multidimensional patterns of multilayer networks. The results illustrate that the overlapping edges of the proposed multilayer network can be used to highlight the motivation and managerial capabilities of the leaders and to find similarly perceived key persons.
In the early 1980’s Tichy suggested that organizational research should incorporate a network perspective1,2. In the 1990’s six themes (turnover and absenteeism, power, work attitudes, job design, leadership, motivation) dominated the research of micro-organizational behavior3. Researchers have highlighted that centrality in advice networks may differ from that of friendship networks. Advice network centrality is a better indicator of the “real”
hierarchy4, because individuals may seek out advice from others who they would not consider leaders, and may perceive leaders whom they would not necessarily consider going to for advice5. Social influence derived from friendship networks has stronger effects on job-satisfaction6 because social network relationships are likely to affect the performance and receipt of organizational citizenship behavior (OCBs), which includes attitudes like job satisfaction. The spread of OCBs in organizations may be facilitated or hindered by social relationships7.
Social Network Analysis (SNA) is widely used to support these studies. As the attitude of the members of social networks attitudes might influence each other, predicting their behavior requires an advanced model of the con- nections8. The analysis of network reciprocity can also provide useful information about cooperation-promoting mechanisms9. The modeling forming connections is crucially important when we would like to understand how social networks evolve10. Recently it has been proven that combining the methods in game theory, agent-based modeling, machine learning, and computational sociology is a useful approach to understand the mechanisms of network formation11.
In organizational networks, the nodes are co-workers and ties are defined based on the researchers are focus- ing on. Edges can be defined based on communication12, advice13, friendship14 relationships, or all of these15. For getting a better understanding of what factors affect the formation of communication networks, connection types defined by the theory of structuration16 were shown to be useful17.
The importance of the multilayer nature of intra-organizational networks was realized more than thirty years ago18,19. The informal structure of an organization is complex and multilayered as people are involved in multiple, dynamic and overlapping webs of relationships4. In the early studies Multi-Theoretical Multi-Level models20,21 and multilayer networks22–24 were used to provide a deeper insight into organizations. The theory of multilayer networks25,26 is a rapidly growing field in network science. Nowadays multilayer networks are widely used in SNA27–31. Multiplex networks are a special case of multilayer networks where nodes are the same everywhere, and different edges lie on different layers32. In these models, the nodes can be characterized by their activities on different layers, which provides a better understanding of their roles33–35.
1innopod Solutions Kft, Budapest, Hungary. 2MTA-PE Budapest Ranking Research Group (BRRG), University of
Pannonia, Veszprém, Hungary. 3MTA-PE Complex Systems Monitoring Research Group, University of Pannonia, Veszprém, Hungary. Correspondence and requests for materials should be addressed to L.G. (email: laszlo@gadar.hu) Received: 8 June 2018
Accepted: 28 January 2019 Published: xx xx xxxx
opeN
As can be seen, organizational networks have been considered to be multilayer networks since the early 1990s, but no method could handle the multidimensional aspect of the problem. Finding informative correlations between layers of multilayer networks is still considered as one of the primary goals of network science26.
The research aims to develop a methodology for the complex assessment of organizations that handles the multidimensional nature of the relationships.
The contributions of this work are the following:
• Based on our organizational development experience, requirements of our business partners, and the liter- ature of organizational network analysis we defined a multilayer organization network with 15 layers repre- senting interaction-, rating-/perception-, and friendship-type connections.
• The key idea behind the development of this model is that the connection types of the proposed multidimen- sional organizational network can be analyzed by association rule mining algorithm to reveal how relationships, motivations, and perceptions as layers of an organization influence each other in different scopes of activities.
• The novelty of our approach resides in the evaluation of people in organizations as frequent multidimensional patterns of incoming/outgoing multidimensional edges.
• We demonstrate that the overlapping edges of the proposed multilayer network can be used to highlight the motivation and managerial capabilities of the leaders and to find similarly perceived key persons.
The paper is organized as follows. In the first part of the Methods section, the multidimensional organizational network model is introduced. The second part of this section presents how frequent pattern mining can be used to extract information from multidimensional networks. It is believed that the proposed approach can be widely applied to find significant correlations between layers of multilayer networks. The Results and Discussion section demonstrates how the proposed approach can be used in the development of three organizations.
Methods
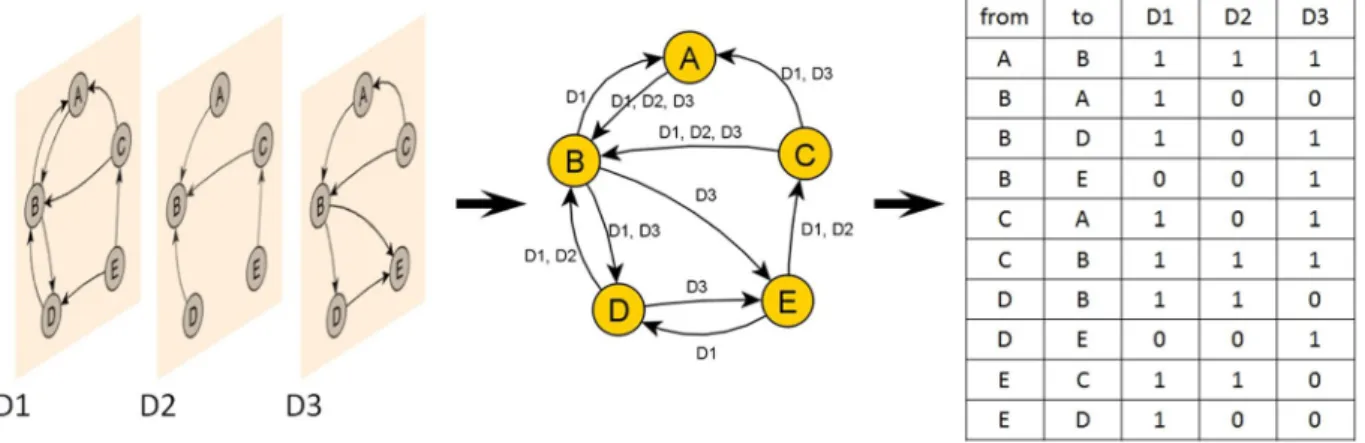
Multidimensional representation of organizational networks. In the proposed multidimensional organizational network the nodes represent the employees and labeled edges reflect how the members of the organization communicate, work together, rate and motivate each other, and their personal relationships. Labeled and directed connections define multiple edges form a multidimensional network =( , , ), where V repre-V E D sents the node set, D the set of edge labels defines the dimensions of edges, and E denotes the edge set, E={( , , ); ,u v d u v V d D∈ , ∈ } as can be seen in Fig. 1. As each label can be mapped into an independent net- work, the model can be interpreted as a multilayer network. A multilayer network is a pair M=( , )G C, where
G M
{ ;α {1, , }}
= α ∈ …
is a family of graphs Gα = (Xα, Eα) (called layers of ) and
E X X M
{ ; ,α β {1, , },α β}
= αβ⊆ α× β ∈ … ≠
is the edge set between nodes of different layers Gα and Gβ
with α ≠ β26. Eα are called intralayers and Eαβ(α ≠ β) are referred to as interlayer-connections.
The studied intra-organizational networks can be considered to be directed multiplex networks which are a special type of multilayer networks. Multiplex networks consist of a fixed set of nodes connected by different types of links. In our case the G = (V, E, D) multidimensional network is associated with a multiplex network with layers { ,G1 …,G| |D} where α ∈ D, Gα = (Xα, Eα), Xα= V, Eα= {(u, v) ∈ V × V;(u, v, d) ∈ E andd = α}.
Based on our organizational development experience, requirements of our business partners, and the litera- ture of organizational network analysis connection-/interaction-, rating-/perception-, and friendship-type layers were defined in our model:
1. Connection-type layers L1: get advice from L2: get priorities from L3: get feedback from L4: communication with L5: working together with
Figure 1. Representations of a multidimensional network.
2. Rating-type layers
L6: he/she helps to find information
L7: he/she provides the best working relationship L8: he/she has great professional knowledge L9: he/she motivates me
L10: he/she is capable of solving complex tasks L11: he/she is capable of managing colleagues L12: he/she is a key person in the organization 3. Friendship-network layers
L13: he/she gets along easily with me L14: I would like to have dinner with him/her
L15: I would like to work together with him/her as a part of a problem-solving team
An online survey was designed to identify the connections. In the survey, there were as many questions as layers. Respondents were asked to mark the names of co-workers that fit the question and were not restricted to a fixed number of answers to minimize measurement error36.
The combination of layers is believed to capture the essence of an organization, making it possible to extract information about working connections, trust, employee’s perceptions of each other, and leadership.
Frequent pattern mining of edge labels in multidimensional networks. Discovering statistically significant correlations between layers of multilayer networks is one of the major goals of network science over the next years26. A recently developed edge-overlap measure evaluates the conditional probability of finding a directed link on a layer given the presence of a directed link between the same nodes on another layer34,37 which can handle with pairs of dimension. The method is feasible for examining the overlap of a small number of dimensions. As the coexistence of links with different labels between any nodes i and j forms frequent patterns of any number of dimensions, it was found that frequent pattern mining provides a new opportunity to describe correlations between layers.
Frequent itemset mining was initially developed for market basket analysis, and it is used nowadays for almost any task that requires the discovery of regularities between (nominal) variables38. This concept has been extended to frequent graph-based substructure pattern mining39.
Our work differs from methods developed for frequent subgraph mining in unilayered (labeled) networks40. Labeling network motifs in protein-protein interaction (PPI) networks41 and text networks42 is also a similar problem. While in these tasks the labels are attached to the nodes, in our case the problem requires the identifica- tion and characterization of the frequent multidimensional edges.
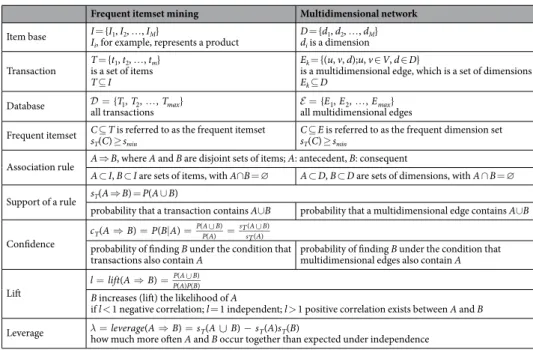
As this is the first attempt to introduce frequent itemset mining into the analysis of multidimensional net- works, the technique is summarized in Table 1. The dimensions D = {d1, d2, …, dM} of the network are considered to be a set of items I = {I1, I2, …, IM} (in market basket analysis, Ii represents a given product). The set of transac- tions of the items T = {t1, t2, …, tm} are defined as a set such that ti⊆I is identical to a given edge Ei={( , , ); ,u v d u v V d Di j ∈ , ∈ } in a multigraph between nodes ui and vj. Our aim is to identify frequently occurring subsets of edge dimensions and mine valuable information concerning multidimensional networks based on the analysis of these itemsets. The occurrence of an itemset C is measured as number of transactions (multidimensional edges) that the itemset contains. When this frequency is divided by the size of the transaction set | | which is identical to the number of edges |E|, the calculated support of sT(C) represents the probability of multidimensional edge C. The C⊆T is referred to as frequent when sT(C) ≥ smin exceeds a user-specified mini- mum smin. The goal of frequent itemset mining is to find all frequent itemsets C ⊆ I in database 38.
The resultant frequent itemsets can be used to form A⇒B association rules where A and B are disjoint subsets of C, as A ⊂ C, B ⊂ C and A ∩ B = ∅43. The confidence of the rule represents the P(B|A) conditional probability:
∪ ∪ ∪
⇒ = | = = =
c A B P B A P A B P A
s A B s A
A B
( ) ( ) ( ) A
( )
( )
( )
count( )
count( ) (1)
T T
T
when A is independent of B, P(A ∪ B) =P(A)P(B). The lift l is a correlation measure that is based on the ratio of these probabilities:
∪ ∪
= ⇒ = =
l lift A B P A B P A P B
s A B s A s B
( ) ( )
( ) ( )
( )
( ) ( ) (2)
T
T T
when l < 1 A is negatively correlated with B, meaning that the occurrence of A leads to the absence of B. When l > 1, then A and B are positively correlated, meaning that the occurrence of A implies the occurrence of B44. Rules with high level of lift usually exhibit relatively low degree of support45. An alternative to lift is leverage that states how much more often A and B occur together than as independent random variables46.
∪
λ =leverage A( ⇒B)=s AT( B)−s A s BT( ) ( )T (3) The computational complexity of the proposed methodology is determined by the utilized frequent itemset mining algorithm. The complexity of the most widespread Apriori algorithm is (M m2 )47, where M represents the number of items and m the number of data records, thus finding the frequent connection types has quadratic dependence on the M connection types and linear scalability in the m= | |Ek number of connection. As M = 15,
it can be concluded that the calculation of the proposed measures can be computed very quickly even for large networks.
In this section, an analogy between the measures of network science and frequent pattern mining was pre- sented. In the following section, how frequent itemsets and association rule mining can be used to understand the formation of connections is demonstrated.
Node characterization based on incoming multidimensional edges. In (organizational) network research, three levels (dyadic, actors/nodes, networks) of the analysis can be distinguished48. At the dyadic level the frequent occurrence of the edge dimensions can be analyzed. Analysis at the level of the actors requires infor- mation to be aggregated with regard to the types of edges to characterize the nodes. For example, to measure the degree of innovation and problem-solving abilities of the employees, the centrality of the actors in the communi- cation network of the organization can be studied49. The selection of suitable dimensions plays an important role in these ratings, e.g. as information exchange is reflected in the advice network, the perception of information access is mostly determined by the advice centrality4. In multilayer networks, nodes can be characterized based on their activities at different layers26. The distribution of degrees of nodes among layers can be described by its entropy of the multiplex degree which is similar to the multiplex participation coefficient published in ref.34.
In the following a novel method for the characterization of nodes is introduced by calculating the frequent patterns of the incoming/outgoing multidimensional edges of ego-networks. The directed edge set
uout={ , ,E E1 2 …,Emax}, Ek={(uout,v d u v V d Din, ); , ∈ , ∈ } consist of outgoing edges of a node u ∈ V; and
={ , ,E E …,E }
uin 1 2 max
, El={(vout,u d u v V d Din, ); , ∈ , ∈ } represents the incoming edges of a node u ∈ V.
Frequent dimensions of outgoing and incoming edges are specific to the nodes. The outgoing edges are related to the perceptions, ratings and connections to others, while the incoming patterns reflect how the actor is rated.
Association rules A ⇒ B valid for uout, uin or u=uout∪uin provide the specifications of the node.
As a node can support or weaken association rules with its incoming/outgoing multidimensional edges, the measures of the association rules can be utilized as fingerprints of the organizational network. The similar- ity between the nodes can be evaluated based on the incoming and outgoing patterns. Based on clustering of the nodes, similar key persons and leaders can also be identified which approach is similar to frequent pattern mining-based community detection50.
As modularity is based on the difference between the actual and expected number of edges51, the analysis of this difference can reflect attractiveness and talent in individual and organizational levels. Community detection algorithms explore densely linked groups of nodes, so these algorithms can highlight central nodes52, leaders of communities53 and hierarchical structure54,55.
The following section demonstrates that based on the similarities of the multidimensional incoming and out- going connections the clusters of co-workers can be determined and use extracted knowledge can be used to characterize typical roles in the organizations.
Results and Discussions
To demonstrate the applicability of the proposed methodology, leaders and key persons are identified based on the incoming edges and the determination of the effects with regard to the advice network based on frequent patterns containing the advice (L1) dimension are sought.
Frequent itemset mining Multidimensional network Item base I = {I1, I2, …, IM}
Ii, for example, represents a product D = {d1, d2, …, dM} di is a dimension Transaction T = {t1, t2, …, tm}
is a set of items T ⊆ I
Ek = {(u, v, d);u, v ∈ V, d ∈ D}
is a multidimensional edge, which is a set of dimensions Ek ⊆ D
Database ={ , ,T T1 2…,Tmax}
all transactions ={ , ,E E1 2…,Emax} all multidimensional edges Frequent itemset C ⊆ T is referred to as the frequent itemset
sT(C) ≥ smin
C ⊆ E is referred to as the frequent dimension set sT(C) ≥ smin
Association rule A ⇒ B, where A and B are disjoint sets of items; A: antecedent, B: consequent
A ⊂ I, B ⊂ I are sets of items, with A∩B = ∅ A ⊂ D, B ⊂ D are sets of dimensions, with A ∩ B = ∅ Support of a rule sT(A ⇒ B) = P(A ∪ B)
probability that a transaction contains A∪B probability that a multidimensional edge contains A∪B
Confidence c AT( ⇒B)=P B A(| )=P A B(P A( )∪)=sT A BsT A(( )∪) probability of finding B under the condition that
transactions also contain A probability of finding B under the condition that multidimensional edges also contain A Lift l=lift A( ⇒B)=P A BP A P B(( ) ( )∪)
B increases (lift) the likelihood of A
if l < 1 negative correlation; l = 1 independent; l > 1 positive correlation exists between A and B Leverage λ =leverage A( ⇒B)=s AT( ∪B)−s A s BT( ) ( )T
how much more often A and B occur together than expected under independence
Table 1. Corresponding nomenclature of frequent itemset mining and multidimensional networks.
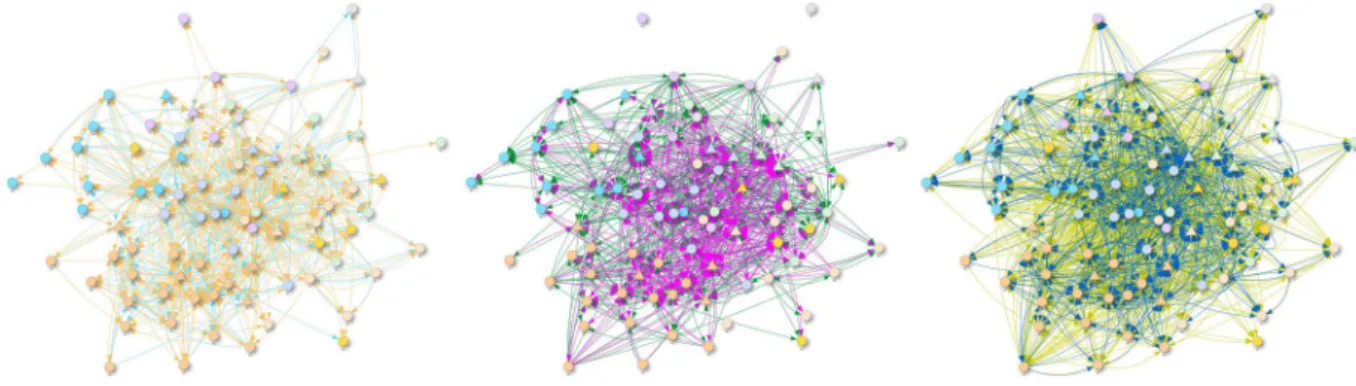
The studied organizational networks. 83 (response rate (RR): 75%), 57 (RR: 93%) and 203 (RR: 94%) employees from A: a not-for-profit arts organization, B: a multinational manufacturing company, and C: a cul- tural institute, respectively were studied. The complexity of Company A is illustrated in Fig. 2. The number of nodes and edges with their support is shown in Table 2. The high support of L13 in Company A indicates a friendly atmosphere. The reciprocity in the L13 layer is 43–44% for all companies, which correlates well with other studies4.
The number of two or more dimensional edges is shown in Table 3 which indicates that the majority of edges are multidimensional, only 26–33% of the edges are one-dimensional. The dimensions L4, L8 and L13 (55% of the one-dimensional in Company A), as well as the L14 and L15 tend to appear alone.
Analysis of the extracted association rules. Finding meaningful association rules is one of the biggest challenges in data mining. Filtering the rules based on confidence and support is an obvious approach, but in Figure 2. Six layers of the organizational network of Company A (left: light blue is L1, orange is L4; middle:
dark green is L8, magenta is L12; right: dark yellow is L13, dark blue is L15. The nodes are colored according to the departments they belong to. The shape of nodes corresponds to the positions as triangles represent leaders and circles stand for the employees).
Company A Company B Company C
Number of nodes 83 57 203
Number of
multidimensional edges 1709 925 5766
P(L1) 0.200 0.310 0.280
P(L2) 0.063 0.163 0.132
P(L3) 0.199 0.166 0.187
P(L4) 0.304 0.403 0.362
P(L5) 0.274 0.356 0.349
P(L6) 0.253 0.308 0.284
P(L7) 0.415 0.345 0.341
P(L8) 0.315 0.384 0.349
P(L9) 0.103 0.171 0.146
P(L10) 0.150 0.225 0.215
P(L11) 0.088 0.251 0.162
P(L12) 0.221 0.329 0.268
P(L13) 0.714 0.484 0.363
P(L14) — 0.428 0.339
P(L15) 0.301 0.471 0.323
Table 2. Support values of the edge labels in the studied organizations.
1 2 3 4 5 6 7 8 9 10 11 12 13 14 15
Company A 0.325 0.189 0.124 0.078 0.060 0.056 0.044 0.035 0.021 0.013 0.020 0.015 0.007 0.012 -
Company B 0.261 0.146 0.114 0.085 0.063 0.057 0.038 0.041 0.038 0.029 0.028 0.023 0.025 0.023 0.030
Company C 0.290 0.179 0.119 0.099 0.063 0.057 0.041 0.035 0.027 0.025 0.024 0.016 0.014 0.013 0.015
Table 3. Proportion of the number of dimensions in multi-edges.
some cases, the grouping of the rules based on variables is necessary56, e.g., the setting of a high-threshold support would exclude rare dimensions from the rules (like L2 and L9).
A positive correlation is indicated between the antecedent and consequent sets of all rules with a lift greater than one. Only two rules exist in Company A that possess negative leverages. The L8 ⇒ L13 rule can be found on 370 edges that is less than 380 edges expected under independent conditions, which indicates on average that it is hard to get along well with people who possess a high degree of professional knowledge.
The extracted rules as grouped matrices45 are summarized in Fig. 3, where the antecedents that are statistically dependent on the same consequents are grouped and shown in columns with their two most frequent dimensions written on the axes. Consequents are arranged in the rows. The bubbles are colored according to the median lift Figure 3. Summary of rules (size is proportional to support, color is proportional to lift).
of the rules in the groups, while the sizes of the bubbles represent the medians of the supports. The resultant plots highlight that important consequents are very similar in all companies, namely L2, L9, L11, L3, L10 and L1 which refer to leadership, motivation, managerial capability, giving feedback, solving complex tasks and giving advice respectively.
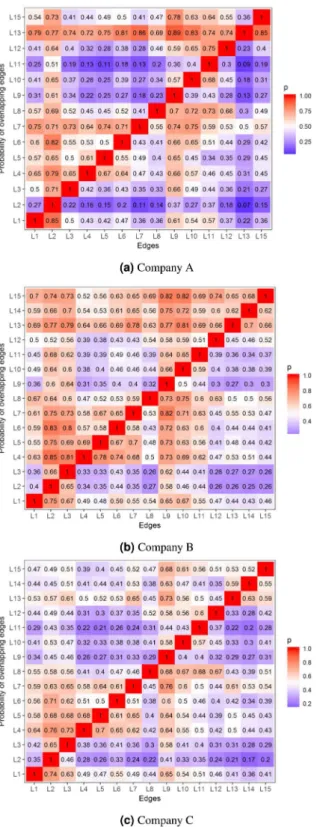
The confidence values of the rules can serve as layer-overlap measures. In Fig. 4 the columns are antecedents and the rows are consequents of rules Column ⇒ Row, furthermore, the values of the matrix show the confidences of the rules. As expected, layers L2 and L9 exhibit a strong correlation between almost all other layers, while it seems that the precedences of the edges L9, L10 and L11 increase the probabilities of connection types L7, L8 and L12.
Figure 4. The probability of dimensions in rows given the dimensions in the columns in the case of all three companies.
Characterization of the leaders. The appearance of dimension L2 in a multidimensional edge shows who is considered to be a leader in an organization because he/she provides instruction in a workflow. The confidences of the leader-related rules are shown in the second columns of the matrices in Fig. 4. The c(L2 ⇒ L9) = P(L9|L2) confidence of the L2 ⇒ L9 rule is a good measure of how a co-worker perceives the motivation of his/her leader.
The two-dimensional evaluation of actors is represented in Fig. 5. The x-axis is the in-degree on the “priorities from” (L2) layer, and the y-axis shows the conditional probability of the presence of “motivates me” (L9) dimen- sion along the same L2 edge. The in-degree centrality does not correlate with the motivating capability (Pearson’s ρ between the in-degrees and the motivating capability of the nodes is 0.38 at Company A; −0.09 at Company Figure 5. Motivating leaders. For the sake of interpretability of the figures, a small amount of random variation is added to the location of each point to avoid overlapping and persons with more than four in-degree are plotted at Company C.
B; and 0.21 at Company C), so the two dimensions provide additional information about actors. However, high and low social capital correlate with the in-degree centrality which reflects the eigenvector centrality captures the importance of the actors57. Eigenvector centralities of actors on the L2 layer are also well correlated with in-degrees (Pearson’s ρ between the in-degree and the eigenvector centrality of the nodes is 0.71 at Company A;
0.68 at Company B; and 0.67 at Company C). The differences in the eigenvector centrality among actors with the same in-degree can be studied in Fig. 5. The leader numbered as ‘45’ in Company A has much higher eigenvector centrality than leader numbered as ‘68’, but they have the same motivating capability that indicates that leader ‘45’
motivates more important people than leader ‘68’ which increases his/her overall importance.
The fact that there is no correlation between the numbers of motivation type connections and eigenvector centrality (Company A: 0.11; Company B: −0.06; Company C:0.17) shows that the capability of motivating may a personal trait. The plots can be utilized to evaluate the performance of the leaders and support decisions related to organizational development.
Clustering-based identification of the key persons. Finding influential employees in organizations should differ from the analysis of formal organizational charts. Research questions like “who is considered to be a key person?” require detailed analysis. A clustering-based algorithm to answer such questions was developed.
Similarly evaluated people can be clustered based on how similarly their incoming edges support the association rules. The Partitioning Around Medoids (PAM) algorithm58 was applied to identify the clusters (see Fig. 6) as it lends itself to clustering based on the specified distance matrix59, it has the robustness to noise60 and performs better for large datasets than the also popular k-means algorithm61.
Clusters 1 and 2 include the top managers of Company A. People in Clusters 3 and 4 are evaluated as key per- sons to the same extent. Members of Cluster 3 advise more co-workers, while members of Cluster 4 are evaluated as possessing greater professional knowledge. 38% of Cluster 3 are middle managers. There is no leader in Cluster 4, which suggests that members select advisors based on their status13.
Figure 6. Clusters of key persons in Company A visualized by principal component analysis. The numbers at the axes labels show the percentage of the variance represented by the principal component.
Company A Company B Company C
L2 4.25 2.43 2.63
L3 2.51 2.16 2.25
L4 2.14 1.56 1.76
L5 2.08 1.55 1.67
L6 2.36 1.91 1.96
L7 1.82 1.78 1.74
L8 1.80 1.73 1.57
L9 3.04 2.10 2.34
L10 2.72 2.17 1.93
L11 2.83 1.78 1.81
L12 1.84 1.52 1.62
L13 1.11 1.42 1.47
L14 — 1.38 1.29
L15 1.80 1.48 1.46
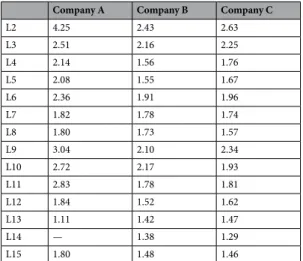
Table 4. Lift(L1⇒B) values at the studied companies.
Effects of the advice network. According to the literature, at least two kinds of processes drive how sources of advice are selected: namely status recognition and homophily13. The extraction of valuable information concerning these effects based on the analysis of the Lift(L1 ⇒ B) values was attempted.
Table 4 shows that the edge types of leadership (L2 and L3), motivating behavior (L9), information resources (L10) and cognitive ability (L6) increase the likelihood of leadership (L1). Although there are some specificities in term of the networks of different companies, e.g. lift(L1 ⇒ L2) is much greater in the case of Company A, but its trends are very similar. The high confidence values in the L1 columns of Fig. 4 indicate that this connection type has positive effects on contact type, trusted relationships and the judgment of professional knowledge.
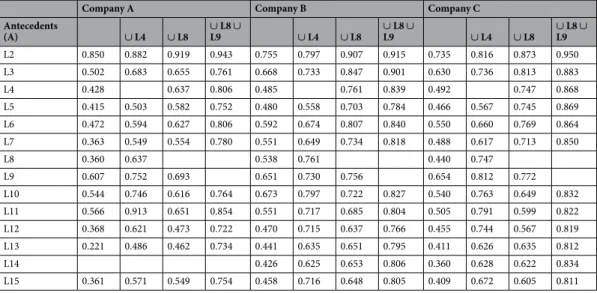
Dimensions that predict the occurrence of L1 are described by the A ⇒ L1 family of rules. The confi- dence(A ⇒ L1) of these rules represents the probability of the occurrence of L1 given the existence of the A dimensions. As is shown in Table 5, professional knowledge (L8) leads to a far more significant increase in the probability of get advice dimension (L1) than communication (L4) in the case of the existence of a leader (L2), working relationships (L5) and best working relationship (L7), as well as information sources (L6). However, L4 significantly increases the probability of the advice-type connection when motivation (L9), the capability of solving complex tasks (L10), the ability to manage colleagues (L11), and key person (L12) exist. In other words, the confidences of {L2 or L5 or L6 or L7} ∪ L8 ⇒ L1 are greater than the confidences of {L9 or L10 or L11 or L12} ∪ L8 ⇒ L1, and the confidences of {L2 or L5 or L6 or L7} ∪ L4 ⇒ L1 are less than the confidences of {L9 or L10 or L11 or L12} ∪ L4 ⇒ L1.
Most leaders (L2) give advice, especially in Company A. The probabilities are increased as the dimensions of the rules increase. Almost the same trends are shown in Tables 4 and 5 where the types of connections that are related to the advice network are presented. This result correlates well with the findings of ref.13 which show that advice is more likely to be sought from colleagues of higher statuses.
Conclusions
Organizational networks have been considered to be multilayer networks since the early 1990s, but so far no feasi- ble method of handling their multidimensionality has been found. It has been demonstrated that frequent pattern mining can be applied to reveal statistically significant correlations between the layers and that the method is applicable regarding edge, actor and organizational level analyses. Frequently occurring outgoing edges have been shown to be related to perceptions and ratings, while incoming patterns reflect how the actor is rated. It was also highlighted that measures of the association rules could be used to define the fingerprints of organizational net- works. The applicability of the methodology was demonstrated by the characterization of leaders and key persons in three organizations. In the future, the utilization of an extracted rule-base for the design of personal develop- ment programs, and the determination of a property-preserving multidimensional edge reordering algorithm to support goal-oriented organizational development is desired. The method can be applied to other multilayer networks where layers can represent dimensions and appropriate to make rankings.
Data Availability
Original data is not available for public use.
References
1. Tichy, N. M. Networks in organizations. Handbook of organizational design (1981).
2. Tichy, N. M., Tushman, M. L. & Fombrun, C. Social network analysis for organizations. The Acad. Manag. Rev. 4, 507–519, https://
doi.org/10.2307/257851 (1979).
3. Krackhardt, D. & Brass, D. J. Intraorganizational networks: The micro side (Sage Publications, Inc, 1994).
4. Ibarra, H. & Andrews, S. B. Power, social influence, and sense making: Effects of network centrality and proximity on employee perceptions. Adm. Sci. Q. 38, 277–303, https://doi.org/10.2307/2393414 (1993).
Company A Company B Company C
Antecedents
(A) ∪ L4 ∪ L8 ∪ L8 ∪
L9 ∪ L4 ∪ L8 ∪ L8 ∪
L9 ∪ L4 ∪ L8 ∪ L8 ∪ L9
L2 0.850 0.882 0.919 0.943 0.755 0.797 0.907 0.915 0.735 0.816 0.873 0.950
L3 0.502 0.683 0.655 0.761 0.668 0.733 0.847 0.901 0.630 0.736 0.813 0.883
L4 0.428 0.637 0.806 0.485 0.761 0.839 0.492 0.747 0.868
L5 0.415 0.503 0.582 0.752 0.480 0.558 0.703 0.784 0.466 0.567 0.745 0.869
L6 0.472 0.594 0.627 0.806 0.592 0.674 0.807 0.840 0.550 0.660 0.769 0.864
L7 0.363 0.549 0.554 0.780 0.551 0.649 0.734 0.818 0.488 0.617 0.713 0.850
L8 0.360 0.637 0.538 0.761 0.440 0.747
L9 0.607 0.752 0.693 0.651 0.730 0.756 0.654 0.812 0.772
L10 0.544 0.746 0.616 0.764 0.673 0.797 0.722 0.827 0.540 0.763 0.649 0.832
L11 0.566 0.913 0.651 0.854 0.551 0.717 0.685 0.804 0.505 0.791 0.599 0.822
L12 0.368 0.621 0.473 0.722 0.470 0.715 0.637 0.766 0.455 0.744 0.567 0.819
L13 0.221 0.486 0.462 0.734 0.441 0.635 0.651 0.795 0.411 0.626 0.635 0.812
L14 0.426 0.625 0.653 0.806 0.360 0.628 0.622 0.834
L15 0.361 0.571 0.549 0.754 0.458 0.716 0.648 0.805 0.409 0.672 0.605 0.811
Table 5. Confidences of the rule A⇒L1 of the companies.
5. Carter, D. R., DeChurch, L. A., Braun, M. T. & Contractor, N. S. Social network approaches to leadership: An integrative conceptual review. J. Appl. Psychol. 100, 597 (2015).
6. Krackhardt, D. & Kilduff, M. Friendship patterns and culture: The control of organizational diversity. Am. Anthropol. 92, 142–154, https://doi.org/10.1525/aa.1990.92.1.02a00100 (1990).
7. Brass, D. J. A social network perspective on organizational citizenship behavior. In The Oxford Handbook of Organizational Citizenship Behavior, 317 (Oxford University Press, 2018).
8. Bu, Z., Li, H., Cao, J., Wu, Z. & Zhang, L. Game theory based emotional evolution analysis for chinese online reviews. Knowledge- Based Syst. 103, 60–72 (2016).
9. Li, X. et al. Punishment diminishes the benefits of network reciprocity in social dilemma experiments. Proc. national academy sciences 115, 30–35 (2018).
10. Liu, Y. et al. The competition of homophily and popularity in growing and evolving social networks. Sci. Rep. 8 (2018).
11. Yuan, Y. & Alabdulkareem, A. et al. An interpretable approach for social network formation among heterogeneous agents. Nat.
Commun. 9, 4704 (2018).
12. Carrington, P. J., Scott, J. & Wasserman, S. Models and methods in social network analysis, vol. 28 (Cambridge university press, 2005).
13. Lazega, E., Mounier, L., Snijders, T. & Tubaro, P. Norms, status and the dynamics of advice networks: A case study. Soc. Networks 34, 323–332 (2012).
14. Borgatti, S. P. & Halgin, D. S. On network theory. Organ. science 22, 1168–1181 (2011).
15. Zagenczyk, T. J., Purvis, R. L., Shoss, M. K., Scott, K. L. & Cruz, K. S. Social influence and leader perceptions: Multiplex social network ties and similarity in leader–member exchange. J. Bus. Psychol. 30, 105–117, https://doi.org/10.1007/s10869-013-9332-7 (2015).
16. Giddens, A. The constitution of society: Outline of the theory of structuration (Univ of California Press, 1984).
17. Whitbred, R., Fonti, F., Steglich, C. & Contractor, N. From microactions to macrostructure and back: A structurational approach to the evolution of organizational networks. Hum. Commun. Res. 37, 404–433 (2011).
18. Granovetter, M. Economic action and social structure: The problem of embeddedness. Am. journal of sociology 91, 481–510 (1985).
19. Galaskiewicz, J. & Bielefeld, W. Nonprofit organizations in an age of uncertainty: A study of organizational change (Transaction Publishers, 1998).
20. Monge, P. R. & Contractor, N. S. Theories of communication networks (Oxford University Press, USA, 2003).
21. Contractor, N., Monge, P. & Leonardi, P. M. Multidimensional networks and the dynamics of sociomateriality: bringing technology inside the network. Int. J. Commun. 5, 682–720 (2011).
22. Michalski, R. & Kazienko, P. Social network analysis in organizational structures evaluation, 1832–1844 (Springer, 2014).
23. Cai, M., Wang, W., Cui, Y. & Stanley, H. E. Multiplex network analysis of employee performance and employee social relationships.
Phy. A: Stat. Mech. its Appl. 490, 1–12 (2018).
24. Zhou, W., Bao, W., Zhu, X., Wang, J. & Chen, C. Integrating relationships and attributes: A model of multilayer networks. In Data Science in Cyberspace (DSC), IEEE International Conference on, 127–136 (IEEE, 2016).
25. Kivela, M. et al. Multilayer networks. J. Complex Networks 2, 203–271, https://doi.org/10.1093/comnet/cnu016 (2014).
26. Boccaletti, S. et al. The structure and dynamics of multilayer networks. Phys. Rep. 544, 1–122, https://doi.org/10.1016/j.
physrep.2014.07.001 (2014).
27. Magnani, M. & Rossi, L. The ML-Model for Multi-layer Social Networks, 5–12 (2011).
28. Socievole, A., De Rango, F. & Caputo, A. Wireless contacts, Facebook friendships and interests: Analysis of a multi-layer social network in an academic environment, 1–7 (IEEE, 2014).
29. Weiyi, L., Lingli, C. & Guangmin, H. Mining essential relationships under multiplex networks. arXiv preprint arXiv:1511.09134 (2015).
30. Dickison, M. E., Magnani, M. & Rossi, L. Multilayer social networks (Cambridge University Press, 2016).
31. Murase, Y., Török, J., Jo, H.-H., Kaski, K. & Kertész, J. Multilayer weighted social network model. Phys. Rev. E 90, https://doi.
org/10.1103/PhysRevE.90.052810 (2014).
32. Lee, K.-M., Min, B. & Goh, K.-I. Towards real-world complexity: an introduction to multiplex networks. The Eur. Phys. J. B. 88, https://doi.org/10.1140/epjb/e2015-50742-1 (2015).
33. Mollgaard, A. et al. Measure of node similarity in multilayer networks. PLOS ONE 11, https://doi.org/10.1371/journal.pone.0157436 (2016).
34. Battiston, F., Nicosia, V. & Latora, V. Structural measures for multiplex networks. Phys. Rev. E 89 (2014).
35. Iván, A. & Aldasoro, I. Mrtance: An application to european data. Jo. Financial Stab. 35, 17–37, https://doi.org/10.1016/j.
jfs.2016.12.008 (2018).
36. Holland, P. W. & Leinhardt, S. The structural implications of measurement error in sociometry. J. Math. Sociol. 3, 85–111 (1973).
37. Battiston, F., Nicosia, V. & Latora, V. The new challenges of multiplex networks: Measures and models. The Eur. Phys. J. Special Top.
226, 401–416, https://doi.org/10.1140/epjst/e2016-60274-8 (2017).
38. Borgelt, C. Frequent item set mining. Wiley Interdiscip. Rev.: Data Min. Knowl. Discov. 2, 437–456, https://doi.org/10.1002/
widm.1074 (2012).
39. Yan, X. & Han, J. Gspan: Graph-based substructure pattern mining. In 2002 IEEE International Conference on Data Mining, 2002.
Proceedings., 721–724 (IEEE, 2002).
40. Getoor, L. & Diehl, C. P. Link mining: a survey. Acm Sigkdd Explor. Newsl. 7, 3–12 (2005).
41. Chen, J., Hsu, W., Lee, M. L. & Ng, S. K. Labeling network motifs in protein interactomes for protein function prediction, 546–555 (2007).
42. Marinho, V. Q., Hirst, G. & Amancio, D. R. Labelled network subgraphs reveal stylistic subtleties in written texts. J. Complex Networks, https://academic.oup.com/comnet/advance-article/doi/10.1093/comnet/cnx047/4430454, https://doi.org/10.1093/
comnet/cnx047 (2017).
43. Imielinski, T., Swami, A. & Agarwal, R. Mining association rules between sets of items in large databases. 207–216 (ACM Press, 1993).
44. Han, J., Pei, J. & Kamber, M. Data Mining: Concepts and Techniques (Elsevier, 2011).
45. Hahsler, M. & Chelluboina, S. Visualizing association rules: Introduction to the r-extension package arulesviz. R project module 223–238 (2011).
46. Piatetsky-Shapiro, G. Discovery, analysis and presentation of strong rules. In Piatetsky-Shapiro, G. & Frawley, W. J. (eds) Knowledge Discovery in Databases, 229–248 (AAAI Press, 1991).
47. Hegland, M. The apriori algorithm–a tutorial. In Mathematics and computation in imaging science and information processing, 209–262 (World Scientific, 2007).
48. Borgatti, S. P. & Foster, P. C. The network paradigm in organizational research: A review and typology. J. Manag. 29, 991–1013 (2003).
49. Perry-Smith, J. E. & Shalley, C. E. The social side of creativity: A static and dynamic social network perspective. Acad. Manage. Rev.
28, 89–106 (2003).
50. Berlingerio, M., Pinelli, F. & Calabrese, F. Abacus: frequent pattern mining-based community discovery in multidimensional networks. Data Min. Knowl. Discov. 27, 294–320, https://doi.org/10.1007/s10618-013-0331-0 (2013).
51. Newman, M. E. Modularity and community structure in networks. Proc. national academy sciences 103, 8577–8582 (2006).
52. Li, H.-J., Bu, Z., Li, A., Liu, Z. & Shi, Y. Fast and accurate mining the community structure: Integrating center locating and membership optimization. IEEE Transactions on Knowl. Data Eng. 28, 2349–2362, https://doi.org/10.1109/TKDE.2016.2563425 (2016).
53. Li, H.-J. & Daniels, J. J. Social significance of community structure: Statistical view. Phys. Rev. E. 91, https://doi.org/10.1103/
PhysRevE.91.012801 (2015).
54. Reichardt, J. & Bornholdt, S. Statistical mechanics of community detection. Phys. Rev. E. 74, http://arxiv.org/abs/cond-mat/0603718, https://doi.org/10.1103/PhysRevE.74.016110 (2006).
55. Li, H.-J., Wang, H. & Chen, L. Measuring robustness of community structure in complex networks. EPL (Europhysics Lett.) 108, 68009, https://doi.org/10.1209/0295-5075/108/68009 (2014).
56. Unwin, A., Hofmann, H. & Bernt, K. The twokey plot for multiple association rules control. In Principles of Data Mining and Knowledge Discovery, 472–483 (Springer, Berlin, Heidelberg, 2001).
57. Iacobucci, D., McBride, R., Popovich, D. L. & Rouziou, M. In social network analysis, which centrality index should i use?:
Theoretical differences and empirical similarities among top centralities. J. Methods Meas. Soc. Sci. 8, 72–99 (2017).
58. Reynolds, A. P., Richards, G., de la Iglesia, B. & Rayward-Smith, V. J. Clustering rules: a comparison of partitioning and hierarchical clustering algorithms. J. Math. Model. Algorithms 5, 475–504 (2006).
59. Van der Laan, M., Pollard, K. & Bryan, J. A new partitioning around medoids algorithm. J. Stat. Comput. Simul. 73, 575–584 (2003).
60. Bhat, A. K-medoids clustering using partitioning around medoids for performing face recognition. Int. J. Soft Comput., Math.
Control 3, 1–12 (2014).
61. Velmurugan, T. & Santhanam, T. Computational complexity between k-means and k-medoids clustering algorithms for normal and uniform distributions of data points. J. computer science 6, 363 (2010).
Acknowledgements
The research has been supported by the National Research, Development and Innovation Office—NKFIH, through the project OTKA—116674 (Process mining and deep learning in the natural sciences and process development), the European Union and Hungary and co-financed by the European Social Fund through the project EFOP-3.6.2-16-2017-00017, titled “Sustainable, intelligent and inclusive regional and city model” and MTA-PE Budapest Ranking Research Group (grant No. 16208).
Author Contributions
L.G. and J.A. contributed equally to this work. L.G. assisted in research design, acquired the original data, performed data analysis and visualizations, drafted the manuscript. J.A. supervised and conceptualized, reviewed and edited the manuscript. All authors reviewed the manuscript.
Additional Information
Competing Interests: The authors declare no competing interests.
Publisher’s note: Springer Nature remains neutral with regard to jurisdictional claims in published maps and institutional affiliations.
Open Access This article is licensed under a Creative Commons Attribution 4.0 International License, which permits use, sharing, adaptation, distribution and reproduction in any medium or format, as long as you give appropriate credit to the original author(s) and the source, provide a link to the Cre- ative Commons license, and indicate if changes were made. The images or other third party material in this article are included in the article’s Creative Commons license, unless indicated otherwise in a credit line to the material. If material is not included in the article’s Creative Commons license and your intended use is not per- mitted by statutory regulation or exceeds the permitted use, you will need to obtain permission directly from the copyright holder. To view a copy of this license, visit http://creativecommons.org/licenses/by/4.0/.
© The Author(s) 2019