DOI: 10.1556/066.2018.47.4.6
POLYPHENOLS IN CHINESE KUSHUI ROSE (ROSA SERTATA × ROSA RUGOSA) LEAVES
H. XUa,b§, Y. WANGa§, F. YUANa and Y. GAOa*
aBeijing Advanced Innovation Center for Food Nutrition and Human Health, Beijing Laboratory for Food Quality and Safety, Beijing Key Laboratory of Functional Food from Plant Resources, College of Food Science
and Nutritional Engineering, China Agricultural University, P. O. Box 112, No.17 Qinghua East Road, Haidian District, Beijing, 100083, P.R. China
bBeijing Institute of Nutritional Resources, No. 4 Dong Binhe Road, Fengtai District, Beijing, 100069, P.R. China (Received: 27 December 2017; accepted 27 April 2018)
Polyphenols in Chinese Kushui rose (Rosa sertata × Rosa rugosa) leaves were fi rst extracted and analysed in this study. Among four fractions (ethyl ether, ethyl acetate, n-butanol, and water layer) of crude extracts, the ethyl acetate fraction showed the highest ABTS•+ scavenging activity, and the n-butanol fraction exhibited the maximum components in composition. On-line HPLC-ABTS•+ analysis indicated that there were more than 30 antioxidant compounds from Chinese Kushui rose leaves. The identifi ed polyphenols could be classifi ed into quercetin derivatives, gallic acid derivatives, and proanthocyanidins. Gallic acid was the most antioxidative compound.
Keywords: Chinese Kushui rose leaves, polyphenols, ABTS•+ scavenging activity, HPLC-DAD-MS/MS
Roses and their products (essential oils, petals, and extracts) are widely used in food, cosmetic, household cleaning, and medical industries. Rose petals are used as raw materials for products of tea, wine, juice, and jams. Petals and roots of roses have also been utilized in traditional medicine for the treatment of diarrhoea, injuries, gastroenteritis, hepatitis, dysmenorrhea, and blood circulation disorders, as well as pain management and haemostasis maintenance (OCHIR et al., 2010). The extract from rose petals showed excellent reducing capacity and free radical scavenging activity (GE & MA, 2013), the main antioxidant components of rose petals were gallic acid derivatives (NG et al., 2004).
Most of reports on rose products were from the species of Rosa sericea, Rosa rugosa, and Rosa damascena Mill. Chinese Kushui rose (Rosa sertata × Rosa rugosa), mainly planted in Gansu Province of the People’s Republic of China, is very famous for its aromatic profi le and high content (≥40%) of citronellol in its essential oil (ZHANG et al., 2003). As various tissues of a plant should have similar phytochemical composition, it implies that Chinese Kushui rose leaves should be good sources of fl avonoids. The purpose of the current study was to analyse total phenol contents in the extract of Chinese Kushui rose leaves, and evaluate its active components by on-line HPLC-ABTS•+ assay and HPLC-DAD-MS/MS method.
* To whom correspondence should be addressed.
Phone: +86 10 6273 7034; fax: +86 10 6273 7986; e-mail: gyxcau@126.com
§: These two authors contributed equally to this paper.
434
1. Materials and methods
1.1. Plant material and chemicals
The dried Chinese Kushui rose (Rosa sertata × Rosa rugosa) leaves (moisture, 5.8±0.5%) were kindly supplied by Gansu Oriental Tianrun Rose Industry Co. Ltd. (Lanzhou, China) .
6-Hydroxy-2,5,7,8-tetramethylchroman-2-carboxylic acid (Trolox), Folin-Ciocalteu’s reagent (2N), 2,2’-azinobis (3-ethylbenzothiazoline-6-sulfonic acid) diammonium salt (ABTS), (+)-catechin hydrate, and rutin were purchased from Sigma-Aldrich (Shanghai, China).
1.2. Preparation of the crude extracts and fractions
The ro se leaves powder (1 g, d<0.85 mm) was extracted with 30 ml ethanol (50%, v/v) for 120 min (2×60 min) at 70 °C in a shaking bath (Model DSHZ-300, Suzhou, China). The extracts were then fi ltered and centrifuged at 2000 × g for 10 min, then the supernatant was evaporated at 50 °C and –0.08 MPa to make the soluble solid content up to 8%. The concentrates were further fractionized into four portions by ethyl ether, ethyl acetate, n-butanol, and water. Each of the four corresponding fractions was evaporated to dryness at 50 °C and –0.08 MPa, and then dissolved in methanol and stored at –18 °C until used.
1.3. Determination of total phenolic content (TPC)
The TPC was measured using aluminium chloride colorimetric assay, following the method described by GONG and co-workers (2012), and expressed in rutin equivalent.
1.4. Evaluation of radical scavenging capacity
The ABTS˙+ scavenging capacity of Chinese Kushui rose leaves extracts was determined with the procedure described by GONG and co-workers (2012) and expressed in Trolox equivalent.
On-line HPLC-ABTS˙+ detection was following the method of HE and co-workers (2012) with a slight modifi cation. The differences were in the mobile phase (2% (v/v) formic acid (solvent A) and acetonitrile (solvent B)) and its gradient elution. The solvent A was set from 100% to 90% from 0 to 15 min, and kept at 90% till 20 min, decreased to 85% at 30 min, then kept at 85% till 40 min, decreased to 80% at 50 min, kept at 80% till 55 min, and decreased to 70% at 60 min.
1.5. Identifi cation of polyphenols
The identifi cation of polyphenols was carried out by comparing the characteristics of DAD spectra, retention time of standard compounds, and MS data to those reported in the literature.
The mass detector of the HPLC-MS system was a G6310 ion-trap mass spectrometer (Agilent Technologies Inc., Santa Clara, USA) equipped with an electrospray ionization (ESI) system and controlled by Agilent LC/MSD trap software. Nitrogen was used as nebulizing gas at a pressure of 30 psi with a fl ow rate of 9.0 l min–1. The nebulizer temperature was 325 °C and capillary voltage was maintained at 4000 V. The compounds were measured at the scan range of the mass spectra from m/z 100 u to m/z 1500 u. MS was operated in both positive and negative ion modes.
1.6. Statistical analysis
The whole experiment and all analyses were carried out in triplicate. The data were subjected to analysis of variance (ANOVA) using the Origin Pro 9.0 software (Originlab Corporation, Northampton, USA). Signifi cant differences (P<0.05) of means were determined by the Tukey’s test.
2. Results and discussion
2.1. ABTS•+ scavenging activity of the extracts from Chinese Kushui rose leaves
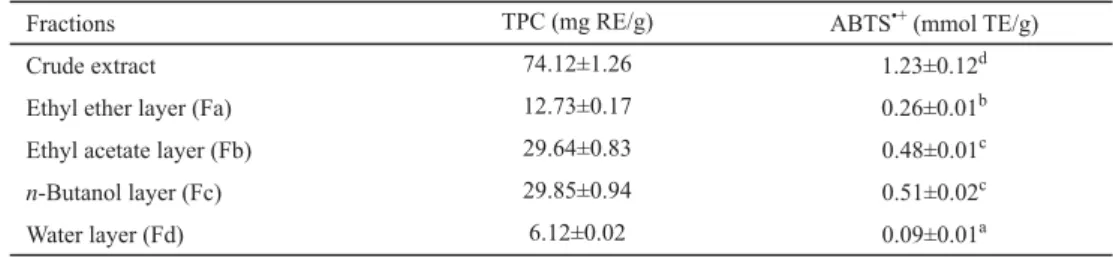
Table 1 shows four fractions of the crude extract from Chinese Kushui rose leaves. TPC of ethyl acetate layer (39%) was the highest, followed by n-butanol la yer (37%), ethyl ether layer (16%), and water layer (8%). The reason for that could be the different compositions and polarities of their components (GONG et al., 2012; HE et al., 2012). The Trolox equivalent ABTS•+ scavenging capacity and TPC values of the extracts could be at linear correlations (R2=0.925) (HE et al., 2012).
Table 1. Total phenolic content (TPC) and ABTS•+ scavenging capacities of different fractions of the extract from Chinese Kushui rose leaves
Fractions TPC (mg RE/g) ABTS•+ (mmol TE/g)
Crude extract 74.12±1.26 1.23±0.12d
Ethyl ether layer (Fa) 12.73±0.17 0.26±0.01b
Ethyl acetate layer (Fb) 29.64±0.83 0.48±0.01c
n-Butanol layer (Fc) 29.85±0.94 0.51±0.02c
Water layer (Fd) 6.12±0.02 0.09±0.01a
RE: rutin equivalent; TE: Trolox equivalent
Values are expressed as means ± S.D. (n=3); the numbers in each column marked with different superscript letters were signifi cantly (P<0.05) different.
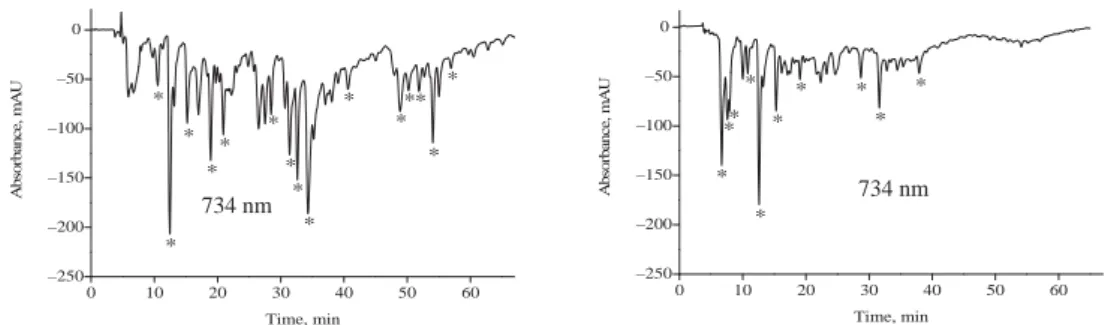
The HPLC profi les of components and ABTS˙+ scavenging antioxidants in the four fractions of the extract are signifi cantly different (Fig. 1). To compare the free radical scavenging capacity of each component, negative absorbance lower than –100 mAU was chosen as a standard in comparison. It must be noted that ABTS radical scavenging property is only an additional physico-chemical characteristic of polyphenols. On-line HPLC-ABTS˙+ analysis is used to support the identifi cation of polyphenols and screen them quickly. The intensity of this property cannot be directly associated with better in vivo bioeffi cacy of identifi ed polyphenols.
In ethyl ether fraction (Fraction A, Fa), compound 1 exhibited higher ABTS•+ scavenging activity. In ethyl acetate fraction (Fb), compounds 1, 4, 15 had higher ABTS˙+ scavenging capacity. In n-butanol fraction (Fc), compounds 1, 11, 14, 15, 20, 22, 25 showed higher ABTS•+ scavenging activity. In water fraction (Fd), compounds 1 and 26 exhibited higher antioxidant activity. Interestingly, compound 4 was the main radical scavenger in Fb, but not the main scavenger in Fa. This could be ascribed to the different concentrations of compound 4 in Fa and Fb. Compound 1 was the most signifi cant contributor in all four fractions.
436
0 50 100 150 200 250 300 350 400
10 9
8 7 5 6
34 2
Absorbance, mAU
1
0 50 100 150 200 250 300 350 400
9 25 7
24
16
23 15 14 22
21 20 11
19 1
18
Absorbance, mAU
0 50 100 150 200 250 300 350
Absorbance, mAU
350 nm Fraction C
0 10 20 30 40 50 60
–250 –200 –150 –100 –50 0
* *
*
*
**
*
*
*
Absorbance, mAU
Time, min
*
734 nm
0 50 100 150 200 250 300 350
Absorbance, mAU
Fraction A
350 nm
0 10 20 30 40 50 60
–250 –200 –150 –100 –50 0
*
*
*
*
**
*
**
*
*
* *
*
Absorbance, mAU
Time, min 0
50 100 150 200 250 300 350 400
10 89 7
5 17
16 15
14 4 1213 1
11
Absorbance, mAU
0 50 100 150 200 250 300 350 400
31 22 21 11 19 29
30 28 27 26
1
Absorbance, mAU
270 nm
270 nm 270 nm
0 50 100 150 200 250 300 350
Absorbance, mAU
Fraction B
350 nm
270 nm
734 nm
0 50 100 150 200 250 300 350
Absorbance, mAU
Fraction D
350 nm
0 10 20 30 40 50 60 0 10 20 30 40 50 60
0 10 20 30 40 50 60 –250
–200 –150 –100 –50 0
*
*
*
*
* *
*
*
*
*
*
*
*
*
*
Absorbance, mAU
Time, min
734 nm
0 10 20 30 40 50 60
–250 –200 –150 –100 –50 0
*
*
*
*
*
*
*
**
Absorbance, mAU *
Time, min
734 nm
Fig. 1. HPLC chromatograms of Chinese Kushui rose leaves extract (Fraction A: ethyl ether layer fraction;
Fraction B: ethyl acetate layer fraction; Fraction C: n-butanol layer fraction; Fraction D: water layer fraction;
Absorbance at 270, 350, and 734 nm were detected for gallic acid derivatives, fl avonoids, and ABTS•+ scavenging compounds; Peak numbers refer to those in Table 2.)
2.2. Identifi cation of polyphenols in the extract from Chinese Kushui rose leaves
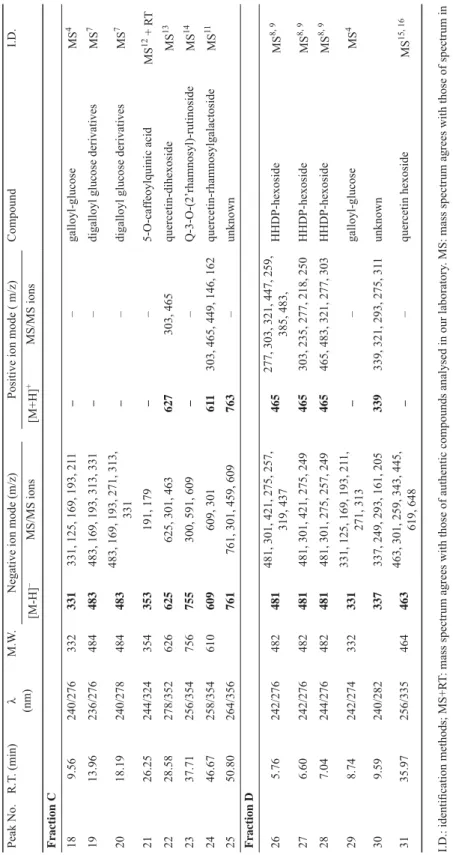
The chromatographic HPLC-ESI/MS and UV data for the identifi cation of major free radical scavengers, showed in Figure 1, are shown in Table 2.
2.2.1. Quercetin derivatives. The presence of quercetin-3-rutinoside (rutin, 16, 17, 31) was revealed in the extract from Chinese Kushui rose leaves. The ESI-MS spectrum displayed an intense parent ion at m/z 609, a fragment at m/z 301 matched with quercetins derivatives.
The fragment at m/z 463 was due to a loss of rhamnose moiety from the parent ion. Moreover, by comparison with the UV-Vis spectra data reported in the literature and retention time of the standard compound, compounds 16, 17, and 24 were identifi ed as epimers of quercetin- rhamnosylgalactoside (TIBERTI et al., 2007; HE et al., 2010).
Compounds 7 and 31 gave a [M-H]– ion at m/z 463, and their λmax was about at 356 nm.
Furthermore, the deprotonated molecular ion [M-H]– yielded a fragment at m/z 301 on MS2 spectra, therefore, they could be identifi ed as isomers of quercetin hexoside (SEERAM et al., 2006; KAJDŽANOSKA et al., 2010).
Two compounds (8, 9) in the ether fraction were detected with m/z 433 in the MS1 analysis, and a fragment at m/z 301 was detected in the MS2 analysis. According to the DAD spectra data (λmax=354 nm), the fragmentations of both constituents were well in accordance with quercetin pentoside (CAROCHO et al., 2014).
Compound 10 gave a [M-H]– ion at m/z 585, and its λmax was about at 360 nm.
Furthermore, the deprotonated molecular ion [M-H]– yielded fragments at m/z 301 and 433 on MS2 spectra. It could be identifi ed as quercetin-O-(O-galloyl)-pentoside (SALDANHA et al., 2013).
Compound 22 was assigned to quercetin-dihexoside according to its pseudomolecular ion ([M-H]– at m/z 625) and fragmentation ions at m/z 463 [M-162-H]– and 301 [M-162- 162-H]–. Such fragmentation pattern and its UV spectrum (λmax=352 nm) confi rmed the presence of quercetin-dihexoside (WILLIAM et al., 2003).
Compound 23 was identifi ed as an O-glycoside of quercetin according to the UV spectrum (λmax=256, 364 nm) and a major MS2 ion at m/z 300 (M-H-448). This analysis also showed that compound 23 contained one additional deoxyhexose sugar unit (MS2 ion at m/z 591 [M-H-164]–). The loss of the deoxyhexose residue (146 amu for deoxyhexose) yielded a MS2 ion at m/z 609 (SIMIRGIOTIS et al., 2009).
438
Table 2. Polyphenols in the extract of Chinese Kushui rose (Rosa sertata × Rosa rugosa) leaves Peak No.R.T. (min)λ (nm)M.W.Negative ion mode (m/z)Positive ion mode ( m/z)CompoundI.D. [M-H]–MS/MS ions[M+H]+MS/MS ions Fraction A 111.05238/272170169169, 125––gallic acidMS1, 2 + RT 215.80260/292––– –unknown 321.52272578577 425, 407, 451––catechin-catechinMS3 + RT 423.72240/278290289289, 245, 205, 179, 125––catechinMS3 + RT 527.74244/300/322;636635635, 465, 483––trigalloyl glucoseMS4 636.12262275275, 258, 229, 247––unknown 748.38234/254/358464463463, 301, 151, 179, 342465303quercetin hexosideMS5 852.50256/354434433301, 151, 179, 342, 414––quercetin pentosideMS5 955.26256/352434433301, 151, 179, 342, 414435435, 322, 336, 209, 226quercetin pentosideMS5 1058.83268/360586585301, 585, 433587285, 303, 267, 417, 205quercetin-O-(O-galloyl)-pentosideMS6 Fraction B 1117.36252/280484483483, 169, 331, 313––digalloyl glucose derivativesMS7 1219.27244/276634633632, 301, 481, 463, 275, 257––galloyl-HHDP-glucoseMS8, 9 1322.55282578577577, 425, 289, 407579247, 291, 427, 301, 289epicatechin-epicatechinMS3 + RT 1429.91270786785633, 301––digalloyl-HHDP-hexosideMS10 1531.40274786785785, 301, 483, 419, 633––digalloyl-HHDP-hexosideMS10 1645.43258/354/358610609609, 301611303, 449, 465quercetin-rhamnosylgalactosideMS11 1746.68254/354/358610609609, 301611303, 465, 449quercetin-3-rhamnosylglucosideMS11
Peak No.R.T. (min)λ (nm)M.W.Negative ion mode (m/z)Positive ion mode ( m/z)CompoundI.D. [M-H]–MS/MS ions[M+H]+MS/MS ions Fraction C 189.56240/276332331331, 125, 169, 193, 211––galloyl-glucoseMS4 1913.96236/276484483483, 169, 193, 313, 331––digalloyl glucose derivativesMS7 2018.19240/278484483483, 169, 193, 271, 313, 331––digalloyl glucose derivativesMS7 2126.25244/324354353191, 179––5-O-caffeoylquinic acidMS12 + RT 2228.58278/352626625625, 301, 463627303, 465quercetin-dihexosideMS13 2337.71256/354756755300, 591, 609––Q-3-O-(2’rhamnosyl)-rutinosideMS14 2446.67258/354610609 609, 301611303, 465, 449, 146, 162quercetin-rhamnosylgalactosideMS11 2550.80264/356761 761, 301, 459, 609763–unknown Fraction D 265.76242/276482481481, 301, 421, 275, 257, 319, 437 465277, 303, 321, 447, 259, 385, 483, HHDP-hexosideMS8, 9 276.60242/276482481481, 301, 421, 275, 249465303, 235, 277, 218, 250HHDP-hexosideMS8, 9 287.04244/276482481481, 301, 275, 257, 249465465, 483, 321, 277, 303HHDP-hexosideMS8, 9 298.74242/274332331331, 125, 169, 193, 211, 271, 313––galloyl-glucoseMS4 309.59240/282337337, 249, 293, 161, 205339339, 321, 293, 275, 311unknown 3135.97256/335464463463, 301, 259, 343, 445, 619, 648 ––quercetin hexosideMS15, 16 I.D.: identifi cation methods; MS+RT: mass spectrum agrees with those of authentic compounds analysed in our laboratory. MS: mass spectrum agrees with those of spectrum in the literature. Compounds identifi ed with references are indicated by superscript numbers. 1: PRAKASH et al., 2007; 2: LEE et al., 2005; 3: SUN et al., 2007; 4: BARROS et al., 2013; 5: CAROCHO et al., 2014; 6: SALDANHA et al., 2013; 7: ROMEO et al., 2015; 8: REGUEIRO et al., 2014; 9: MENA et al., 2012; 10: FISCHER et al., 2011; 11: TIBERTI et al., 2007; 12: HE et al., 2010; 13: WILLIAM et al., 2003; 14: SIMIRGIOTIS et al., 2009; 15: KAJDŽANOSKA et al., 2010; 16: SEERAM et al., 2006.
Table 2. continued
440
2.2.2. Gallic acid derivatives. The aglycone of ellagic acid showed the same [M-H]– ion at m/z 301 like quercetin. However, ellagic acid produced fragments at m/z 258, 229 and 185 in the MS2 analysis, whereas quercetin generated fragments at m/z 179 and 151 (ROMEO et al., 2015). Furthermore, both compounds signifi cantly differed in their UV-Vis spectra (λmax; ellagic acid: 275 and 367 nm; quercetin: 252, 286, and 372 nm), thus allowing them differentiated unambiguously.
Compounds 11, 19, 20 gave the same [M-H]– ion at m/z 483 in accordance with a molecular formula C20H20O14. Their λmax were about 276 nm. Their deprotonated molecular ions [M-H]– yielded four fragments at m/z 331, 313, 193, and 169 on MS2 spectra, which represented different diagnostic fragmentations of galloyl, glucose, digalloyl, and gallic acid, respectively. Moreover, the relative intensities of ions in each spectrum were signifi cantly different at the same MS2 condition. In this study, there were some conspicuous fragmentation differences amongst the three compounds. The fragmentation behaviours of both constituents were in accordance with those detected by MEYERS and co-workers (2006). Identifi cation of compounds 11, 19, 20 was achieved by comparing their ESI-MS2 spectra and they could be identifi ed as digalloyl glucose derivatives. Compound 5 was identifi ed as trigalloyl glucose, and compounds 18 and 29 were identifi ed as galloyl-glucose (BARROS et al., 2013).
In water fraction, compounds 12, 26, 27, and 28 were detected with m/z 481 in the MS1 analysis. All these compounds produced a fragment at m/z 301, and their λmax were about at 275 nm, which indicated an ellagic acid moiety released. Three compounds were tentatively identifi ed as hexahydroxydiphenoyl-hexoside (HHDP-hexoside) (MENA et al., 2012;
REGUEIRO et al., 2014).
Compounds 14 and 15 were characterized as digalloyl-HHDP-hexoside (pedunculagin II). The DAD spectra data and fragmentation behaviours of both compounds were in accordance with literature data (FISCHER et al., 2011). Their [M-H]– ion were at m/z 785 and typical ellagitannin and gallotannin fragments were released at m/z 483 (digalloyl-hexoside), 301 (ellagic acid), and 633 (galloyl-HHDP-hexoside). Their different retention times were ascribed to their isomeric structures resulting in their different fragmentation patterns.
Compound 1, the most abundant and effective antioxidative component, gave a negative ion at m/z 169 [M-H]– and fragment ion at m/z 125 [M-CO2]+, the compound could be recognized as gallic acid by comparison with the published data (LEE et al., 2005; PRAKASH et al., 2007).
2.2.3. Proanthocyanidins. The mass spectra showed the deprotonated molecule [M-H]- of catechin at m/z 289 with the characteristic MS2 ions at m/z 245, 205, 179, 125, and UV maximum at 280 nm. For epicatechin, its mass spectra were same to those of catechin, but the λmax of epicatechin was 270 nm (DINCHEVA et al., 2013).
Compounds 3 and 13 had [M-H]– at m/z 577 and main fragmentation with a loss of 152 amu were recognized as proanthocyanidin dimmers (SUN et al., 2007). On considering the λmax of catechin and epicatechin, Compound 3 was recognized as the dimer of catechin- catechin, compound 13 was recognized as the dimer of epicatechin-epicatechin, and compound 4 was recognized as catechin.
2.2.4. Miscellaneous. Compound 21 generated a [M-H]- ion at m/z 353, and two fragment ions at m/z 191 and 179. Based on its λmax at 325 nm and the retention time of authentic compound, compound 21 was identifi ed as 5-O-caffeoylquinic acid (HE et al., 2010).
3. Conclusions
In conclusion, 50% ethanol solution was an effective solvent to obtain crude extract from Chinese Kushui rose leaves. Although the in vitro ABTS˙+ scavenging capacity of a compound is not equivalent to its in vivo physiological action, on-line HPLC-ABTS˙+ analysis is still helpful in screening bioactive components in herbal extracts. There were 31 main polyphenols contributing to the ABTS•+ scavenging activity of the extract from Chinese Kushui rose leaves, and the compound with the most antioxidant capacity was gallic acid.
References
BARROS, L., DUEÑAS, M., ALVES, C.T., SILVA, S., HENRIQUES, M., SANTOS-BUELGA, C. & FERREIRA, I.C.F.R. (2013):
Antifungal activity and detailed chemical characterization of Cistus ladanifer phenolic extracts. Ind. Crop.
Prod., 41, 41–45.
CAROCHO, M., BARROS, L., BENTO, A., SANTOS-BUELGA, C., MORALES, P. & FERREIRA, I.C.F.R. (2014): Castanea sativa Mill. fl owers amongst the most powerful antioxidant matrices: A phytochemical approach in decoctions and infusions. BioMed Res. Int. http://dx.doi.org/10.1155/2014/232956.
DINCHEVA, I., BADJKOV, I., KONDAKOVA, V., DOBSON, P., MCDOUGALL, G. & STEWART, D. (2013): Identifi cation of the phenolic components in Bulgarian raspberry cultivars by LC-ESI-MSn. Int. J. Agric. Sci. Res., 3, 127–138.
FISCHER, U.A., CARLE, R. & KAMMERER, D.R. (2011): Identifi cation and quantifi cation of phenolic compounds from pomegranate (Punica granatum L.) peel, mesocarp, aril and differently produced juices by HPLC-DAD-ESI/
MSn. Food Chem., 127, 807–821.
GE, Q. & MA, X. (2013): Composition and antioxidant activity of anthocyanins isolated from Yunnan edible rose (An ning). Food Sci. Human Wellness, 2, 68–74.
GONG, Y., LIU, X., HE, W., XU, H., YUAN, F. & GAO, Y. (2012): Investigation into the antioxidant activity and chemical composition of alcoholic extracts from defatted marigold (Tagetes erecta L.) residue. Fitoterapia, 83, 481–
489.
HE, L., ZHANG, X., XU, H., XU, C., YUAN, F., KNEZ, Z., NOVAK, Z. & GAO, Y. (2012): Subcritical water extraction of phenolic compounds from pomegranate (Punica granatum L.) seed residues and investigation into their antioxidant activities with HPLC-ABTS•+ assay. Food Bioprod. Process, 90, 215–223.
HE, W., LIU, X., XU, H., GONG, Y., YUAN, F. & GAO, Y. (2010): On-line HPLC-ABTS screening and HPLC-DAD-MS/
MS identifi cation of free radical scavengers in gardenia (Gardenia jasminoides Ellis) fruit extracts. Food Chem., 123, 521–528.
KAJDŽANOSKA, M., GJAMOVSKI, V. & STEFOVA, M. (2010): HPLC-DAD-ESI-MSn identifi cation of phenolic compounds in cultivated strawberries from Macedonia. Maced. J. Chem. Chem. Eng., 29, 181–194.
LEE, J., JOHNSON, J.V. & TALCOTT, S.T. (2005): Identifi cation of ellagic acid conjugates and other polyphenolics in muscadine grapes by HPLC-ESI-MS. J. Agr. Food Chem., 53, 6003–6010.
MENA, P., CALANI, L., DALL’ASTA, C., GALAVERNA, G., GARCÍA-VIGUERA, C., BRUNI, R., CROZIER, A. & RIO, D.D.
(2012): Rapid and comprehensive evaluation of (poly)phenolic compounds in pomegranate (Punica granatum L.) juice by UHPLC-MSn. Molecules, 17, 14821–14840.
MEYERS, K.J., SWIECKI, T.J. & MITCHELL, A.E. (2006): Understanding the native Californian diet: Identifi cation of condensed and hydrolyzable tannins in Tanoak acorns (Lithocarpus densifl orus). J. Agr. Food Chem., 54, 7686–7691.
NG, T.B., HE, J.S., NIU, S.M., ZHAO, L., PI, Z.F., SHAO, W. & LIU, F. (2004): A gallic acid derivative and polysaccharides with antioxidative activity from rose (Rosa rugosa) fl owers. J. Pharm. Pharmacol., 56, 537–545.
OCHIR, S., PARK, B.J., NISHIZAWA, M., KANAZAWA, T., FUNAKI, M. & YAMAGISHI, T. (2010): Simultaneous determination of hydrolysable tannins in the petals of Rosa rugosa and allied plants. J. Nat. Med., 64, 383–387.
PRAKASH, D., SINGH, B.N. & UPADHYAY, G. (2007): Antioxidant and free radical scavenging activities of phenols from onion (Allium cepa). Food Chem., 102, 1389–1393.
REGUEIRO, J., SÁNCHEZ-GONZÁLEZ, C., VALLVERDÚ-QUERALT, A., SIMAL-GÁNDARA, J., LAMUELA-RAVENTÓS, R. &
IZQUIERDO-PULIDO, M. (2014): Comprehensive identifi cation of walnut polyphenols by liquid chromatography coupled to linear ion trap-Orbitrap mass spectrometry. Food Chem., 152, 340–348.
442
ROMEO, F.V., BALLISTRERI, G., FABRONI, S., PANGALLO, S., LI DESTRI NICOSIA, M.G., SCHENA, L. & RAPISARDA, P.
(2015): Chemical characterization of different sumac and pomegranate extracts effective against Botrytis cinerea rots. Molecules, 20, 11941–11958.
SALDANHA, L.L., VILEGAS, W. & DOKKEDAL, A.L. (2013): Characterization of fl avonoids and phenolic acids in Myrcia bella Cambess. Using FIA-ESI-IT-MSn and HPLC-PAD-ESI-IT-MS combined with NMR. Molecules, 18, 8402–8416.
SEERAM, N.P., LEE, R., SCHEULLER, H.S. & HEBER, D. (2006): Identifi cation of phenolic compounds in strawberries by liquid chromatography electrospray ionization mass spectroscopy. Food Chem., 97, 1–11.
SIMIRGIOTIS, M.J., CALIGARI, P.D.S. & SCHMEDA-HIRSCHMANN, G. (2009): Identifi cation of phenolic compounds from the fruits of the mountain papaya Vasconcellea pubescens A. DC. grown in Chile by liquid chromatography- UV detection-mass spectrometry. Food Chem., 115, 775–784.
SUN, J., LIANG, F., BIN, Y., LI, P. & DUAN, C. (2007): Screening non-colored phenolics in red wines using liquid chromatography/ultraviolet and mass spectrometry/mass spectrometry libraries. Molecules, 12, 679–693.
TIBERTI, L.A., YARIWAKE, J.H., NDJOKO, K. & HOSTETTMANN, K. (2007): On-line LC/UV/MS analysis of fl avonols in the three apple varieties most widely cultivated in Brazil. J. Brazil Chem. Soc. 18, 100–105.
WILLIAM, M., YOKOTA, T., LEANC, M.E.J. & CROZIER, A. (2003): Analysis of ellagitannins and conjugates of ellagic acid and quercetin in raspberry fruits by LC-MSn. Phytochemistry, 64, 617–624.
ZHANG, R., WEI, A., YANG, T., SA, W. & YANG, H. (2003): Studies on three kinds of fragrant type rose essential oil properties. Acta Bot. Boreal.-Occident Sin., 23, 1768–1771. (in Chinese)